1. 17th Sept 2014 Aaj Ka Trend
Bullions MCX GOLD Sept Hourly Chart:
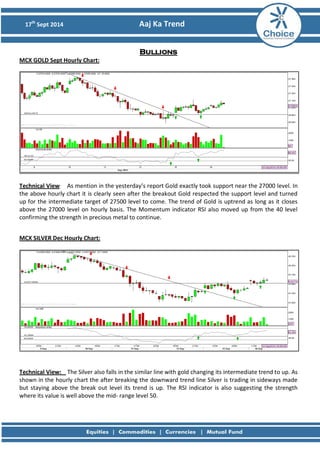
Technical View: As mention in the yesterday’s report Gold exactly took support near the 27000 level. In the above hourly chart it is clearly seen after the breakout Gold respected the support level and turned up for the intermediate target of 27500 level to come. The trend of Gold is uptrend as long as it closes above the 27000 level on hourly basis. The Momentum indicator RSI also moved up from the 40 level confirming the strength in precious metal to continue. MCX SILVER Dec Hourly Chart:
Technical View: The Silver also falls in the similar line with gold changing its intermediate trend to up. As shown in the hourly chart the after breaking the downward trend line Silver is trading in sideways made but staying above the break out level its trend is up. The RSI indicator is also suggesting the strength where its value is well above the mid- range level 50.
2. 17th Sept 2014 Aaj Ka Trend
Fundamental News:
• Gold futures edged higher in range bound trade on Tuesday, as investors remained cautious ahead of the Federal Reserve's two-day policy meeting due to begin later in the day
• The dollar remained well bid as the Fed was expected to cut its asset purchase program by another $10 billion, which would keep it on track for winding up the program in October, and to start raising interest rates sometime in mid-2015.
• Fed officials will release updated economic and interest rate projections at the conclusion of the two- day meeting, extending their forecast horizon through 2017
• Market participants will also pay close attention to a press conference with Fed Chair Janet Yellen on Wednesday for further clues on the timing of the first U.S. rate hike since 2006
Pivot Levels for the Day:
S3
S2
S1
Pivot
R1
R2
R3
Gold
26608
26802
26878
26996
27072
27190
27384
Silver
40640
41084
41281
41528
41725
41972
42416
Recommendation:
Gold
Buy
Silver
Buy
3. 17th Sept 2014 Aaj Ka Trend
Base Metals MCX COPPER Nov Hourly Chart:
Technical Views: MCX Copper after its sideways trend with strong support around 419.50 levels and major resistance at 424 levels. As seen in the above hourly chart of Copper is near the major resistance level 424 with any failure to sustain above the level will bring it back to support levels near 419.50 else trading and closing above it will push Copper to higher levels at 427 levels. RSI indicator is also at the near the over brought level with any failure to stay above the over brought level will confirm the sideways trend in copper to continue.
MCX Aluminum Sept Hourly Chart
MCX Lead Sept Hourly Chart
MCX Nickel Sept Hourly Chart
MCX Zinc Sept Hourly Chart
4. 17th Sept 2014 Aaj Ka Trend
Fundamental News:
• Copper futures fluctuated between small gains and losses in cautious trade on Tuesday, as investors awaited the start of a highly anticipated Federal Reserve meeting later in the day.
• A day earlier, copper futures lost 2.1 cents, or 0.68%, to settle at $3.085, after weekend data showed China's factory output grew at the slowest pace in nearly six years in August
• The disappointing data raised fears the world's second largest economy was losing momentum and added to speculation policymakers in Beijing will have to introduce fresh stimulus to meet the government's 7.5% growth target.
Pivot Levels for the Day:
S1
S2
S3
Pivot
R1
R2
R3
Copper
423.1
415.4
401.9
429
436.6
442.5
456.1
Aluminum
120.9
119.3
116.7
121.8
123.5
124.4
126.9
Lead
127.9
125.9
122.5
129.3
131.3
132.7
136.1
Nickel
1093.9
1074.6
1044.5
1104.7
1124
1134.8
1164.9
Zinc
137.8
135.6
132.1
139.1
141.3
142.6
146.1
Recommendation:
Copper
Sideways
Aluminum
Down
Lead
Down
5. 17th Sept 2014 Aaj Ka Trend
Nickel
Down
Zinc
Buy
Energy MCX CRUDE Sept Hourly Chart:
Technical Views: On the above hourly chart of Crude it is clearly in the major sideways trend with a support near the 5510 levels and now approaching to resistance level 5700. If crude successfully breaks the resistance levels its breakout target comes near 5900 levels else any selling pressure will put Crude back to support levels 5510 with sideways trend to continue. Momentum indicator RSI is also signaling the strength to break the resistance level but falling short to break the resistance level RSI value will be ot utmost importance for the clues in Crude to whether it be sideways or break the resistance level.
6. 17th Sept 2014 Aaj Ka Trend
MCX NATURAL GAS Sept Hourly Chart:
Technical Views: The Natural gas on the hourly chart has break the yesterday’s rising trend line hinting its short term trend is turned down. As long as the Natural gas trades and closes below the trend line it will be selling opportunity in Natural gas with stop at 241.30 levels. The RSI indicator is also losing strength at the over brought levels as seen in the chart confirming the downtrend in Natural gas to continue. Fundamental News:
• U.S. oil futures edged lower on Tuesday, as investors focused on the Federal Reserve's upcoming policy meeting as well as weekly supply data from the U.S
• Oil prices typically weaken when the U.S. currency strengthens as the dollar-priced commodity becomes more expensive for holders of other currencies.
• Market players also awaited the release of fresh weekly information on U.S. stockpiles of crude and refined products to gauge the strength of demand in the world’s largest oil consumer.
• Natural gas prices rose on Monday after updated weather-forecasting models called for seasonably warm temperatures across the southern U.S., which should boost demand for air conditioning
• Natural gas futures were likely to find support at $3.786 per million British thermal units, Friday's low, and resistance at $4.016, last Tuesday's high.
• Updated weather forecasting models pointed to rising temperatures across most of the southern U.S. states in the next three to five days, likely boosting demand for air conditioning
7. 17th Sept 2014 Aaj Ka Trend
• Still, prices came off earlier highs on concerns that temperatures will moderate in the coming two weeks.
Pivot Levels for the Day:
S1
S2
S3
Pivot
R1
R2
R3
Crude
5696
5596
5442
5750
5850
5904
6058
Natural Gas
226.7
227.8
220.1
235.5
234.4
243.2
250.9
Recommendation:
Crude
Sideways
Natural Gas
Sell
8. 17th Sept 2014 Aaj Ka Trend
Ritesh Patel (Research Associate) ritesh.patel@choiceindia.com
Deveya Gaglani (Research Advisor) deveya.gaglani@chocieindia.com
For Private Circulation Only Website: www.choiceindia.com
https://twitter.com/ChoiceBroking https://plus.google.com/115293033595831069270/posts
https://www.youtube.com/user/ChoiceBroking http://www.slideshare.net/choiceindiabroking
https://www.facebook.com/choicebroking
https://www.linkedin.com/company/choice-international-limited
9. 17th Sept 2014 Aaj Ka Trend
Disclaimer
DISCLAIMER: This is solely for information of clients of Choice India and does not construe to be an investment advice. It is also not intended as an offer or solicitation for the purchase and sale of any financial instruments. Any action taken by you on the basis of the information contained herein is your responsibility alone and Choice India its subsidiaries or its employees or associates will not be liable in any manner for the consequences of such action taken by you. We have exercised due diligence in checking the correctness and authenticity of the information contained in this recommendation, but Choice India or any of its subsidiaries or associates or employees shall not be in any way responsible for any loss or damage that may arise to any person from any inadvertent error in the information contained in this recommendation or any action taken on basis of this information. Technical analysis studies market psychology, price patterns and volume levels. It is used to forecast future price and market movements. Technical analysis is complementary to fundamental analysis and news sources. The recommendations issued herewith might be contrary to recommendations issued by Choice India in the company research undertaken as the recommendations stated in this report is derived purely from technical analysis. Choice India has based this document on information obtained from sources it believes to be reliable but which it has not independently verified; Choice India makes no guarantee, representation or warranty and accepts no responsibility or liability as to its accuracy or completeness. The opinions contained within the report are based upon publicly available information at the time of publication and are subject to change without notice. The information and any disclosures provided herein are in summary form and have been prepared for informational purposes. The recommendations and suggested price levels are intended purely for trading purposes. The recommendations are valid for the day of the report however trading trends and volumes might vary substantially on an intraday basis and the recommendations may be subject to change. The information and any disclosures provided herein may be considered confidential. Any use, distribution, modification, copying, forwarding or disclosure by any person is strictly prohibited. The information and any disclosures provided herein do not constitute a solicitation or offer to purchase or sell any security or other financial product or instrument. The current performance may be unaudited. Past performance does not guarantee future returns. There can be no assurance that investments will achieve any targeted rates of return, and there is no guarantee against the loss of your entire investment. POTENTIAL CONFLICT OF INTEREST DISCLOSURE (as on date of report) Disclosure of interest statement – • Analyst interest of the stock /Instrument(s): - No. • Firm interest of the stock / Instrument (s): - No.