1. 14th Nov’14 Aaj Ka Trend
Bullions MCX Gold Dec Hourly Chart
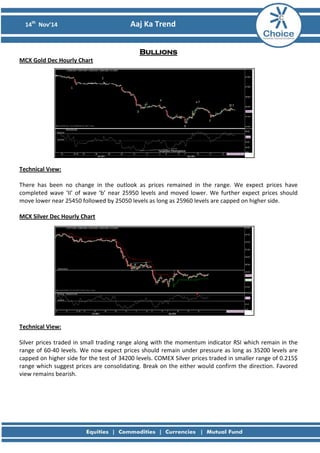
Technical View: There has been no change in the outlook as prices remained in the range. We expect prices have completed wave ‘II’ of wave ‘b’ near 25950 levels and moved lower. We further expect prices should move lower near 25450 followed by 25050 levels as long as 25960 levels are capped on higher side. MCX Silver Dec Hourly Chart
Technical View: Silver prices traded in small trading range along with the momentum indicator RSI which remain in the range of 60-40 levels. We now expect prices should remain under pressure as long as 35200 levels are capped on higher side for the test of 34200 levels. COMEX Silver prices traded in smaller range of 0.215$ range which suggest prices are consolidating. Break on the either would confirm the direction. Favored view remains bearish.
2. 14th Nov’14 Aaj Ka Trend
Fundamental News:
• Gold hits session highs after U.S. jobless claims disappoint.
• Gold prices rose to the highest levels of the session on Thursday, after data showed that the number of people who filed for unemployment assistance in the U.S. last week rose to a six-week high.
• On the Comex division of the New York Mercantile Exchange, gold futures for December delivery rose to a daily high of $1,167.30 a troy ounce, before trimming gains to last trade at $1,162.70 during U.S. morning hours, up $3.60, or 0.31%.
Pivot Levels for the Day:
S1
S2
S3
Pivot
R1
R2
R3
Gold
25693
25563
25315
25811
25941
26059
26307
Silver
34529
34350
33941
34759
34938
35168
35577
Recommendation:
Gold
Sell
Silver
Neutral
3. 14th Nov’14 Aaj Ka Trend
Base Metals MCX Copper Nov Hourly Chart
Technical Views: Prices have taken resistance near the previous intermediate high of 415 levels and drifted lower. Break below previous support of 408 levels would allow sharp fall in prices. The momentum indicator, RSI is below 40 levels which suggest bearishness in prices. We now suggest sell on rallies as long as 412.50 levels are capped on higher side for the test of 404 levels.
MCX Aluminum Nov Hourly Chart
MCX Lead Nov Hourly Chart
MCX Nickel Nov Hourly Chart
MCX Zinc Nov Hourly Chart
4. 14th Nov’14 Aaj Ka Trend
Fundamental News:
• Copper edges lower after weak China data.
• Copper futures edged lower on Thursday, after data showed that China's factory output grew less than expected in October, copper for December delivery shed 0.6 cents, or 0.2% to trade at $3.027 a pound during European morning hours.
• On the Comex division of the New York Mercantile Exchange, copper for December delivery tacked on 0.7 cents, or 0.22% to trade at $3.032 a pound during European morning hours.
Pivot Levels for the Day:
S1
S2
S3
Pivot
R1
R2
R3
Copper
403.8
400.6
391.6
409.5
412.8
418.5
427.4
Aluminum
125.3
124.5
122.2
126.8
127.6
129.1
131.4
Lead
123.1
122.0
119.3
124.7
125.8
127.4
130.1
Nickel
934.8
925.2
898.2
952.2
961.8
979.2
1006.2
Zinc
136.7
135.5
132.1
138.9
140.1
142.3
145.7
Recommendation:
Copper
Sell
Aluminum
Sell
Lead
Sell
Nickel
Sell
Zinc
Sell
5. 14th Nov’14 Aaj Ka Trend
Energy MCX Crude Nov Hourly Chart:
Technical Views: Prices have broken the previous support of 4700 levels and made its intraday low of 4627 levels. We expect trend remains bearish as prices have broken its crucial support level of 4700 levels. The momentum indicator, RSI has also fall below 40 levels which would add bearishness to the prices. We suggest sell near 4675 levels for the test of 4600/4580 levels while resistance lies at 4730 levels. MCX Natural Gas Oct Hourly Chart:
Technical Views: As expected prices moved lower achieving the target of 250 levels. We further expect prices should move lower near 245/243 levels as long as 257.50 is capped on higher side. It can be observed from the above chart that prices have given close below descending triangle (consolidation) formation.
6. 14th Nov’14 Aaj Ka Trend
Fundamental News:
• Natural gas futures drop a fourth day on moderating weather.
• U.S. natural gas prices fell for the fourth consecutive session on Thursday, as weather forecasting models pointed to milder temperatures across the U.S. later this month. On the New York Mercantile Exchange, natural gas for delivery in December lost 8.5 cents, or 1.99%, to trade at $4.163 per million British thermal units during U.S. morning hours
• On the New York Mercantile Exchange, natural gas for delivery in December fell by as much as 2.2% to touch a daily low of $4.092 per million British thermal units, the weakest level since November 4.
• Oil futures plunge to 4-year lows amid global supply glue.
• Oil futures tumbled to the lowest level in more than four years on Thursday, as ongoing concerns over a glut in world markets continued to drive prices lower
Pivot Levels for the Day:
S1
S2
S3
Pivot
R1
R2
R3
Crude
4593
4546
4417
4675
4722
4804
4933
Natural Gas
213.3
227.5
219.5
235.5
221.3
243.5
251.5
Recommendation:
Crude
Sell
Natural Gas
Sell
8. 14th Nov’14 Aaj Ka Trend
This is solely for information of clients of Choice Broking and does not construe to be an investment advice. It is also not intended as an offer or solicitation for the purchase and sale of any financial instruments. Any action taken by you on the basis of the information contained herein is your responsibility alone and Choice Broking its subsidiaries or its employees or associates will not be liable in any manner for the consequences of such action taken by you. We have exercised due diligence in checking the correctness and authenticity of the information contained in this recommendation, but Choice Broking or any of its subsidiaries or associates or employees shall not be in any way responsible for any loss or damage that may arise to any person from any inadvertent error in the information contained in this recommendation or any action taken on basis of this information. Technical analysis studies market psychology, price patterns and volume levels. It is used to forecast future price and market movements. Technical analysis is complementary to fundamental analysis and news sources. The recommendations issued herewith might be contrary to recommendations issued by Choice Broking in the company research undertaken as the recommendations stated in this report is derived purely from technical analysis. Choice Broking has based this document on information obtained from sources it believes to be reliable but which it has not independently verified; Choice Broking makes no guarantee, representation or warranty and accepts no responsibility or liability as to its accuracy or completeness. The opinions contained within the report are based upon publicly available information at the time of publication and are subject to change without notice. The information and any disclosures provided herein are in summary form and have been prepared for informational purposes. The recommendations and suggested price levels are intended purely for trading purposes. The recommendations are valid for the day of the report however trading trends and volumes might vary substantially on an intraday basis and the recommendations may be subject to change. The information and any disclosures provided herein may be considered confidential. Any use, distribution, modification, copying, forwarding or disclosure by any person is strictly prohibited. The information and any disclosures provided herein do not constitute a solicitation or offer to purchase or sell any security or other financial product or instrument. The current performance may be unaudited. Past performance does not guarantee future returns. There can be no assurance that investments will achieve any targeted rates of return, and there is no guarantee against the loss of your entire investment. POTENTIAL CONFLICT OF INTEREST DISCLOSURE (as on date of report) Disclosure of interest statement – • Analyst interest of the stock /Instrument(s): - No. • Firm interest of the stock / Instrument (s): - No.
Disclaimer