Aaj ka trend 29.09.14
•
0 likes•76 views

The document provides technical analysis and recommendations for bullion and base metal futures trading on the MCX for September 29th, 2014. It summarizes the daily charts and trends for gold, silver, copper, aluminum, lead, nickel, zinc, crude oil, and natural gas. The analysis indicates that gold and silver prices remain in an uptrend, while copper may trade sideways. Most other metals are predicted to trend upward, except for lead which may sell off. Crude oil and natural gas are also expected to continue rising.

Recommended
More Related Content
What's hot
What's hot (18)
Viewers also liked
Viewers also liked (12)
Similar to Aaj ka trend 29.09.14
Similar to Aaj ka trend 29.09.14 (17)
Aaj ka trend 29.09.14
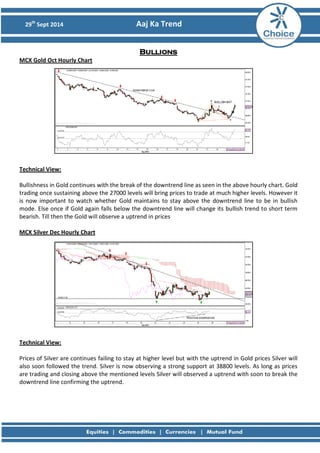
- 1. 29th Sept 2014 Aaj Ka Trend Bullions MCX Gold Oct Hourly Chart Technical View: Bullishness in Gold continues with the break of the downtrend line as seen in the above hourly chart. Gold trading once sustaining above the 27000 levels will bring prices to trade at much higher levels. However it is now important to watch whether Gold maintains to stay above the downtrend line to be in bullish mode. Else once if Gold again falls below the downtrend line will change its bullish trend to short term bearish. Till then the Gold will observe a uptrend in prices MCX Silver Dec Hourly Chart Technical View: Prices of Silver are continues failing to stay at higher level but with the uptrend in Gold prices Silver will also soon followed the trend. Silver is now observing a strong support at 38800 levels. As long as prices are trading and closing above the mentioned levels Silver will observed a uptrend with soon to break the downtrend line confirming the uptrend.
- 2. 29th Sept 2014 Aaj Ka Trend Fundamental News: • Gold prices dropped to trade near nine-month lows on Thursday, as the broadly stronger U.S. dollar continued to weigh on demand for the precious metal. • Demand for the dollar continued to be underpinned after a report on Wednesday showed that U.S. new home sales data rose 18.0% last month to 504,000 units, the highest level since May 2008. • Earlier in the week, a report showed that the U.S. manufacturing sector expanded in September, matching the rate of growth seen in the previous month, which was the strongest in over four years. Pivot Levels for the Day: S1 S2 S3 Pivot R1 R2 R3 Gold 26652 26512 26130 26894 27034 27276 27658 Silver 38902 38634 38001 39267 39535 39900 40533 Recommendation: Gold Buy Silver Buy
- 3. 29th Sept 2014 Aaj Ka Trend Base Metals MCX Copper Nov Hourly Chart Technical Views: MCX Copper is now trading in sideways trend with prices facing strong resistance at 418 levels and strong support at 412 levels. With above mentioned levels Copper is now trading in the mentioned range with a breakout at either side will bring a trend in Copper prices till then sideways trend to continue in prices. MCX Aluminum Sept Hourly Chart MCX Lead Sept Hourly Chart MCX Nickel Sept Hourly Chart MCX Zinc Sept Hourly Chart
- 4. 29th Sept 2014 Aaj Ka Trend Fundamental News: • Copper output from sulphide from Aktogay is expected to begin in 2017. • Since then prices have fluctuated in a range and only fallen below mid-August prices in the last few days. One of the support factors is LME stocks, which are at the lowest level since 2009 with current headline inventory of 153,700 tons close to 6-year lows, while available tonnage, excluding metal that has been canceled prior to physical drawdown, is lower still at 116,600 tons. Pivot Levels for the Day: S1 S2 S3 Pivot R1 R2 R3 Copper 414.50 412.60 408.20 417.0 418.90 421.40 425.80 Aluminum 117.5 117.1 116.0 118.2 118.6 119.3 120.4 Lead 126.3 125.7 124.4 127.0 127.6 128.3 129.6 Nickel 1022.2 1010.3 977.3 1043.3 1055.2 1076.3 1109.3 Zinc 138.5 138.0 136.9 139.2 139.7 140.3 141.5 Recommendation: Copper Sideways Aluminum Buy Lead Sell Nickel Buy Zinc Buy
- 5. 29th Sept 2014 Aaj Ka Trend Energy MCX Crude Oct Hourly Chart: Technical Views: The uptrend in Crude prices continues with prices are now trading well above the 5700 levels. The next important trend to watch will be the if Crude maintains to stay above the 5800 levels or any short term correction bring the prices back to trade below the 5700 levels. Currently trend in Crude is up till prices trade above 5700 levels so any small correction with prices staying above the 5700 levels will be a buying opportunity in Crude. MCX Natural Gas Sept Hourly Chart: Technical Views: Natural gas is also observing the strong uptrend in prices with break of the 235 levels in the previous trading session prices are now observing a strong up move. RSI values are also observing the strong momentum as prices are approaching higher levels. The next important levels is 240 to be watch if prices maintains to stay above the levels then the uptrend will be intact with next target of 252 levels.
- 6. 29th Sept 2014 Aaj Ka Trend Fundamental News: • Crude oil futures slipped lower on Thursday, after rising to a four-day high fuelled by a decline in U.S. stockpiles, as ample supply from the Middle East continued to weigh. • In a report, the Energy Information Administration said that crude inventories dropped 4.3 million barrels in the week ending September 19, confounding expectations of an increase of 386,000 barrels. • But gains were limited as Saudi Arabia, the world's largest oil exporter, said it pumped 9.597 million barrels of oil per day in August. • Natural gas prices carried Wednesday's gains into Thursday after updated weather-forecasting models continued to call for cooler temperatures to trek across the U.S. in October. Pivot Levels for the Day: S1 S2 S3 Pivot R1 R2 R3 Crude 5704 5632 5521 5743 5815 5854 5965 Natural Gas 222.0 230.9 226.3 235.5 226.6 240.1 244.7 Recommendation: Crude Buy Natural Gas Buy
- 7. 29th Sept 2014 Aaj Ka Trend Sumeet Bagadia (Associate Director) sumeet.bagadia@choiceindia.com Ritesh Patel (Research Associate) ritesh.patel@choiceindia.com Deveya Gaglani (Research Advisor) deveya.gaglani@chocieindia.com For Private Circulation Only Website: www.choiceindia.com https://twitter.com/ChoiceBroking http://www.slideshare.net/choiceindiabroking https://www.youtube.com/user/ChoiceBroking https://plus.google.com/115293033595831069270/posts https://www.facebook.com/pages/Choice-Equity-Broking-Pvt-Ltd/352491718249644 https://www.linkedin.com/company/choice-international-limited?trk=parent_company_logo
- 8. 29th Sept 2014 Aaj Ka Trend Disclaimer This is solely for information of clients of Choice India and does not construe to be an investment advice. It is also not intended as an offer or solicitation for the purchase and sale of any financial instruments. Any action taken by you on the basis of the information contained herein is your responsibility alone and Choice India its subsidiaries or its employees or associates will not be liable in any manner for the consequences of such action taken by you. We have exercised due diligence in checking the correctness and authenticity of the information contained in this recommendation, but Choice India or any of its subsidiaries or associates or employees shall not be in any way responsible for any loss or damage that may arise to any person from any inadvertent error in the information contained in this recommendation or any action taken on basis of this information. Technical analysis studies market psychology, price patterns and volume levels. It is used to forecast future price and market movements. Technical analysis is complementary to fundamental analysis and news sources. The recommendations issued herewith might be contrary to recommendations issued by Choice India in the company research undertaken as the recommendations stated in this report is derived purely from technical analysis. Choice India has based this document on information obtained from sources it believes to be reliable but which it has not independently verified; Choice India makes no guarantee, representation or warranty and accepts no responsibility or liability as to its accuracy or completeness. The opinions contained within the report are based upon publicly available information at the time of publication and are subject to change without notice. The information and any disclosures provided herein are in summary form and have been prepared for informational purposes. The recommendations and suggested price levels are intended purely for trading purposes. The recommendations are valid for the day of the report however trading trends and volumes might vary substantially on an intraday basis and the recommendations may be subject to change. The information and any disclosures provided herein may be considered confidential. Any use, distribution, modification, copying, forwarding or disclosure by any person is strictly prohibited. The information and any disclosures provided herein do not constitute a solicitation or offer to purchase or sell any security or other financial product or instrument. The current performance may be unaudited. Past performance does not guarantee future returns. There can be no assurance that investments will achieve any targeted rates of return, and there is no guarantee against the loss of your entire investment. POTENTIAL CONFLICT OF INTEREST DISCLOSURE (as on date of report) Disclosure of interest statement – • Analyst interest of the stock /Instrument(s): - No. • Firm interest of the stock / Instrument (s): - No.