Aaj ka trend 21.10.14
•
0 likes•41 views

- Prices of gold and copper moved higher according to technical analysis, achieving short-term targets and supported by momentum indicators. Bias remains bullish for gold. - Silver prices are trading sideways in a consolidation formation over past trading sessions according to technical analysis. - Crude oil futures resumed their decline, falling over $1, due to concerns over global economic outlook and future demand, while natural gas futures fell to an 11-month low on expectations of mild weather dampening early-winter demand.

Recommended
More Related Content
What's hot
What's hot (20)
Viewers also liked
Similar to Aaj ka trend 21.10.14
Similar to Aaj ka trend 21.10.14 (16)
Aaj ka trend 21.10.14
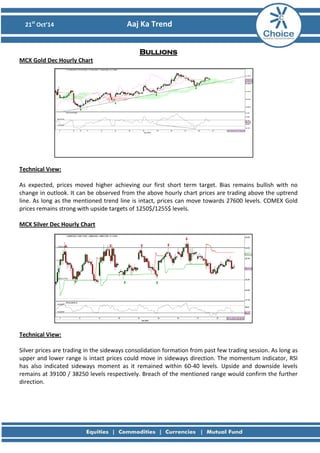
- 1. 21st Oct’14 Aaj Ka Trend Bullions MCX Gold Dec Hourly Chart Technical View: As expected, prices moved higher achieving our first short term target. Bias remains bullish with no change in outlook. It can be observed from the above hourly chart prices are trading above the uptrend line. As long as the mentioned trend line is intact, prices can move towards 27600 levels. COMEX Gold prices remains strong with upside targets of 1250$/1255$ levels. MCX Silver Dec Hourly Chart Technical View: Silver prices are trading in the sideways consolidation formation from past few trading session. As long as upper and lower range is intact prices could move in sideways direction. The momentum indicator, RSI has also indicated sideways moment as it remained within 60-40 levels. Upside and downside levels remains at 39100 / 38250 levels respectively. Breach of the mentioned range would confirm the further direction.
- 2. 21st Oct’14 Aaj Ka Trend Fundamental News: • Gold futures edged higher, as investors continued to speculate over the timing of a rate hike in the U.S. • Futures were likely to find support at $1,222.00, the low from October 15, and resistance at $1,250.30, the high from October 15. • Gold edges higher with Fed rate outlook in focus. • On the Comex division of the New York Mercantile Exchange, gold for December delivery traded at $1,241.80 a troy ounce during European morning hours, up $2.80, or 0.23%. Pivot Levels for the Day: S1 S2 S3 Pivot R1 R2 R3 Gold 27249 27084 26798 27370 27535 27656 27942 Silver 38354 38176 37763 38589 38767 39002 39415 Recommendation: Gold Buy Silver Neutral
- 3. 21st Oct’14 Aaj Ka Trend Base Metals MCX Copper Nov Hourly Chart Technical Views: From the above chart, it can be observed that prices have taken support near the previous intermediate bottom of 405 levels. The momentum indicator, RSI has also formed positive divergence which would give positive confirmation to the prices. As long as previous intermediate low of 405 is intact we expect prices can rally towards 411/415 levels. MCX Aluminum Oct Hourly Chart MCX Lead Oct Hourly Chart MCX Nickel Oct Hourly Chart MCX Zinc Oct Hourly Chart
- 4. 21st Oct’14 Aaj Ka Trend Fundamental News: • Copper slips on worries over rising stocks, China economy. • London copper futures fell on Monday after hitting their lowest levels in six months in the previous session, hurt by worries over rising stocks, China's economic growth and the impending end of U.S. monetary stimulus. • Copper has some of the weakest fundamentals among base metals as a wave of fresh supply works its way into the market. Pivot Levels for the Day: S1 S2 S3 Pivot R1 R2 R3 Copper 404.6 402.2 397.5 406.9 409.3 411.6 416.3 Aluminum 119.7 118.9 117.0 120.7 121.5 122.6 124.4 Lead 122.1 121.4 119.4 123.4 124.1 125.4 127.4 Nickel 922.7 910.8 877.8 943.8 955.7 976.8 1009.8 Zinc 133.9 132.8 129.6 136.0 137.1 139.2 142.4 Recommendation: Copper Buy Aluminum Buy Lead Sell Nickel Sell on Rallies Zinc Sell
- 5. 21st Oct’14 Aaj Ka Trend Energy MCX Crude Nov Hourly Chart: Technical Views: As mentioned prices initially moved lower but failed to break the previous low of 4950 and moved higher. Bollinger band has narrowed which is suggesting volatility has decreased. Cut on either of the band could take prices in the same direction. Favored view remains bullish as the momentum indicator, RSI has also taken support near 40 levels. For now, as long as 4935 levels are protected on downside prices can head towards 5125/5250 levels. MCX Natural Gas Oct Hourly Chart: Technical Views: As expected prices moved lower achieving both the short term targets. However, we remains cautious in shorting the natural gas as prices are trading near the crucial support of 224 levels. Sustaining above the mentioned level could head 228/230 levels while breach of the level could drift prices near 220 levels. However RSI is in oversold zone which suggest pullback in prices.
- 6. 21st Oct’14 Aaj Ka Trend Fundamental News: • Crude oil futures resume decline, Brent down more than $1. • Crude oil prices fell to the lowest levels of the session during U.S. morning trade on Monday, as market players remained concerned over the global economic outlook and the impact on future demand prospects.. • On the ICE Futures Exchange in London, Brent for December delivery slumped $1.47, or 1.7%, to trade at $84.70 a barrel during U.S. morning hours • Natural gas futures tumble to 11-month low on mild weather. • U.S. natural gas futures fell to an 11-month low, as investors bet that mild weather will dampen early-winter demand for the heating fuel. Pivot Levels for the Day: S1 S2 S3 Pivot R1 R2 R3 Crude 5012 4944 4825 5063 5131 5182 5301 Natural Gas 240.6 230.2 224.9 235.5 245.9 240.8 246.1 Recommendation: Crude Buy Natural Gas Neutral
- 7. 21st Oct’14 Aaj Ka Trend Sumeet Bagadia (Associate Director) sumeet.bagadia@choiceindia.com Ritesh Patel (Research Associate) ritesh.patel@choiceindia.com Deveya Gaglani (Research Advisor) deveya.gaglani@chocieindia.com For Private Circulation Only Website: www.choiceindia.com https://twitter.com/ChoiceBroking http://www.slideshare.net/choiceindiabroking https://www.youtube.com/user/ChoiceBroking https://plus.google.com/115293033595831069270/posts https://www.facebook.com/pages/Choice-Equity-Broking-Pvt-Ltd/352491718249644 https://www.linkedin.com/company/choice-international-limited?trk=parent_company_logo
- 8. 21st Oct’14 Aaj Ka Trend This is solely for information of clients of Choice India and does not construe to be an investment advice. It is also not intended as an offer or solicitation for the purchase and sale of any financial instruments. Any action taken by you on the basis of the information contained herein is your responsibility alone and Choice India its subsidiaries or its employees or associates will not be liable in any manner for the consequences of such action taken by you. We have exercised due diligence in checking the correctness and authenticity of the information contained in this recommendation, but Choice India or any of its subsidiaries or associates or employees shall not be in any way responsible for any loss or damage that may arise to any person from any inadvertent error in the information contained in this recommendation or any action taken on basis of this information. Technical analysis studies market psychology, price patterns and volume levels. It is used to forecast future price and market movements. Technical analysis is complementary to fundamental analysis and news sources. The recommendations issued herewith might be contrary to recommendations issued by Choice India in the company research undertaken as the recommendations stated in this report is derived purely from technical analysis. Choice India has based this document on information obtained from sources it believes to be reliable but which it has not independently verified; Choice India makes no guarantee, representation or warranty and accepts no responsibility or liability as to its accuracy or completeness. The opinions contained within the report are based upon publicly available information at the time of publication and are subject to change without notice. The information and any disclosures provided herein are in summary form and have been prepared for informational purposes. The recommendations and suggested price levels are intended purely for trading purposes. The recommendations are valid for the day of the report however trading trends and volumes might vary substantially on an intraday basis and the recommendations may be subject to change. The information and any disclosures provided herein may be considered confidential. Any use, distribution, modification, copying, forwarding or disclosure by any person is strictly prohibited. The information and any disclosures provided herein do not constitute a solicitation or offer to purchase or sell any security or other financial product or instrument. The current performance may be unaudited. Past performance does not guarantee future returns. There can be no assurance that investments will achieve any targeted rates of return, and there is no guarantee against the loss of your entire investment. POTENTIAL CONFLICT OF INTEREST DISCLOSURE (as on date of report) Disclosure of interest statement – • Analyst interest of the stock /Instrument(s): - No. • Firm interest of the stock / Instrument (s): - No. Disclaimer