Download to read offline

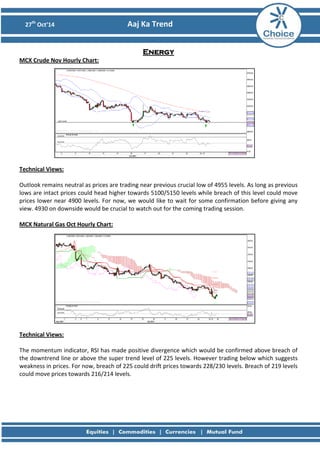
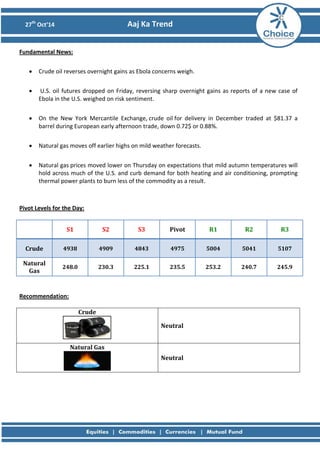

The document provides a technical analysis of gold, silver, and base metals markets. It indicates that gold and silver prices have moved lower and momentum indicators suggest a lack of momentum, pointing to further weakness. For copper, the analysis signals a potential move lower as prices have retraced 61.8% of a previous down move and an evening star candlestick pattern has formed near support levels. Pivot levels and recommendations to sell various metals are also presented.


