1. 02nd Dec’14 Aaj Ka Trend
Bullions
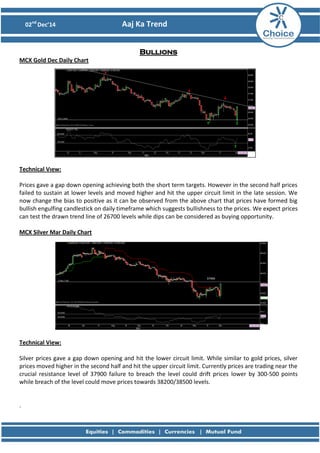
MCX Gold Dec Daily Chart
Technical View:
Prices gave a gap down opening achieving both the short term targets. However in the second half prices failed to sustain at lower levels and moved higher and hit the upper circuit limit in the late session. We now change the bias to positive as it can be observed from the above chart that prices have formed big bullish engulfing candlestick on daily timeframe which suggests bullishness to the prices. We expect prices can test the drawn trend line of 26700 levels while dips can be considered as buying opportunity.
MCX Silver Mar Daily Chart
Technical View:
Silver prices gave a gap down opening and hit the lower circuit limit. While similar to gold prices, silver prices moved higher in the second half and hit the upper circuit limit. Currently prices are trading near the crucial resistance level of 37900 failure to breach the level could drift prices lower by 300-500 points while breach of the level could move prices towards 38200/38500 levels.
.
2. 02nd Dec’14 Aaj Ka Trend
Fundamental News: Gold futures rally off the lows to trade 1% higher Gold prices reversed earlier losses to trade higher on Monday, as investors closed out bets on lower prices, a move known as short covering. On the Comex division of the New York Mercantile Exchange, gold futures for February delivery rose 0.43%, or $5.00, to trade at $1,180.50 a troy ounce during U.S. morning hours. Futures fell by as much as 2.86% during Asian trading hours to hit $1,141.80 a troy ounce, the weakest level since November 7, after Swiss voters voted against a proposal requiring the Swiss central bank to boost its gold reserves.
Pivot Levelsfor the Day:
S1
S2
S3
Pivot
R1
R2
R3 Gold 25633 24758 23416 26100 26975 27442 28784
Silver
33916
31109
26785
35433
38240
39757
44081
Recommendation:
Gold
Buy on dips Silver Buy on dips
3. 02nd Dec’14 Aaj Ka Trend
Base Metals
MCX Copper Feb Hourly Chart
Technical Views:
Initially prices drifted lower and tested the previous bottom level of 390. However in the second half prices moved higher and moved above 400 levels. Prices are trading below its resistance of 407 levels so we expect prices could test the same level and above which prices could head 410 levels while failure to breach the levels would move prices lower near 400 levels.
MCX Aluminum Dec Hourly Chart
MCX Lead Dec Hourly Chart
MCX Nickel Dec Daily Chart
MCX Zinc Dec Hourly Chart
4. 02nd Dec’14 Aaj Ka Trend
Fundamental News:
Copper futures fall to 4-year low on China slowdown concerns On the Comex division of the New York Mercantile Exchange, copper for March delivery fell by as much as 2.3% to touch a daily low of $2.779 a pound, a level not seen since June 2010, before recovering to last trade at $2.839 during European morning hours, down 0.6 cents, or 0.21%. Copper futures fell to the lowest level in more than four years on Monday, as market players digested a pair of reports on Chinese November factory activity, which provided more evidence of a slowdown in the world's second largest economy.
Pivot Levels for the Day:
S1
S2
S3
Pivot
R1
R2
R3 Copper 394.6 385.7 372.1 399.3 408.2 412.9 426.5
Aluminum
124.6
123.1
120.8
125.4
126.9
127.7
130.0 Lead 126.3 124.5 121.6 127.3 129.1 130.2 133.0
Nickel
995.1
977.2
948.5
1005.9
1023.8
1034.6
1063.3 Zinc 137.0 135.0 132.0 138.1 140.0 141.1 144.2
Recommendation:
Copper
Buy
Aluminum
Neutral
Lead
Buy
Nickel
Neutral
Zinc
Buy
5. 02nd Dec’14 Aaj Ka Trend
Energy
MCX Crude Dec Hourly Chart:
Technical Views:
Prices drifted lower achieving both the short term targets. We now remain cautious as prices are trading near the downtrend line above which prices could rally towards 4350 levels while failure to breach the levels could drift prices towards 4180 levels. Favored view remains buy as on daily timeframe prices have formed hammer candlestick which would give bullishness to prices.
MCX Natural Gas Dec Hourly Chart:
Technical Views:
Prices moved lower as exacted and tested the lower band of the consolidation formation. We now expect prices could head higher near 256 as long as 242 levels are protected on downside. The momentum indicator, RSI remains below 40 levels above which momentum will support the prices.
6. 02nd Dec’14 Aaj Ka Trend
Fundamental News: Oil futures erase losses to trade up 2% on weaker dollar West Texas Intermediate and Brent oil prices erased earlier losses to trade 2% higher on Monday, as a broadly weaker U.S. dollar lured investors back to the market. On the New York Mercantile Exchange, crude oil for delivery in January fell by as much as 3.6% to touch a daily low of $63.75 a barrel, a level not seen since July 2009, before turning higher to trade at $67.31 during U.S. morning hours, up $1.18, or 1.78%. On Friday, New-York traded oil futures sank $7.54, or 10.23%, to end at $66.15 a barrel. Nymex oil futures lost $10.36, or 13.54%, last week. Prices ended November down 18.07%, the worst monthly decline since October 2008. Natural gas futures plunge 3% on warm December forecasts U.S. natural gas prices extended sharp losses from the previous session on Monday, as updated weather forecasting models for the first two weeks of December pointed to a return to mild weather, prompting investors to bet that utilities and homes will burn less natural gas as demand for heating falls. On the New York Mercantile Exchange, natural gas for delivery in January fell by as much as 2.95% to touch a daily low of $3.950 per million British thermal units, the weakest level since November 14, before recovering to last trade at $3.992, down 9.4 cents, or 2.3%.
Pivot Levels for the Day:
S1
S2
S3
Pivot
R1
R2
R3 Crude 4073 3875 3570 4180 4378 4485 4790
Natural Gas
241
237
224
249
253
261
273
7. 02nd Dec’14 Aaj Ka Trend
Recommendation:
Crude
Buy
Natural Gas
Buy
9. 02nd Dec’14 Aaj Ka Trend
This is solely for information of clients of Choice Broking and does not construe to be an investment advice. It is also not intended as an offer or solicitation for the purchase and sale of any financial instruments. Any action taken by you on the basis of the information contained herein is your responsibility alone and Choice Broking its subsidiaries or its employees or associates will not be liable in any manner for the consequences of such action taken by you. We have exercised due diligence in checking the correctness and authenticity of the information contained in this recommendation, but Choice Broking or any of its subsidiaries or associates or employees shall not be in any way responsible for any loss or damage that may arise to any person from any inadvertent error in the information contained in this recommendation or any action taken on basis of this information. Technical analysis studies market psychology, price patterns and volume levels. It is used to forecast future price and market movements. Technical analysis is complementary to fundamental analysis and news sources. The recommendations issued herewith might be contrary to recommendations issued by Choice Broking in the company research undertaken as the recommendations stated in this report is derived purely from technical analysis. Choice Broking has based this document on information obtained from sources it believes to be reliable but which it has not independently verified; Choice Broking makes no guarantee, representation or warranty and accepts no responsibility or liability as to its accuracy or completeness. The opinions contained within the report are based upon publicly available information at the time of publication and are subject to change without notice. The information and any disclosures provided herein are in summary form and have been prepared for informational purposes. The recommendations and suggested price levels are intended purely for trading purposes. The recommendations are valid for the day of the report however trading trends and volumes might vary substantially on an intraday basis and the recommendations may be subject to change. The information and any disclosures provided herein may be considered confidential. Any use, distribution, modification, copying, forwarding or disclosure by any person is strictly prohibited. The information and any disclosures provided herein do not constitute a solicitation or offer to purchase or sell any security or other financial product or instrument. The current performance may be unaudited. Past performance does not guarantee future returns. There can be no assurance that investments will achieve any targeted rates of return, and there is no guarantee against the loss of your entire investment.
POTENTIAL CONFLICT OF INTEREST DISCLOSURE (as on date of report) Disclosure of interest statement – • Analyst interest of the stock /Instrument(s): - No. • Firm interest of the stock / Instrument (s): - No.
Disclaimer