1. 19th Nov’14 Aaj Ka Trend
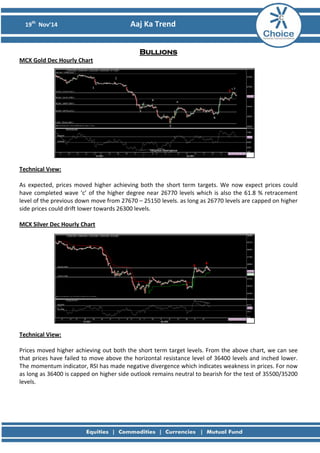
Bullions MCX Gold Dec Hourly Chart
Technical View: As expected, prices moved higher achieving both the short term targets. We now expect prices could have completed wave ‘c’ of the higher degree near 26770 levels which is also the 61.8 % retracement level of the previous down move from 27670 – 25150 levels. as long as 26770 levels are capped on higher side prices could drift lower towards 26300 levels. MCX Silver Dec Hourly Chart
Technical View: Prices moved higher achieving out both the short term target levels. From the above chart, we can see that prices have failed to move above the horizontal resistance level of 36400 levels and inched lower. The momentum indicator, RSI has made negative divergence which indicates weakness in prices. For now as long as 36400 is capped on higher side outlook remains neutral to bearish for the test of 35500/35200 levels.
2. 19th Nov’14 Aaj Ka Trend
Fundamental News:
• Gold prices traded above the key $1,200-level for the first time in more than two-weeks on Tuesday, before pulling back slightly as investors locked in gains.
• On the Comex division of the New York Mercantile Exchange, gold futures for December delivery rose by as much as 1.71% to hit a daily high of $1,204.10 a troy ounce, the most since October 30.
Pivot Levels for the Day:
S1
S2
S3
Pivot
R1
R2
R3
Gold
26401
26205
25823
26587
26783
26969
27351
Silver
35517
35229
34510
35948
36236
36667
37386
Recommendation:
Gold
Sell
Silver
Neutral
3. 19th Nov’14 Aaj Ka Trend
Base Metals MCX Copper Nov Hourly Chart
Technical Views: Prices initially moved little above 415 but failed to move above that and drifted lower. In the second half of the trading session prices have given close below the descending triangle formation formed on the hourly timeframe. The momentum indicator, RSI has also given bearish range shift on hourly chart which suggest weakness in prices. For now we expect prices can test 407/406 levels while upside remain capped at 413 levels.
MCX Aluminum Nov Hourly Chart
MCX Lead Nov Hourly Chart
MCX Nickel Nov Hourly Chart
MCX Zinc Nov 15 Mins Chart
4. 19th Nov’14 Aaj Ka Trend
Fundamental News:
• Copper futures edged lower on Tuesday, as mounting concerns over the health of China's property sector dampened appetite for the red metal.
• On the Comex division of the New York Mercantile Exchange, copper for December delivery shed 0.8 cents, or 0.26% to trade at $3.032 a pound during European morning hours.
Pivot Levels for the Day:
S1
S2
S3
Pivot
R1
R2
R3
Copper
406.9
404.6
398.1
411.1
413.4
417.6
424.1
Aluminum
124.2
123.4
121.6
125.3
126.0
127.1
129.0
Lead
123.9
123.1
121.2
125.0
125.8
126.9
128.8
Nickel
953.8
945.6
924.6
966.6
974.8
987.6
1008.6
Zinc
138.0
137.4
135.9
138.8
139.5
140.3
141.7
Recommendation:
Copper
Sell
Aluminum
Sell Below 124.70
Lead
Neutral
Nickel
Neutral
Zinc
Sell
5. 19th Nov’14 Aaj Ka Trend
Energy MCX Crude Nov Daily Chart:
Technical Views: In the first half of the trading session prices moved higher made its intraday high of 4723 but failed to give hourly close above 4710 levels and drifted lower below 4600 levels. Prices are trading near 61.8% retracement level of the previous up move from 4522 – 4727 levels. We now remain cautious as long as prices are trading near the mentioned levels as the momentum indicator, RSI is also taking support near 40 levels. MCX Natural Gas Oct Hourly Chart:
Technical Views: Initially prices moved higher achieving first short term target of 266 which happens to be the 61.8% retracement level of the down move from 279 – 244 levels and moved lower. It can be observed that prices have moved higher in the last hour of the trading session and RSI has formed positive reversal which suggests strength in prices. For now, as long as 255 levels are protected on down side prices can head towards 267/270 levels.
6. 19th Nov’14 Aaj Ka Trend
Fundamental News: .
• Oil futures declined on Tuesday, amid speculation the Organization of the Petroleum Exporting Countries will not cut output to support prices when it meets later this month.
• On the ICE Futures Exchange in London, Brent oil for January delivery lost 60 cents, or 0.76%, to trade at $78.71 a barrel.
• London-traded Brent futures fell to a four-year low of $76.76 a barrel on November 14.
• U.S. natural gas prices were under pressure during early U.S. morning hours on Tuesday, as investors cashed out of the market to lock in gains from the previous session's 8% rally.
• On the New York Mercantile Exchange, natural gas for delivery in December fell 10.0 cents, or 2.3%, to trade at $4.241 per million British thermal units during U.S. morning hours.
• A day earlier, natural gas prices soared 32.1 cents, or 7.99%, to settle at $4.341 per million British thermal units, after a blast of cold air shot across the U.S. and fueled expectations for increased heating demand.
Pivot Levels for the Day:
S1
S2
S3
Pivot
R1
R2
R3
Crude
4555
4503
4367
4639
4691
4775
4911
Natural Gas
203.2
224.6
213.7
235.5
214.1
246.4
257.3
Recommendation:
Crude
Neutral
Natural Gas
Buy
8. 19th Nov’14 Aaj Ka Trend
This is solely for information of clients of Choice Broking and does not construe to be an investment advice. It is also not intended as an offer or solicitation for the purchase and sale of any financial instruments. Any action taken by you on the basis of the information contained herein is your responsibility alone and Choice Broking its subsidiaries or its employees or associates will not be liable in any manner for the consequences of such action taken by you. We have exercised due diligence in checking the correctness and authenticity of the information contained in this recommendation, but Choice Broking or any of its subsidiaries or associates or employees shall not be in any way responsible for any loss or damage that may arise to any person from any inadvertent error in the information contained in this recommendation or any action taken on basis of this information. Technical analysis studies market psychology, price patterns and volume levels. It is used to forecast future price and market movements. Technical analysis is complementary to fundamental analysis and news sources. The recommendations issued herewith might be contrary to recommendations issued by Choice Broking in the company research undertaken as the recommendations stated in this report is derived purely from technical analysis. Choice Broking has based this document on information obtained from sources it believes to be reliable but which it has not independently verified; Choice Broking makes no guarantee, representation or warranty and accepts no responsibility or liability as to its accuracy or completeness. The opinions contained within the report are based upon publicly available information at the time of publication and are subject to change without notice. The information and any disclosures provided herein are in summary form and have been prepared for informational purposes. The recommendations and suggested price levels are intended purely for trading purposes. The recommendations are valid for the day of the report however trading trends and volumes might vary substantially on an intraday basis and the recommendations may be subject to change. The information and any disclosures provided herein may be considered confidential. Any use, distribution, modification, copying, forwarding or disclosure by any person is strictly prohibited. The information and any disclosures provided herein do not constitute a solicitation or offer to purchase or sell any security or other financial product or instrument. The current performance may be unaudited. Past performance does not guarantee future returns. There can be no assurance that investments will achieve any targeted rates of return, and there is no guarantee against the loss of your entire investment. POTENTIAL CONFLICT OF INTEREST DISCLOSURE (as on date of report) Disclosure of interest statement – • Analyst interest of the stock /Instrument(s): - No. • Firm interest of the stock / Instrument (s): - No.
Disclaimer