1. 14th Oct’14 Aaj Ka Trend
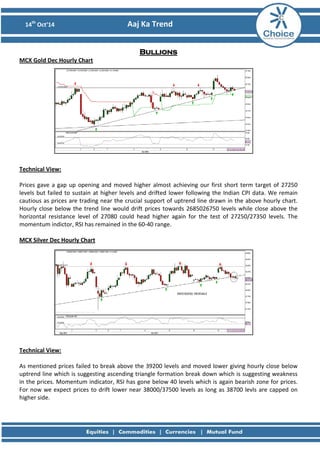
Bullions MCX Gold Dec Hourly Chart
Technical View: Prices gave a gap up opening and moved higher almost achieving our first short term target of 27250 levels but failed to sustain at higher levels and drifted lower following the Indian CPI data. We remain cautious as prices are trading near the crucial support of uptrend line drawn in the above hourly chart. Hourly close below the trend line would drift prices towards 2685026750 levels while close above the horizontal resistance level of 27080 could head higher again for the test of 27250/27350 levels. The momentum indictor, RSI has remained in the 60-40 range. MCX Silver Dec Hourly Chart
Technical View: As mentioned prices failed to break above the 39200 levels and moved lower giving hourly close below uptrend line which is suggesting ascending triangle formation break down which is suggesting weakness in the prices. Momentum indicator, RSI has gone below 40 levels which is again bearish zone for prices. For now we expect prices to drift lower near 38000/37500 levels as long as 38700 levls are capped on higher side.
2. 14th Oct’14 Aaj Ka Trend
Fundamental News:
• Gold futures rose to a four-week high on Monday, as concerns over the global economic outlook boosted demand for safe haven assets.
• On the Comex division of the New York Mercantile Exchange, gold for December delivery hit a session high of $1,238.00 a troy ounce, a level not seen since September 17
• Gold hits 4-week peak as global growth woes boost haven demand.
Pivot Levels for the Day:
S1
S2
S3
Pivot
R1
R2
R3
Gold
26859
26747
26441
27053
27165
27359
27665
Silver
38064
37793
37034
38552
38823
39311
40070
Recommendation:
Gold
Sell
Silver
Sell
3. 14th Oct’14 Aaj Ka Trend
Base Metals MCX Copper Nov Hourly Chart
Technical Views: Prices gave gap down opening but traded in the narrow range of 414-411 levels. Outlook remains bullish as prices have formed Doji candlestick on daily timeframe near 61.8% retracement level of the previously mentioned rally. Break above 3.059$ on COMEX copper would add strength in prices which would take prices towards 3.080$ levels. MCX Copper can test 416/418 levels.
MCX Aluminum Oct Hourly Chart
MCX Lead Oct Hourly Chart
MCX Nickel Oct Hourly Chart
MCX Zinc Oct Hourly Chart
4. 14th Oct’14 Aaj Ka Trend
Fundamental News:
• Copper fluctuates as China trade data fails to ease concerns.
• Copper futures swung between small gains and losses during European morning trade, as upbeat China trade data failed to ease concerns over the global economic outlook.
• On the Comex division of the New York Mercantile Exchange, copper for December delivery traded at $3.037 a pound during European morning hours, up 0.2 cents, or 0.08%.
Pivot Levels for the Day:
S1
S2
S3
Pivot
R1
R2
R3
Copper
411.7
410.1
407.1
413.1
414.7
416.1
419.1
Aluminum
117.1
116.6
115.6
117.5
118.1
118.5
119.4
Lead
125.4
124.8
123.0
126.6
127.2
128.4
130.2
Nickel
999.9
994.7
981.1
1008.3
1013.5
1021.9
1035.5
Zinc
141.6
141.1
140.1
142.1
142.6
143.1
144.1
Recommendation:
Copper
Neutral
Aluminum
Sell
Lead
Sell
Nickel
Neutral
Zinc
Sell
5. 14th Oct’14 Aaj Ka Trend
Energy MCX Crude Oct Hourly Chart:
Technical Views: Prices gave gap down opening against our bullish view. However bias remains the same as long as prices are trading above the previous bottom of 5140 levels. The momentum indicator, RSI has also taken support near 40 levels. We expect prices should test 5300/5350 levels as long as 514 levels are protected on downside. MCX Natural Gas Oct Hourly Chart:
Technical Views: Natural gas prices would remain the range of 239-234 levels. Breach of either side would confirm the direction. Outlook remains negative with negative bias. The momentum indicator, RSI has taken resistance near 60 levels. ichimoku cloud has also signaled sell which would add bearishness to the prices. However, confirmation would come on breach of either side.
6. 14th Oct’14 Aaj Ka Trend
Fundamental News:
• Natural gas futures edge higher in holiday trade.
• U.S. natural gas futures edged higher during U.S. morning trade on Monday, as market players monitored near-term weather forecasts to gauge the strength of demand for the fuel.
• Crude oil futures tumble on Saudi price signals.
• Crude oil futures tumbled on Monday, as indications Saudi Arabia is comfortable with lower oil prices weighed.
Pivot Levels for the Day:
S1
S2
S3
Pivot
R1
R2
R3
Crude
5154
5089
4962
5216
5281
5343
5470
Natural Gas
232.4
231.6
227.7
235.5
236.3
239.4
243.3
Recommendation:
Crude
Buy
Natural Gas
Neutral
8. 14th Oct’14 Aaj Ka Trend
This is solely for information of clients of Choice India and does not construe to be an investment advice. It is also not intended as an offer or solicitation for the purchase and sale of any financial instruments. Any action taken by you on the basis of the information contained herein is your responsibility alone and Choice India its subsidiaries or its employees or associates will not be liable in any manner for the consequences of such action taken by you. We have exercised due diligence in checking the correctness and authenticity of the information contained in this recommendation, but Choice India or any of its subsidiaries or associates or employees shall not be in any way responsible for any loss or damage that may arise to any person from any inadvertent error in the information contained in this recommendation or any action taken on basis of this information. Technical analysis studies market psychology, price patterns and volume levels. It is used to forecast future price and market movements. Technical analysis is complementary to fundamental analysis and news sources. The recommendations issued herewith might be contrary to recommendations issued by Choice India in the company research undertaken as the recommendations stated in this report is derived purely from technical analysis. Choice India has based this document on information obtained from sources it believes to be reliable but which it has not independently verified; Choice India makes no guarantee, representation or warranty and accepts no responsibility or liability as to its accuracy or completeness. The opinions contained within the report are based upon publicly available information at the time of publication and are subject to change without notice. The information and any disclosures provided herein are in summary form and have been prepared for informational purposes. The recommendations and suggested price levels are intended purely for trading purposes. The recommendations are valid for the day of the report however trading trends and volumes might vary substantially on an intraday basis and the recommendations may be subject to change. The information and any disclosures provided herein may be considered confidential. Any use, distribution, modification, copying, forwarding or disclosure by any person is strictly prohibited. The information and any disclosures provided herein do not constitute a solicitation or offer to purchase or sell any security or other financial product or instrument. The current performance may be unaudited. Past performance does not guarantee future returns. There can be no assurance that investments will achieve any targeted rates of return, and there is no guarantee against the loss of your entire investment. POTENTIAL CONFLICT OF INTEREST DISCLOSURE (as on date of report) Disclosure of interest statement – • Analyst interest of the stock /Instrument(s): - No. • Firm interest of the stock / Instrument (s): - No.
Disclaimer