Equity bazaar 14.10.14
•
0 likes•65 views

The document provides a technical analysis of the Nifty, Bank Nifty, and Glenmark stock indexes and shares from October 14th, 2014. It notes that the Nifty opened with a gap down but recovered and closed higher, forming large real body green candles. It is analyzing support and resistance levels. For Bank Nifty, it examines moving averages and Fibonacci retracement levels. For Glenmark, it discusses a symmetrical triangle breakout. Recommendations are given to buy or sell depending on price movements and levels.

Recommended
More Related Content
What's hot
What's hot (20)
Viewers also liked
Viewers also liked (15)
Similar to Equity bazaar 14.10.14
Similar to Equity bazaar 14.10.14 (20)
Equity bazaar 14.10.14
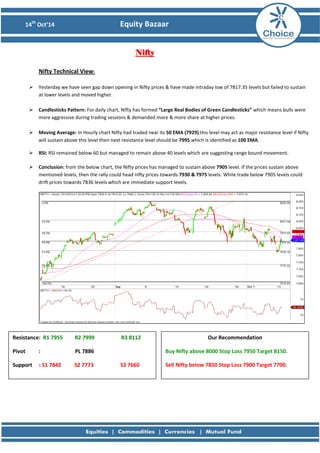
- 1. 14th Oct’14 Equity Bazaar Nifty Nifty Technical View: Yesterday we have seen gap down opening in Nifty prices & have made intraday low of 7817.35 levels but failed to sustain at lower levels and moved higher. Candlesticks Pattern: For daily chart, Nifty has formed “Large Real Bodies of Green Candlesticks” which means bulls were more aggressive during trading sessions & demanded more & more share at higher prices. Moving Average: In Hourly chart Nifty had traded near its 50 EMA (7929) this level may act as major resistance level if Nifty will sustain above this level then next resistance level should be 7995 which is identified as 100 EMA. RSI: RSI remained below 60 but managed to remain above 40 levels which are suggesting range bound movement. Conclusion: from the below chart, the Nifty prices has managed to sustain above 7905 level. If the prices sustain above mentioned levels, then the rally could head nifty prices towards 7930 & 7975 levels. While trade below 7905 levels could drift prices towards 7836 levels which are immediate support levels. Resistance: R1 7955 R2 7999 R3 8112 Pivot : PL 7886 Support : S1 7842 S2 7773 S3 7660 Our Recommendation Buy Nifty above 8000 Stop Loss 7950 Target 8150. Sell Nifty below 7850 Stop Loss 7900 Target 7700.
- 2. 14th Oct’14 Equity Bazaar Bank Nifty Bank Nifty Technical View: Yesterday, Bank Nifty prices have given gap down opening & we have observed pullback from its lower levels. Now Bank Nifty has crucial resistance of 15800 levels. Above which prices could rally more 300 points. Moving Average: Below chart suggest, The Bank Nifty prices are trading above the 50 EMA (15420) & 100 EMA (15544) level which is positive for the prices to test higher levels. Fibonacci Analysis: in the previous session, Bank Nifty has tested 61.8% of the Retracement levels of previous downward move. RSI: RSI has managed to cross 60 levels. However, sustaining the 60 levels would give positive confirmation for prices. Conclusion: Below chart suggest that prices could move higher once it breaches the previous session’s high for the upside targets of 16000 levels which is also the 78.6% retracement level of the previous down move. Resistance: R1 15851 R2 16002 R3 16406 Pivot : PL 15598 Support : S1 15447 S2 15194 S3 14790 Our Recommendation Buy BNF above 15600 Stop Loss 15500 Target: 15800. Sell BNF below 15000 Stop Loss 15600 Target: 15200.
- 3. 14th Oct’14 Equity Bazaar Stock of the Day Glenmark View: After short term consolidation Glenmark has given downtrend line breakout & sustained above its upper range of symmetric triangle formation. Chart Pattern: On hourly chart, Prices have given close above the upper band of the symmetric triangle formation. Triangle is the continuation pattern and the previous trend was up so we expect prices could move higher as long as triangle trend lines are intact. Moving Average: On Hourly chart, Prices have given close above the 50 & 100 SMA which would give positive confirmation for prices to trade higher. Conclusion: The below charts suggest that Glenmark has given triangle breakout. For now upper band could act as new support & upward rally may continue till 750 levels, retest of the triangle can be used as buying opportunity. For short term there could be the possibility of upward rally which would test 750/775 levels. Resistance: R1 736 R2 749 R3 780 Pivot : PL 718 Support : S1 705 S2 687 S3 656 Our Recommendation Buy Glenmark above 735 Stop Loss 725 Target: 750
- 4. 14th Oct’14 Equity Bazaar Derivative Analysis FIIS Data: FII’s are net Rs 671.06 Cr short on 13th October 2014 and Dll’s are the net Rs 566.83 Cr buyer on 13th October 2014. Option Data: 8200 CE has the highest OI with 60.22 lakhs and 8100 CE has the second highest OI with 53 lakhs and 7800 PE has the highest OI with 67 lakhs and 7700 PE has the second highest OI with 57 lakhs. Open Interest: The above options data shows that nifty has strong support at 7800 and has resistance at 8200. The change in level will take place once when NIFTY prices breaks 8000 mark. Intraday Option Strategy: (A) Buy Nifty 7900 calls and Sell Nifty 8000 puts if buy level is breached. (B) Sell Nifty 7800 calls and Buy Nifty 7900 puts if sell level is breached.
- 5. 14th Oct’14 Equity Bazaar SymbolS3S2S1PR1R2R3TrendActionACC 1335.321360.721373.831386.121399.231411.521436.92UPBuyAMBUJACEM 199.97204.62206.73209.2667211.38213.92218.57DownSellASIANPAINT 624.55640.55648.1656.55664.1672.55688.55DownSellAXISBANK 350.97366.97376.93382.9667392.93398.97414.97UPBuyBAJAJ-AUTO 2278.32313.12330.952347.92365.752382.72417.5UPBuyBANKBARODA 819.75841.05853.2862.35874.5883.65904.95UPBuyBHEL 209.5214.1216.15218.7220.75223.3227.9SidewayNo ActionBPCL 641.67656.62664.18671.5667679.13686.52701.47UPBuyBHARTIARTL 361.27374.82383.18388.3667396.73401.92415.47UPBuyCAIRN 264.2275.35282.6286.5293.75297.65308.8UPBuyCIPLA 547.37563.92569.93580.4667586.48597.02613.57DownSellCOALINDIA 315.08326.73333.77338.3833345.42350.03361.68UPBuyDLF 132.28139.93143.42147.5833151.07155.23162.88DownSellDRREDDY 2811.052881.052912.12951.052982.13021.053091.05DownSellGAIL 427.95435.1439.55442.25446.7449.4456.55UPBuyGRASIM 3319.433369.583394.223419.7333444.373469.883520.03DownSellHCLTECH 1655.021701.771728.781748.5171775.531795.271842.02UPBuyHDFCBANK 825.45847.8862.3870.15884.65892.5914.85UPBuyHEROMOTOCO 2717.272789.922832.382862.5672905.032935.223007.87UPBuyHINDALCO 140.97145.57148.33150.1667152.93154.77159.37UPBuyHINDUNILVR 698.6709.2714.8719.8725.4730.4741UPBuyHDFC 959.32986.071001.931012.8171028.681039.571066.32UPBuyITC 338.82344.52347.53350.2167353.23355.92361.62SidewayNo ActionICICIBANK 1376.331420.831449.371465.3331493.871509.831554.33UPBuyIDFC 134.45137.05138.6139.65141.2142.25144.85UPBuyINDUSINDBK 587.65611.65623.3635.65647.3659.65683.65SidewayNo ActionINFY 3747.553843.253892.93938.953988.64034.654130.35UPBuyJINDALSTEL 140.47149.22154.13157.9667162.88166.72175.47UPBuyKOTAKBANK 954.4978.8993.651003.21018.051027.61052UPBuyLT 1402.621423.471434.631444.3171455.481465.171486.02UPBuyLUPIN 1240.621288.821308.031337.0171356.231385.221433.42DownSellM&M 1170.381226.781247.871283.1831304.271339.581395.98DownSellMARUTI 2849.42904.352938.62959.32993.553014.253069.2UPBuyNMDC 140.93147.33151.47153.7333157.87160.13166.53UPBuyNTPC 134.07137.02138.63139.9667141.58142.92145.87SidewayNo ActionONGC 383.07393.72400.23404.3667410.88415.02425.67UPBuyPOWERGRID 131.65133.45134.15135.25135.95137.05138.85DownSellPNB 840.43875.43897.87910.4333932.87945.43980.43UPBuyRELIANCE 923.5940.2949.05956.9965.75973.6990.3SidewayNo ActionSSLT 234.9241.75245.8248.6252.65255.45262.3UPBuySBIN 2343.952407.152446.32470.352509.52533.552596.75UPBuySUNPHARMA 754.05782.2793.05810.35821.2838.5866.65DownSellTCS 2594.182648.982682.772703.7832737.572758.582813.38UPBuyTATAMOTORS 455.2473.35484.8491.5502.95509.65527.8UPBuyTATAPOWER 76.6880.3882.7784.0833386.4787.7891.48UPBuyTATASTEEL 413.27432.92445.33452.5667464.98472.22491.87UPBuyTECHM 2244.332302.132335.072359.9332392.872417.732475.53UPBuyULTRACEMCO 2369.632422.632452.272475.6332505.272528.632581.63UPBuyWIPRO 539.08558.98571.77578.8833591.67598.78618.68UPBuyZEEL 303.07309.17312.43315.2667318.53321.37327.47UPBuy
- 6. 14th Oct’14 Equity Bazaar Amit Pawar (Research Associate) amit.pawar@choiceindia.com Rohan Shinde (Research Associate) rohan.shinde@choiceindia.com Deveya Gaglani (Research Advisor) deveya.gaglani@chocieindia.com For Private Circulation Only Website: www.choiceindia.com https://twitter.com/ChoiceBroking https://www.youtube.com/user/ChoiceBroking http://www.slideshare.net/choiceindiabroking https://plus.google.com/115293033595831069270/posts https://www.facebook.com/pages/Choice-Equity-Broking-Pvt-Ltd/352491718249644 https://www.linkedin.com/company/choice-international-limited?trk=parent_company_logo
- 7. 14th Oct’14 Equity Bazaar Disclaimer This is solely for information of clients of Choice India and does not construe to be an investment advice. It is also not intended as an offer or solicitation for the purchase and sale of any financial instruments. Any action taken by you on the basis of the information contained herein is your responsibility alone and Choice India its subsidiaries or its employees or associates will not be liable in any manner for the consequences of such action taken by you. We have exercised due diligence in checking the correctness and authenticity of the information contained in this recommendation, but Choice India or any of its subsidiaries or associates or employees shall not be in any way responsible for any loss or damage that may arise to any person from any inadvertent error in the information contained in this recommendation or any action taken on basis of this information. Technical analysis studies market psychology, price patterns and volume levels. It is used to forecast future price and market movements. Technical analysis is complementary to fundamental analysis and news sources. The recommendations issued herewith might be contrary to recommendations issued by Choice India in the company research undertaken as the recommendations stated in this report is derived purely from technical analysis. Choice India has based this document on information obtained from sources it believes to be reliable but which it has not independently verified; Choice India makes no guarantee, representation or warranty and accepts no responsibility or liability as to its accuracy or completeness. The opinions contained within the report are based upon publicly available information at the time of publication and are subject to change without notice. The information and any disclosures provided herein are in summary form and have been prepared for informational purposes. The recommendations and suggested price levels are intended purely for trading purposes. The recommendations are valid for the day of the report however trading trends and volumes might vary substantially on an intraday basis and the recommendations may be subject to change. The information and any disclosures provided herein may be considered confidential. Any use, distribution, modification, copying, forwarding or disclosure by any person is strictly prohibited. The information and any disclosures provided herein do not constitute a solicitation or offer to purchase or sell any security or other financial product or instrument. The current performance may be unaudited. Past performance does not guarantee future returns. There can be no assurance that investments will achieve any targeted rates of return, and there is no guarantee against the loss of your entire investment. POTENTIAL CONFLICT OF INTEREST DISCLOSURE (as on date of report) Disclosure of interest statement – • Analyst interest of the stock /Instrument(s): - No. • Firm interest of the stock / Instrument (s): - No.