Downloaded 177 times
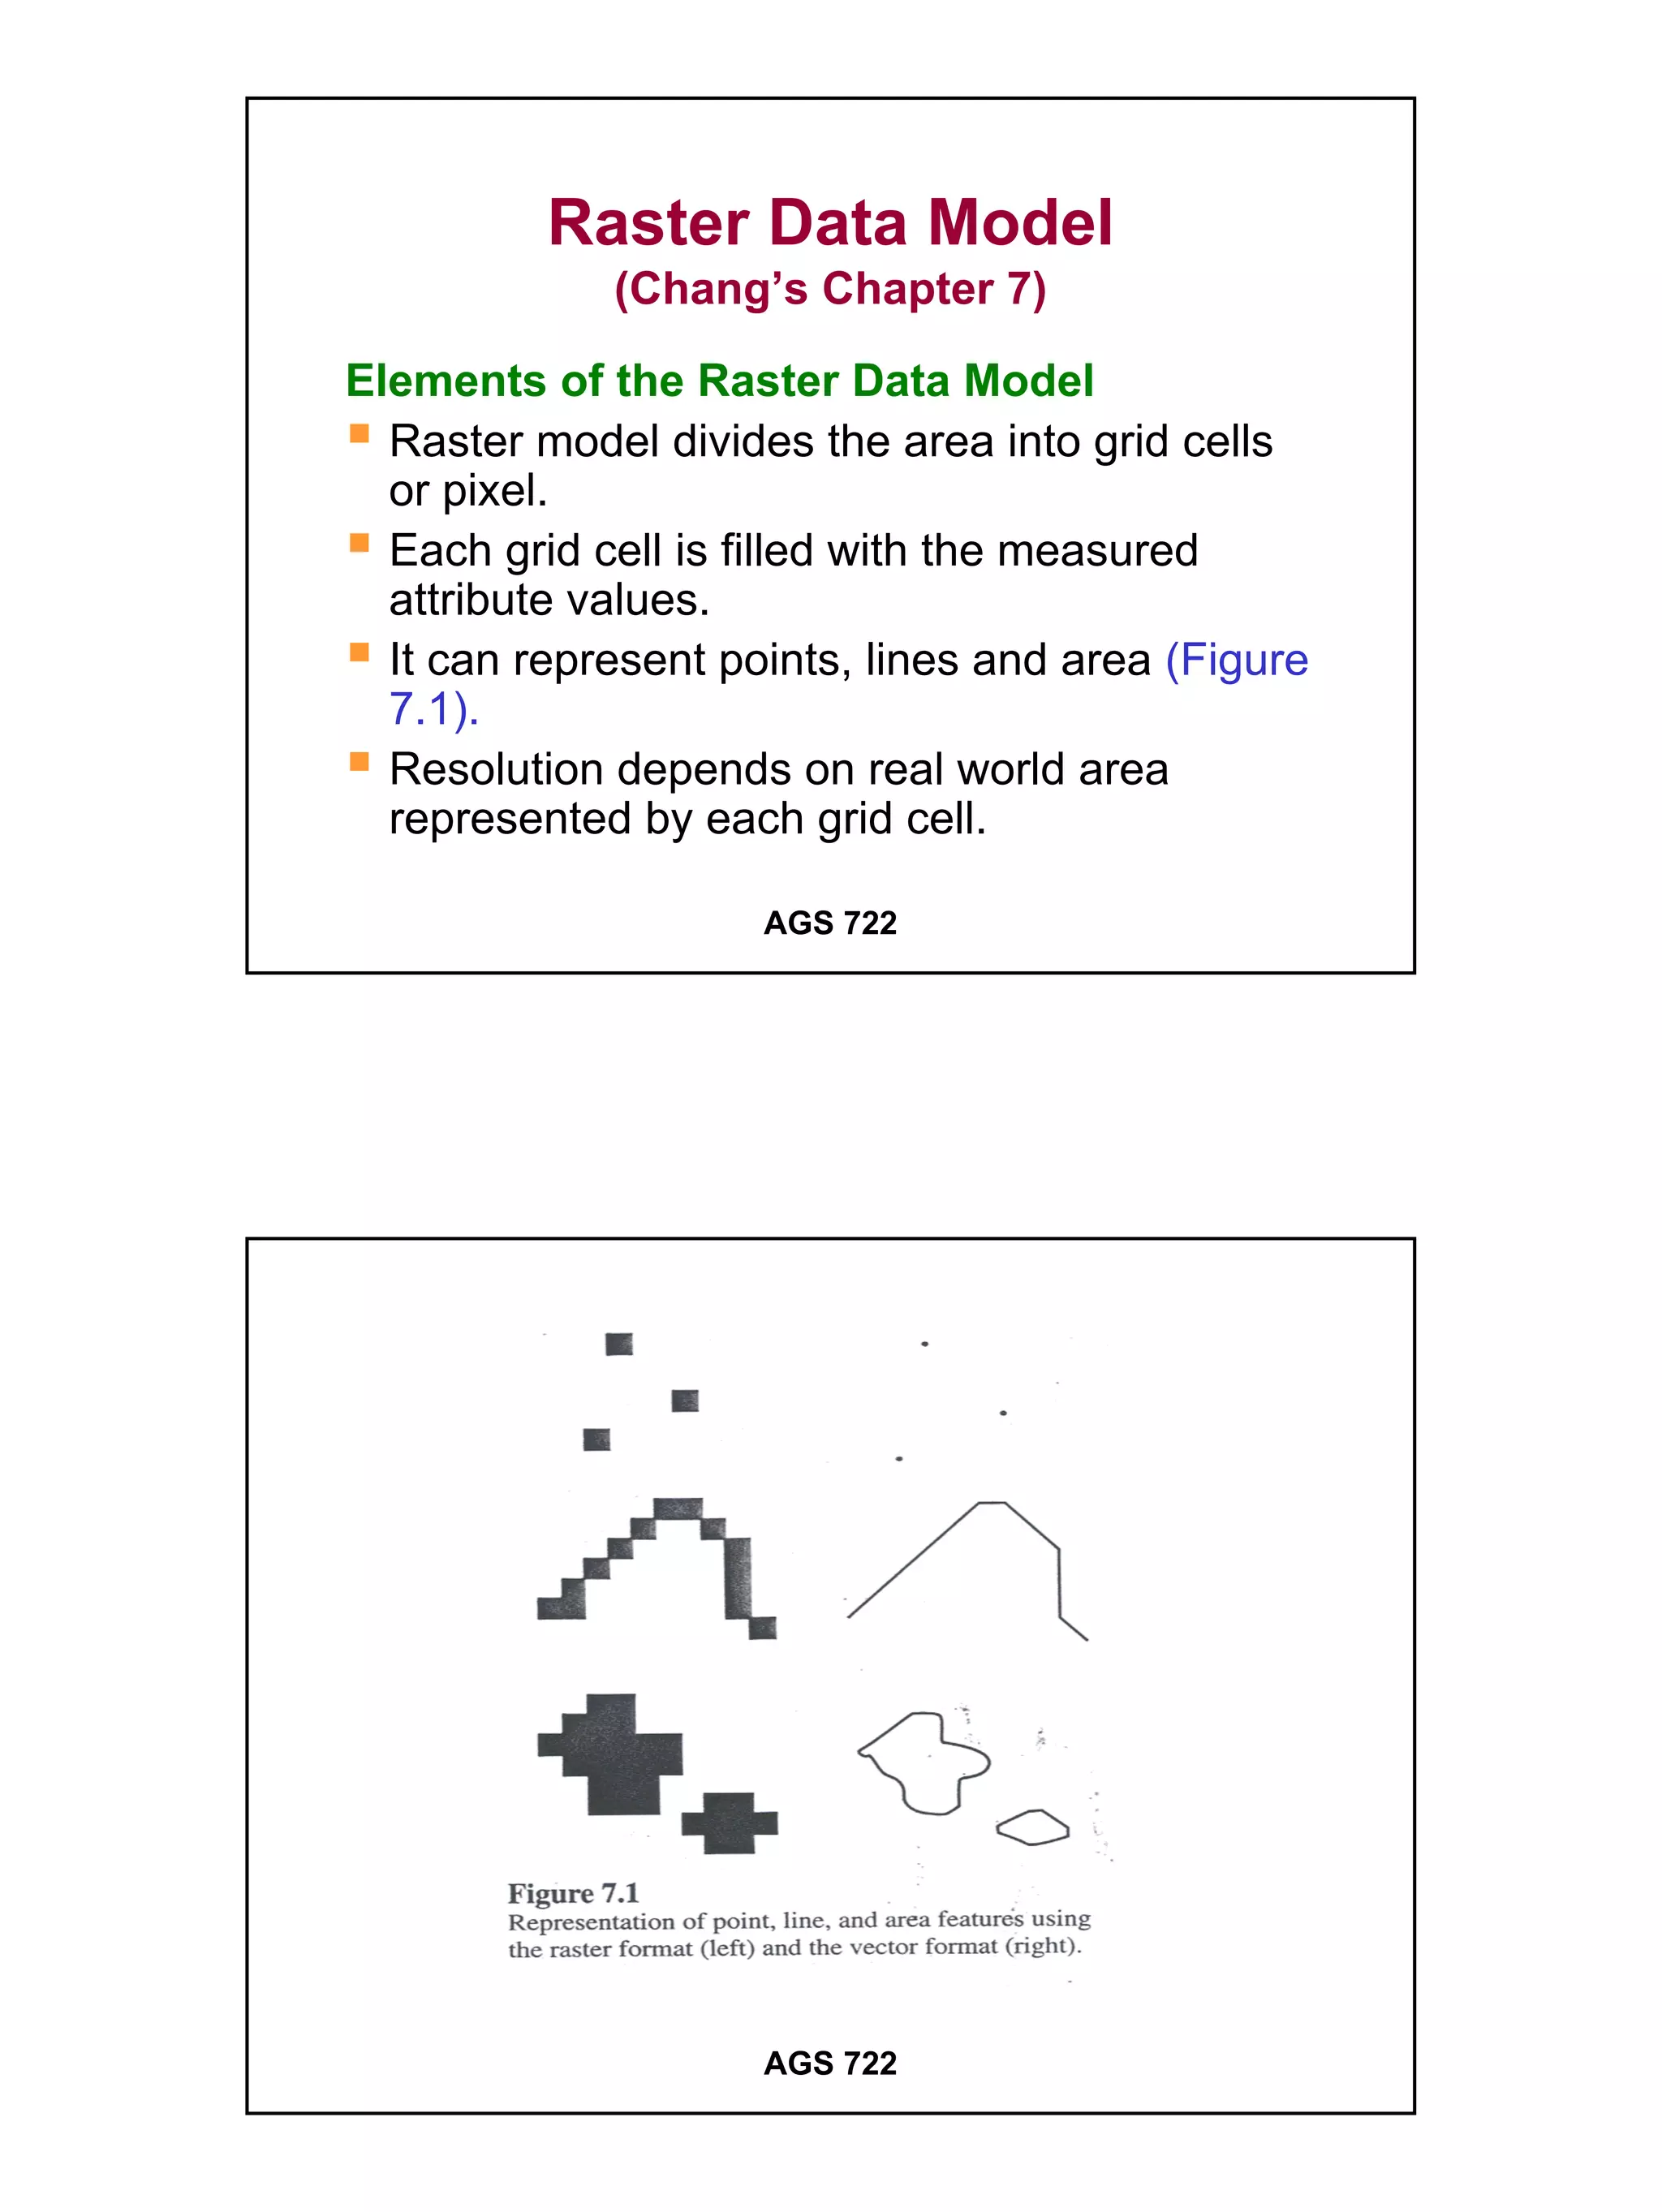
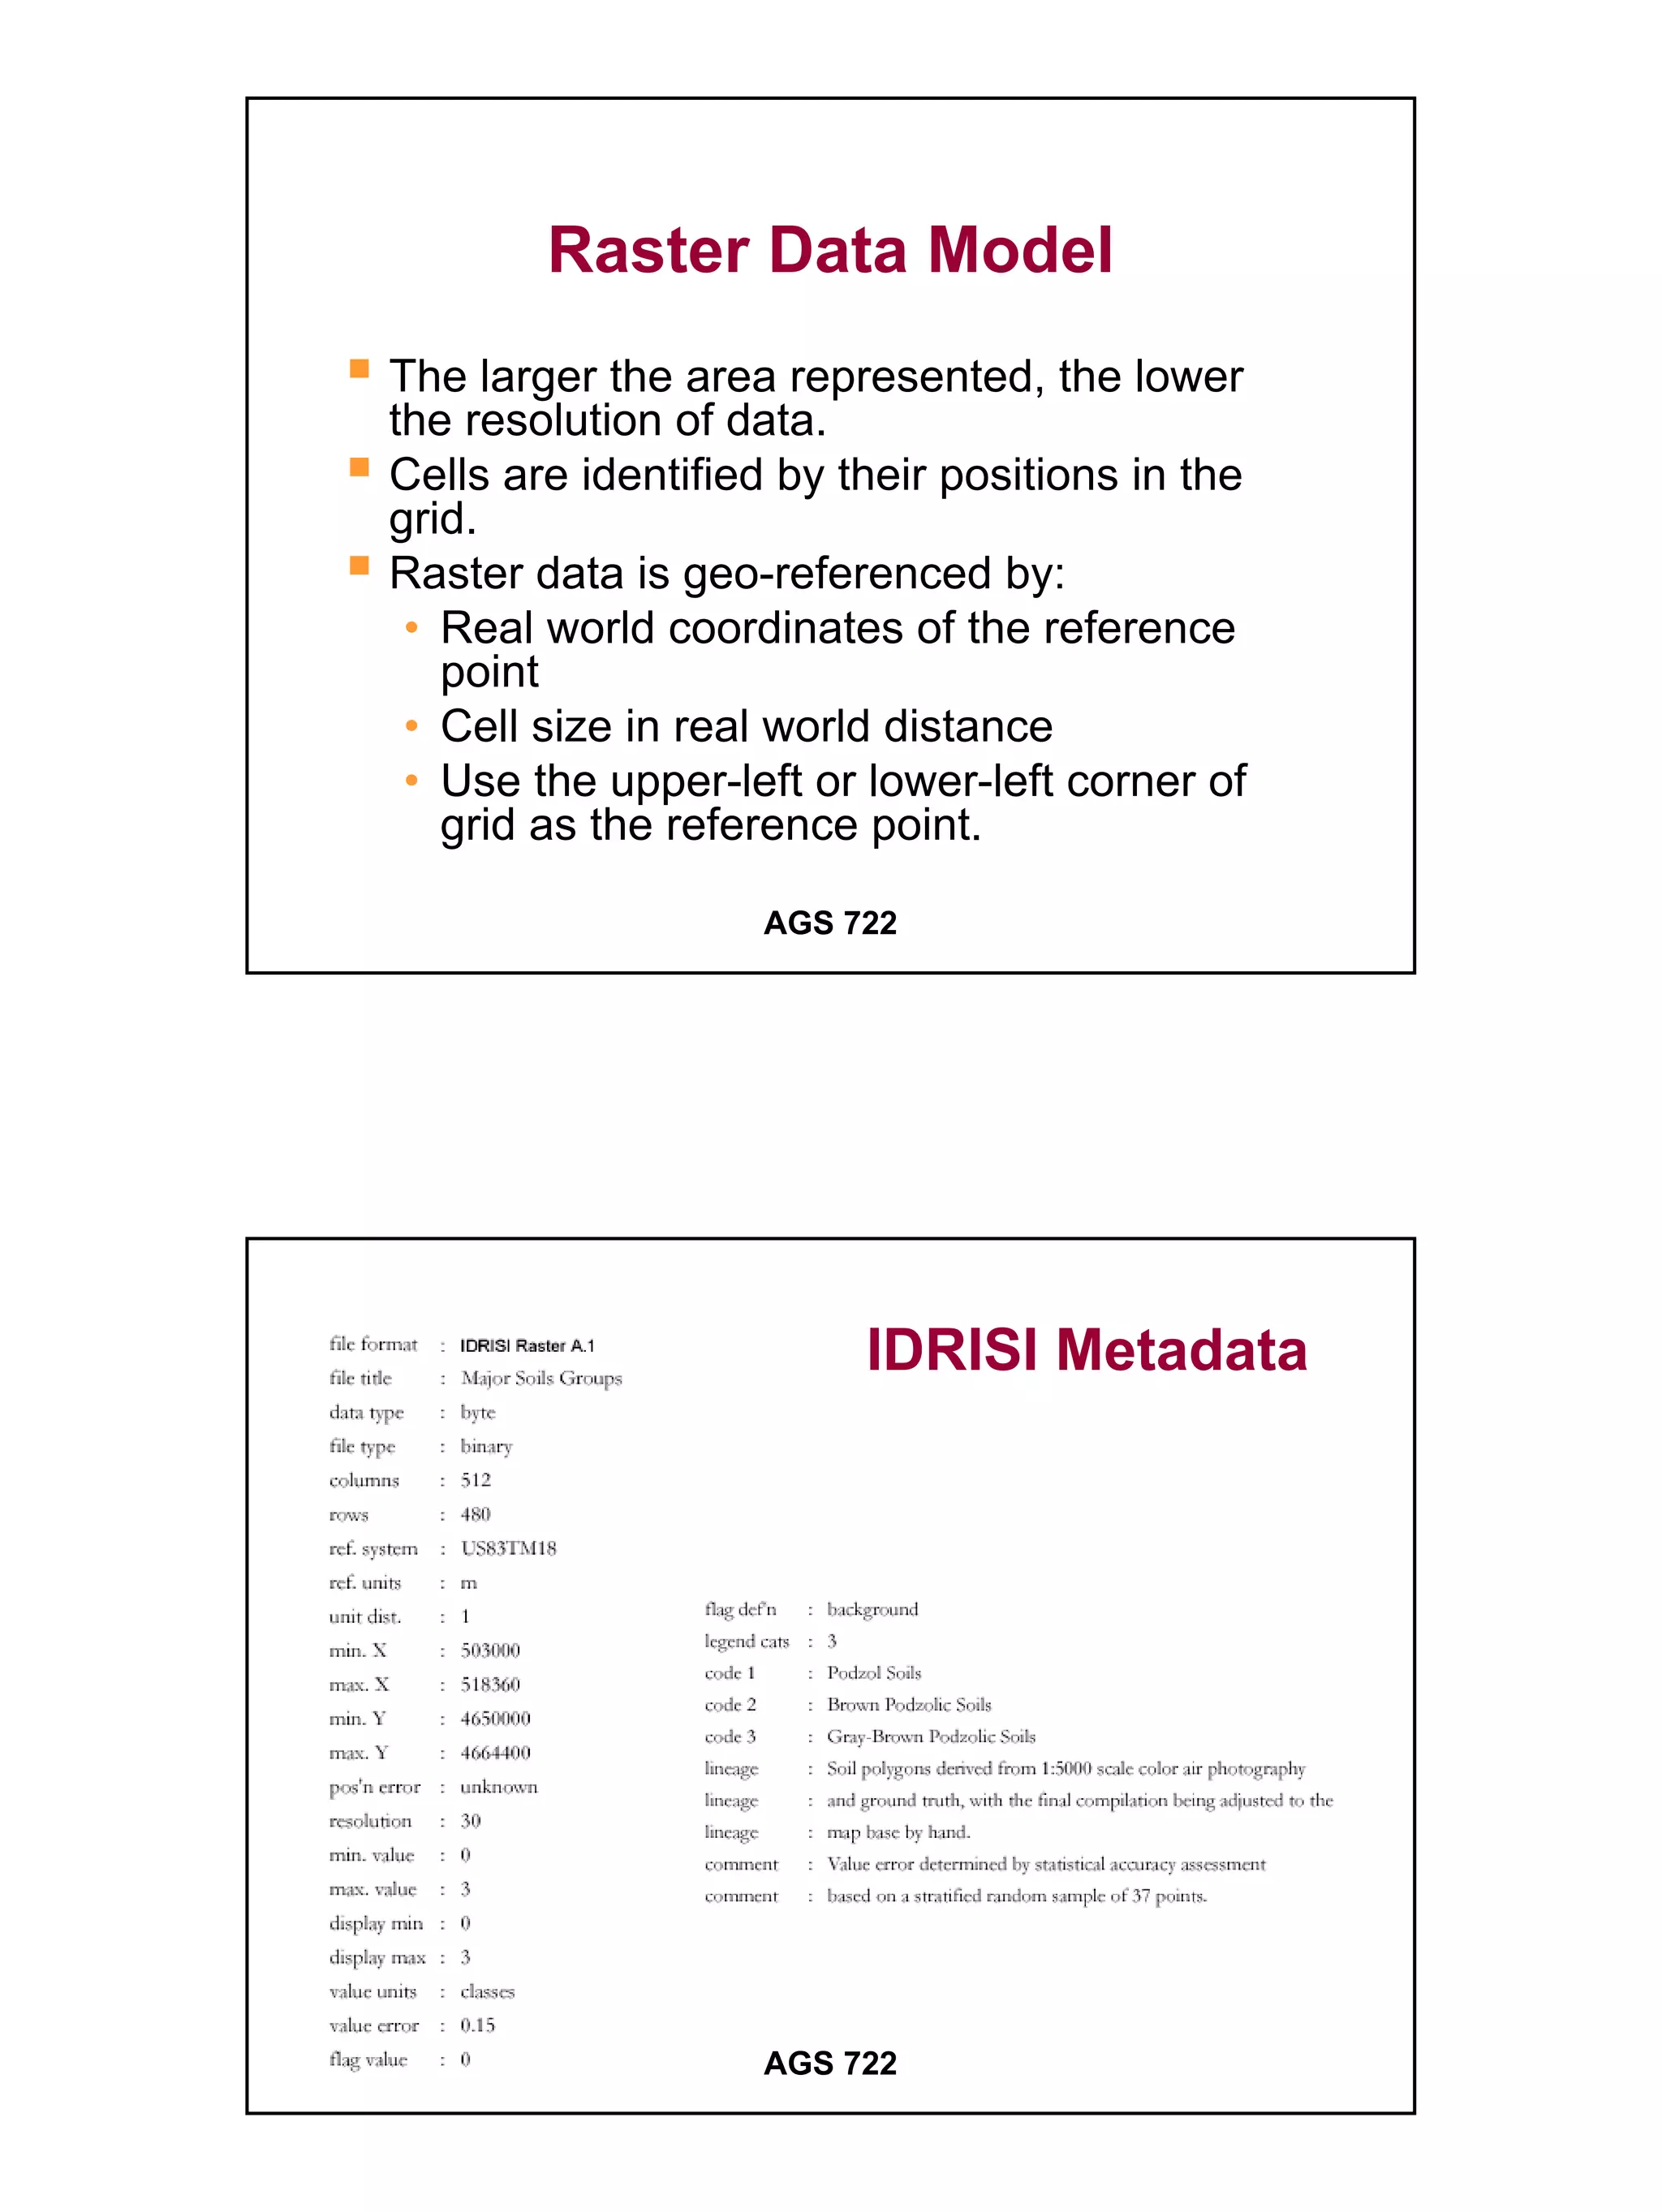
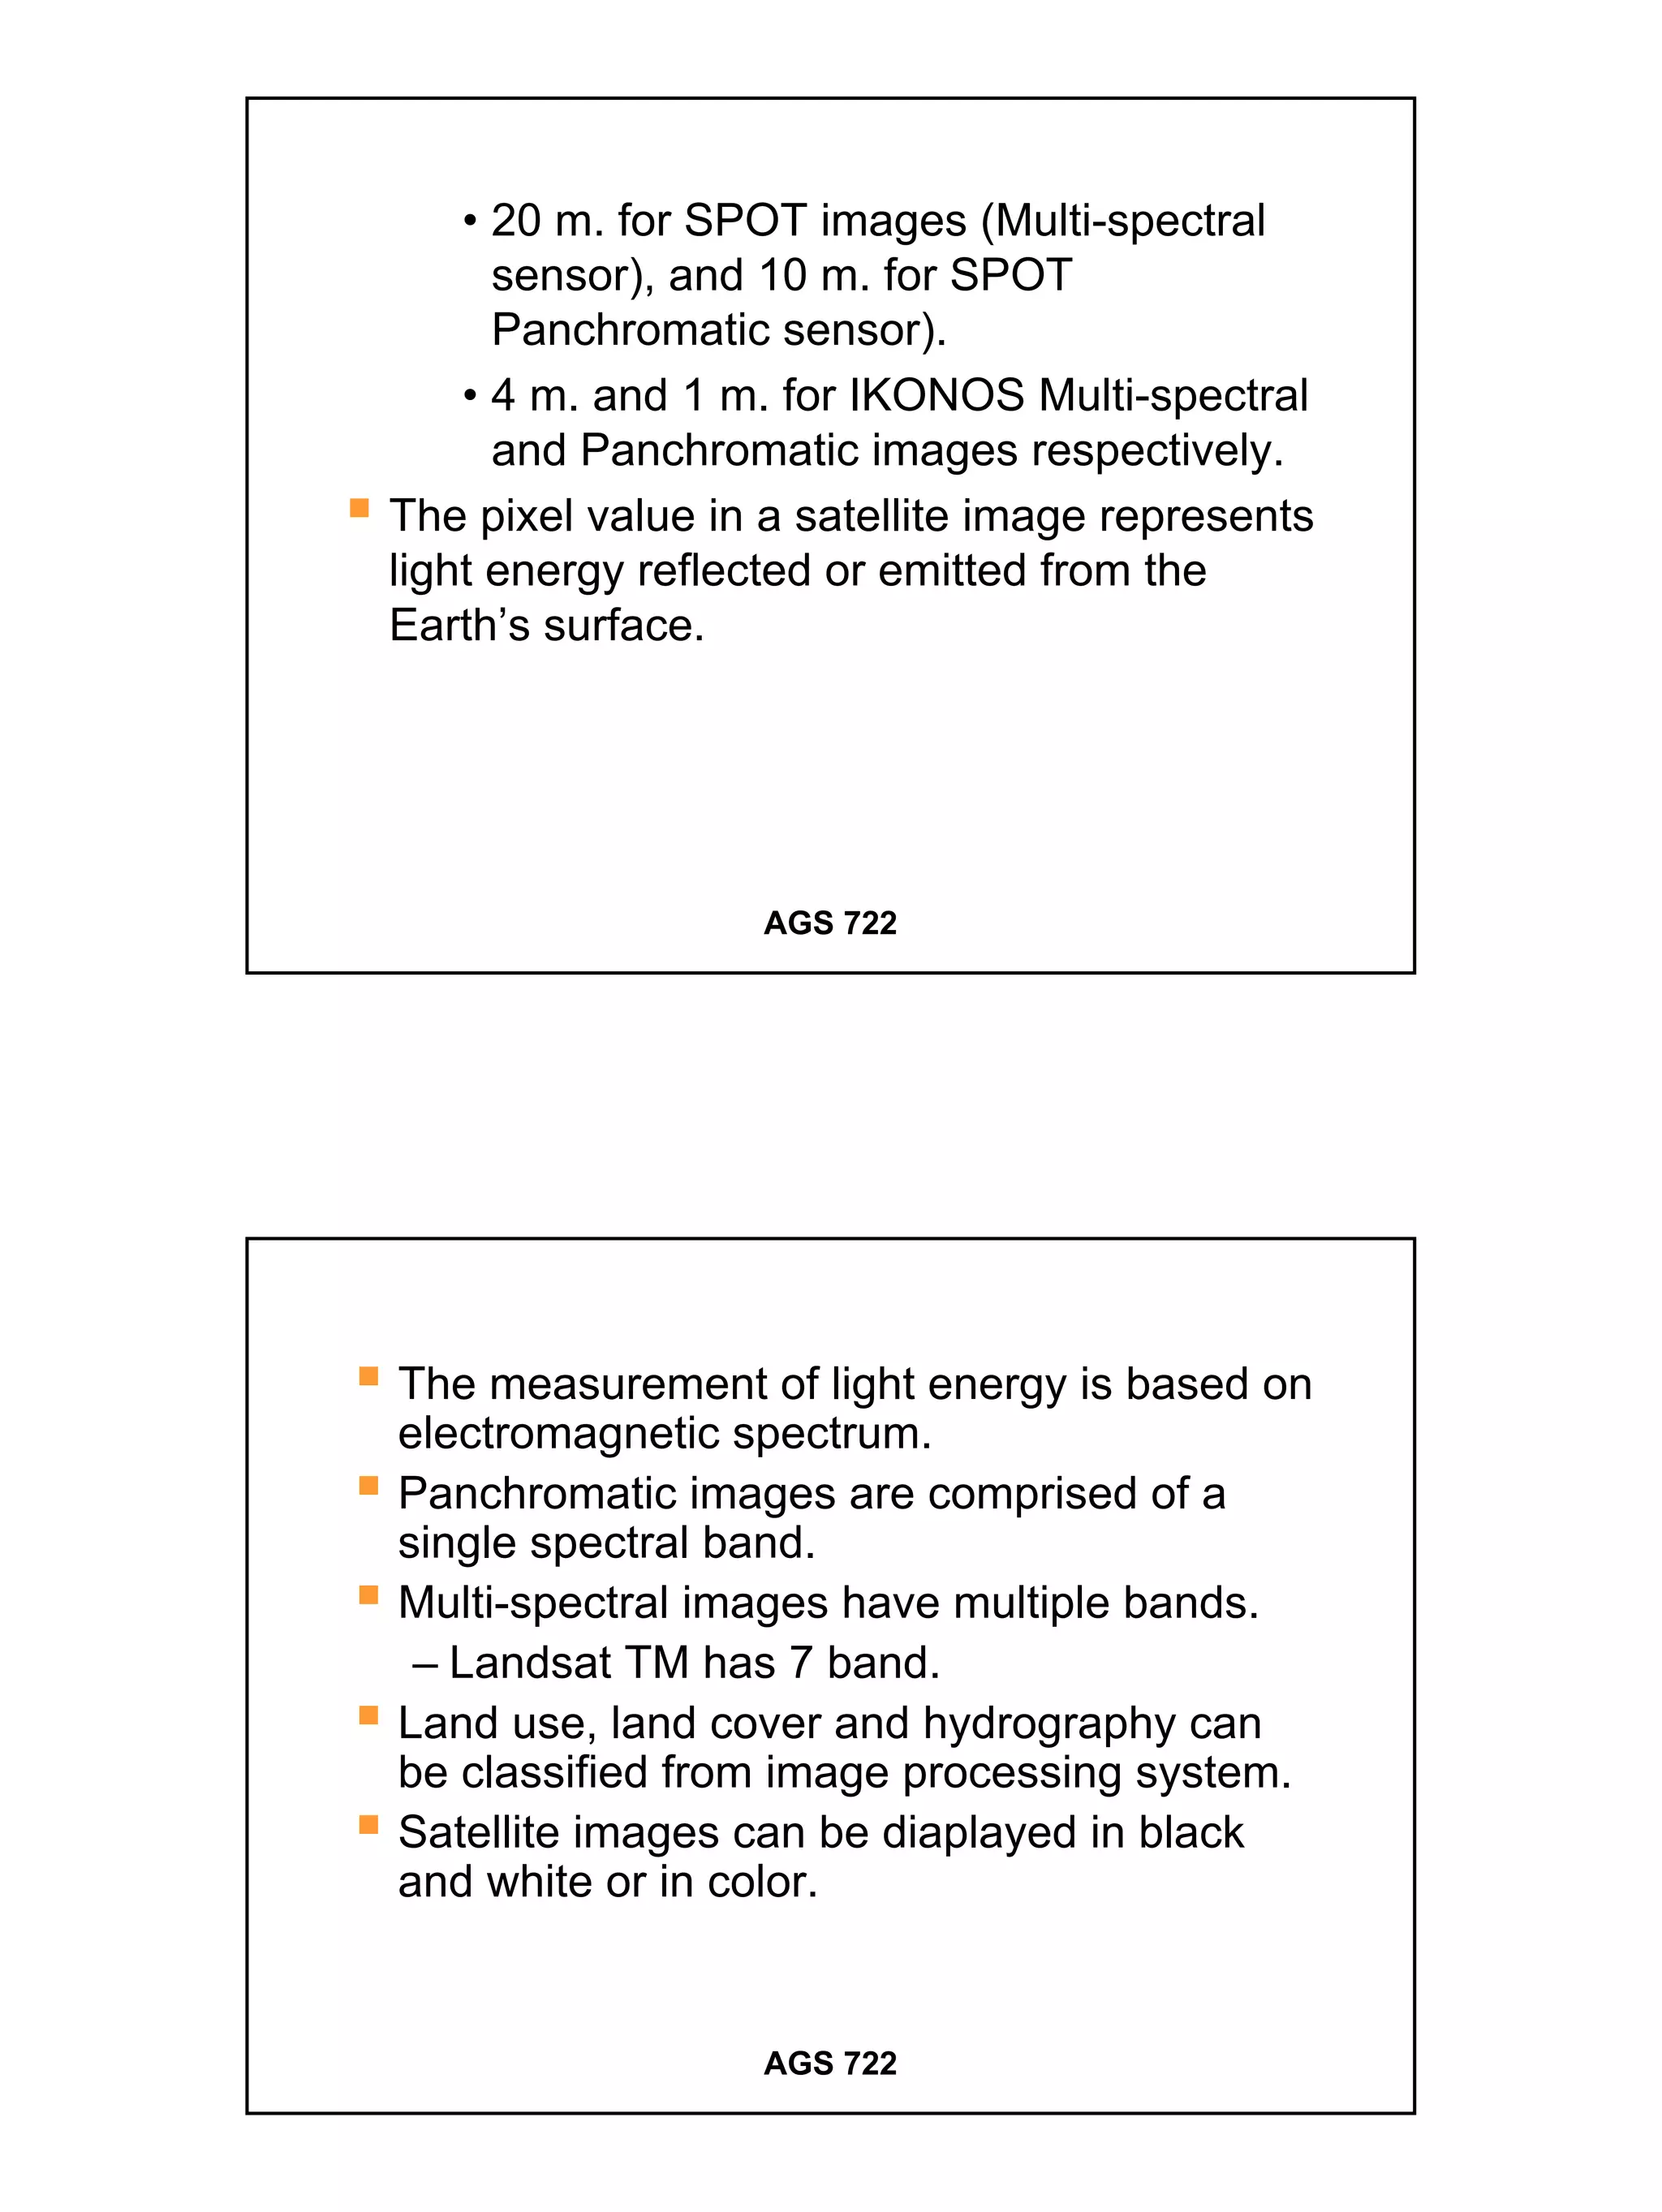
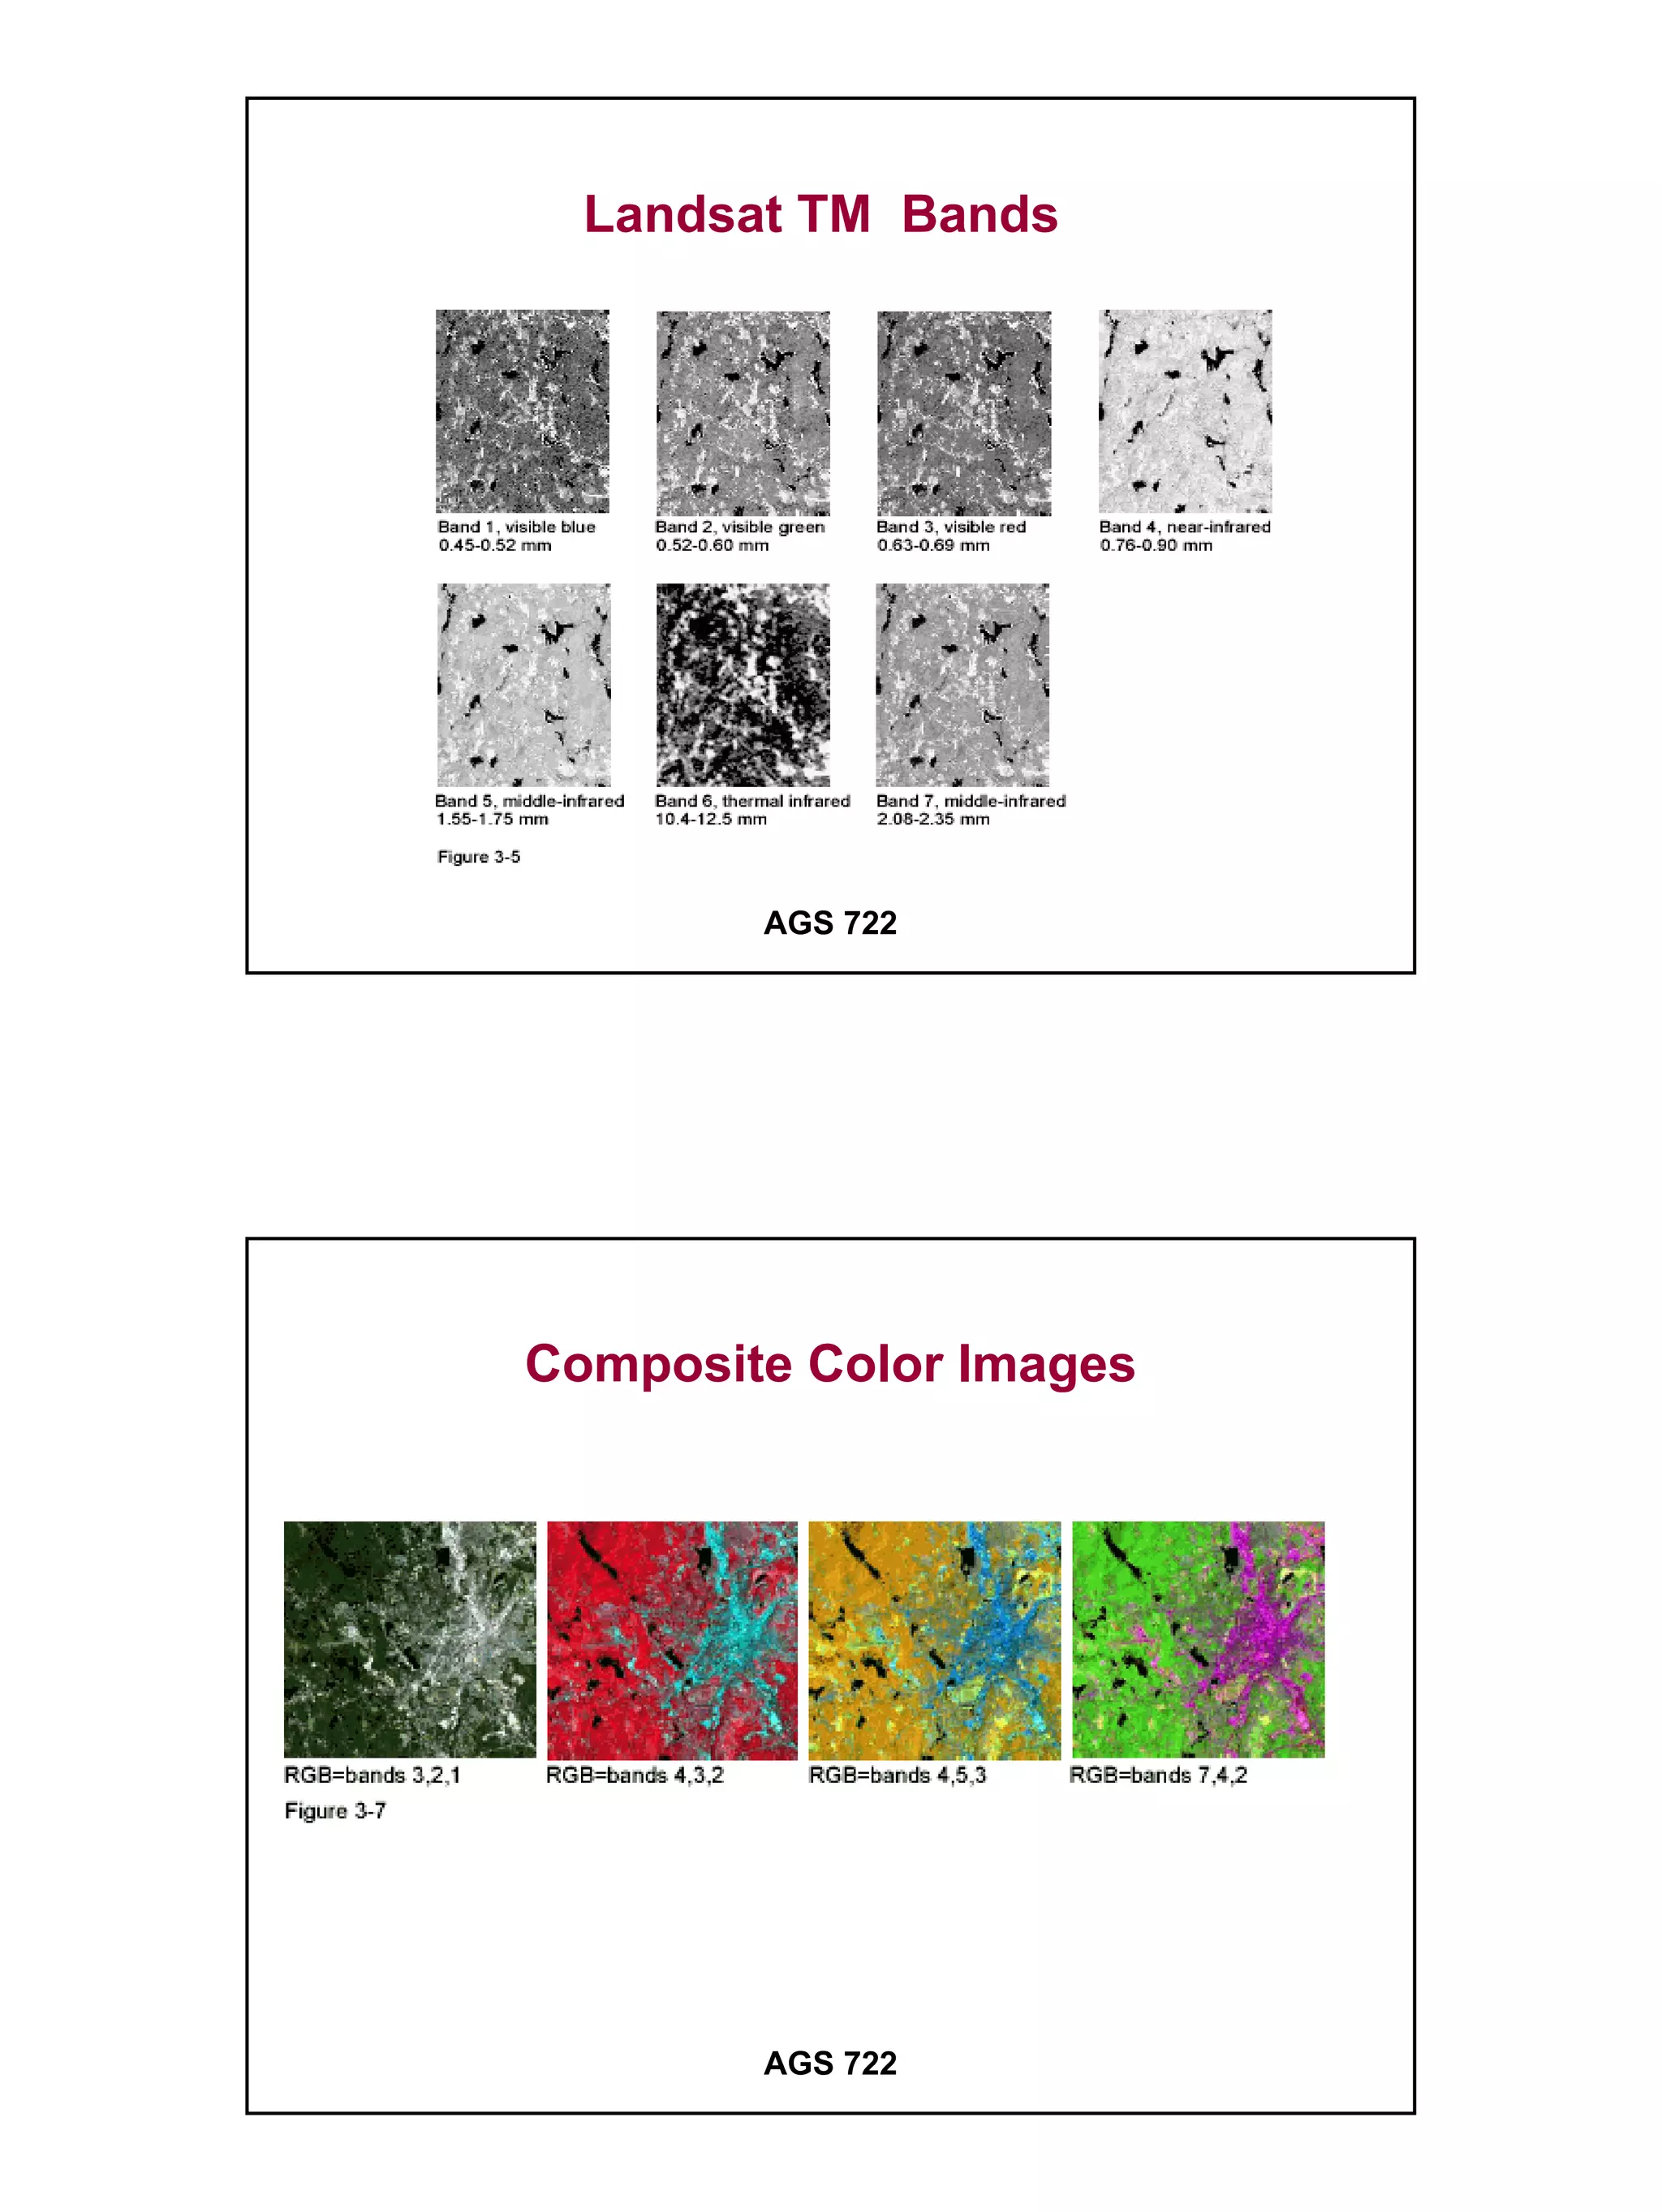
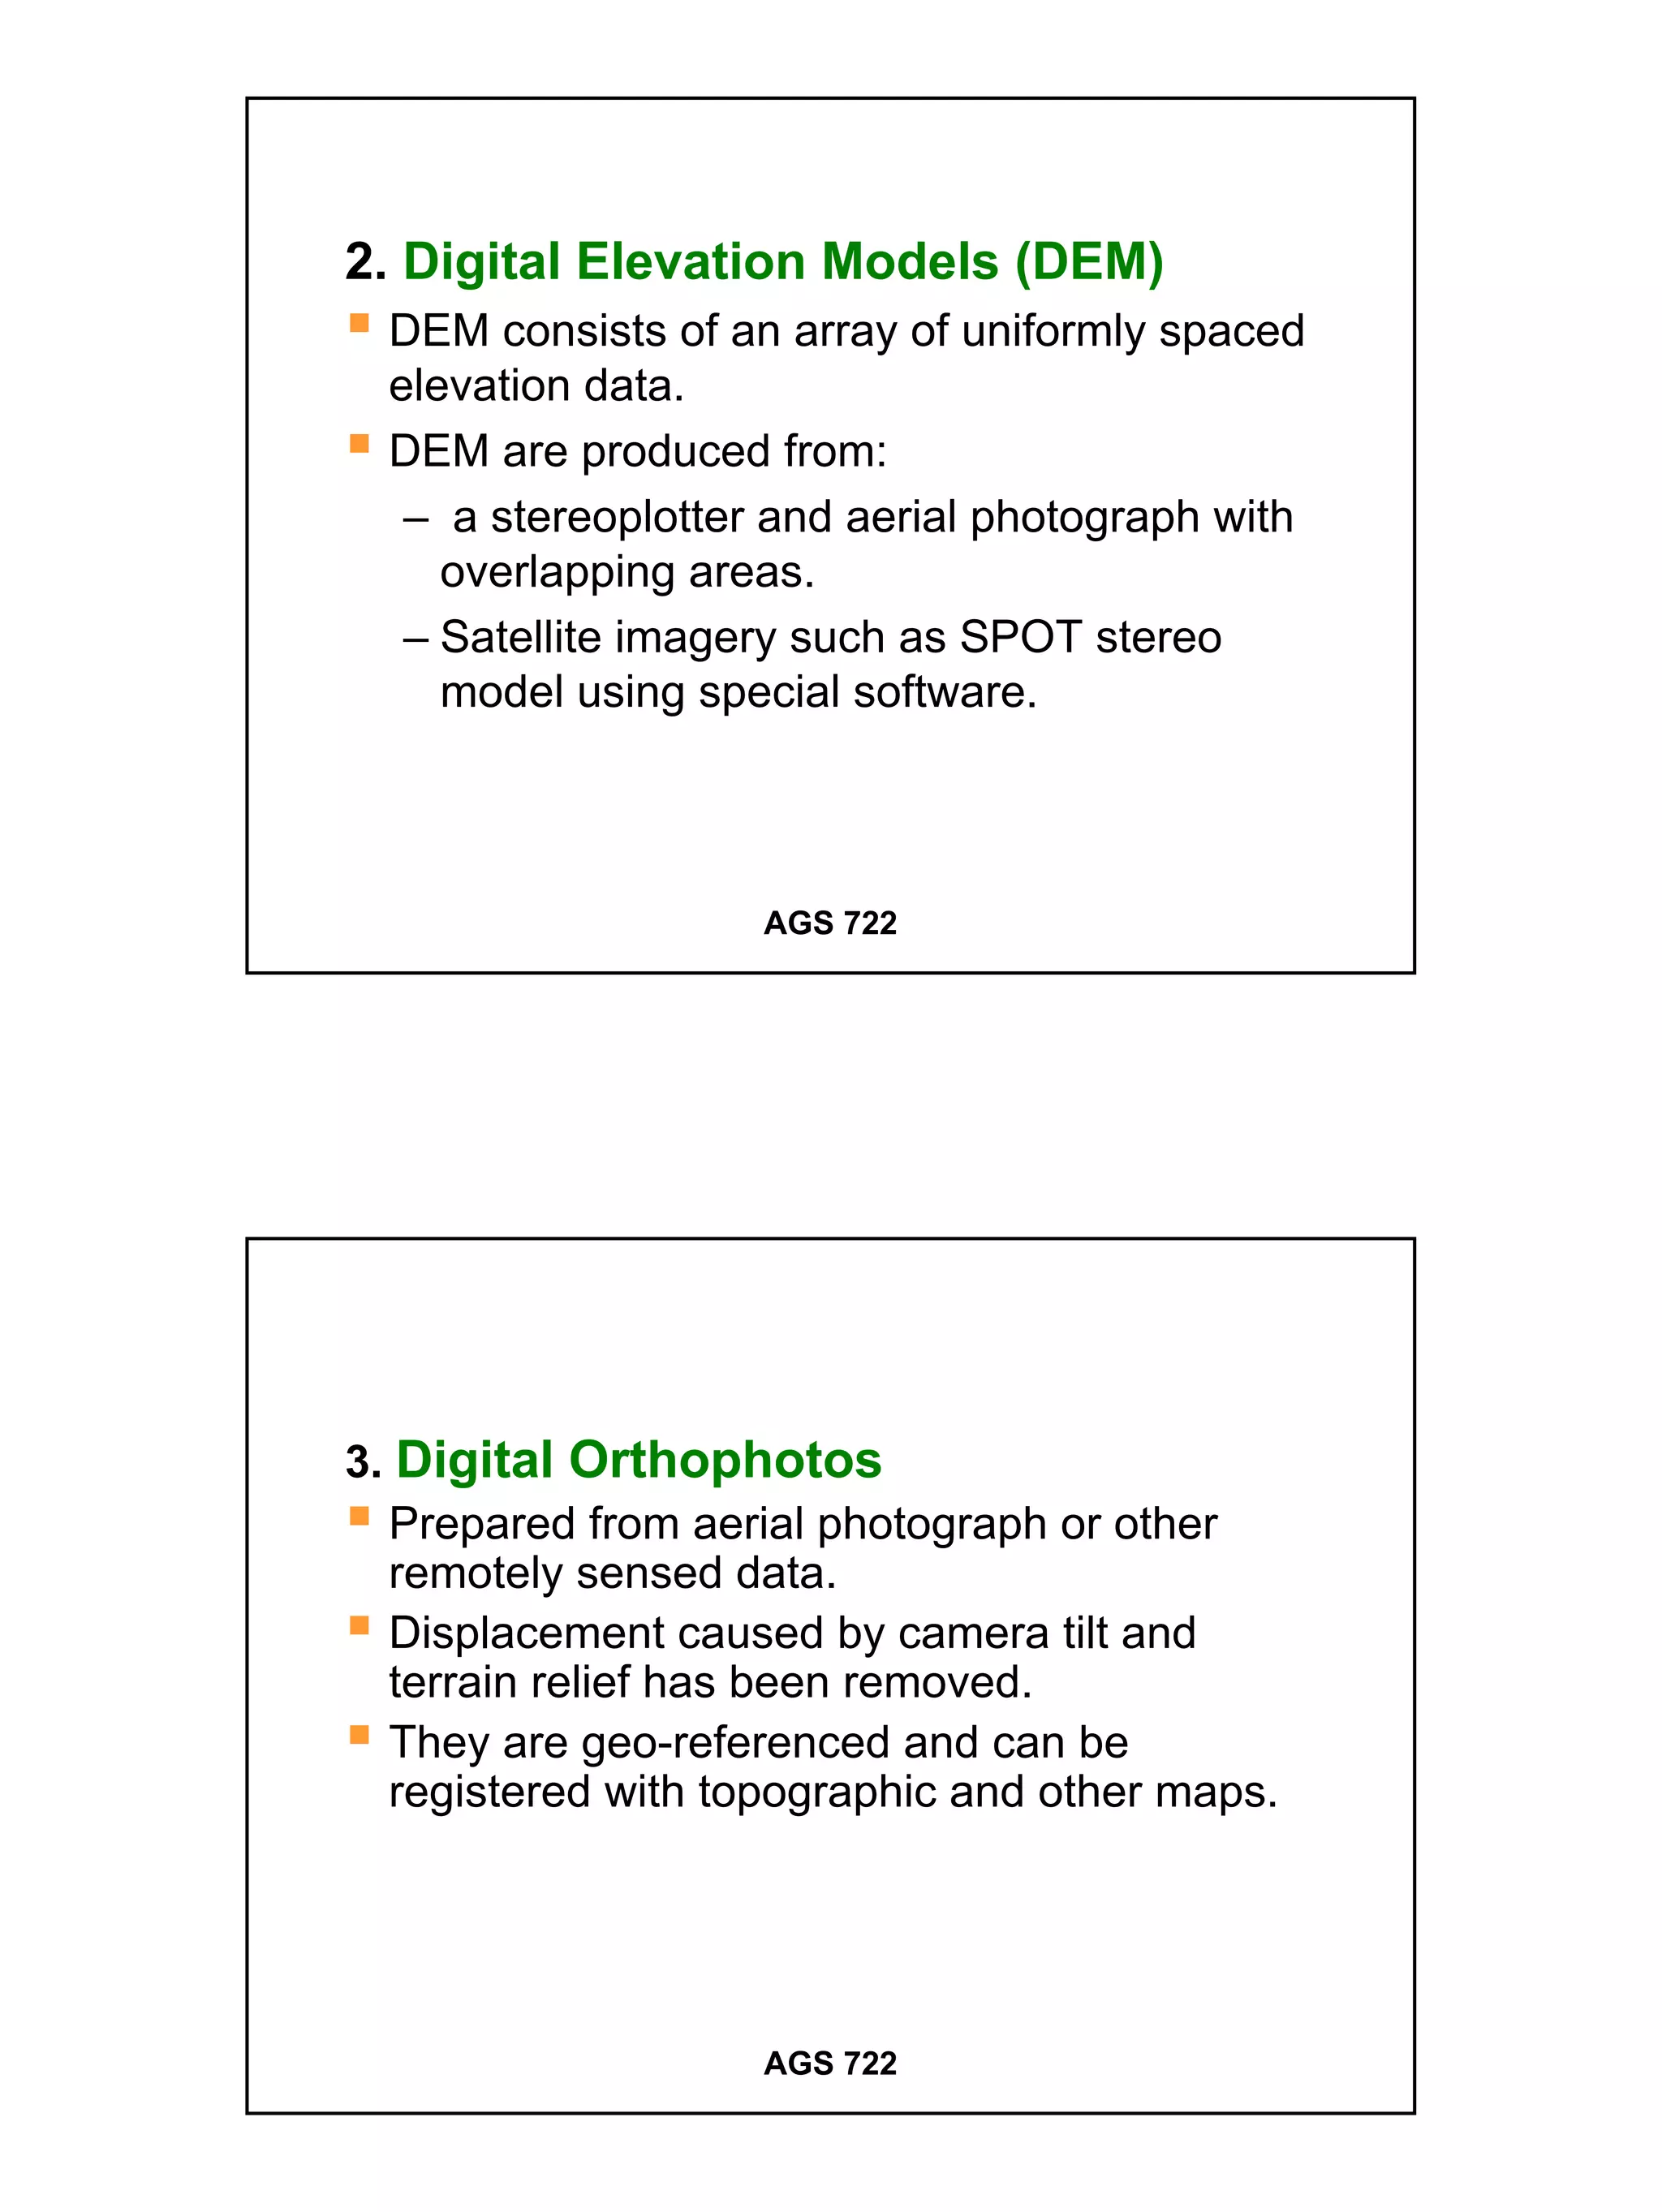
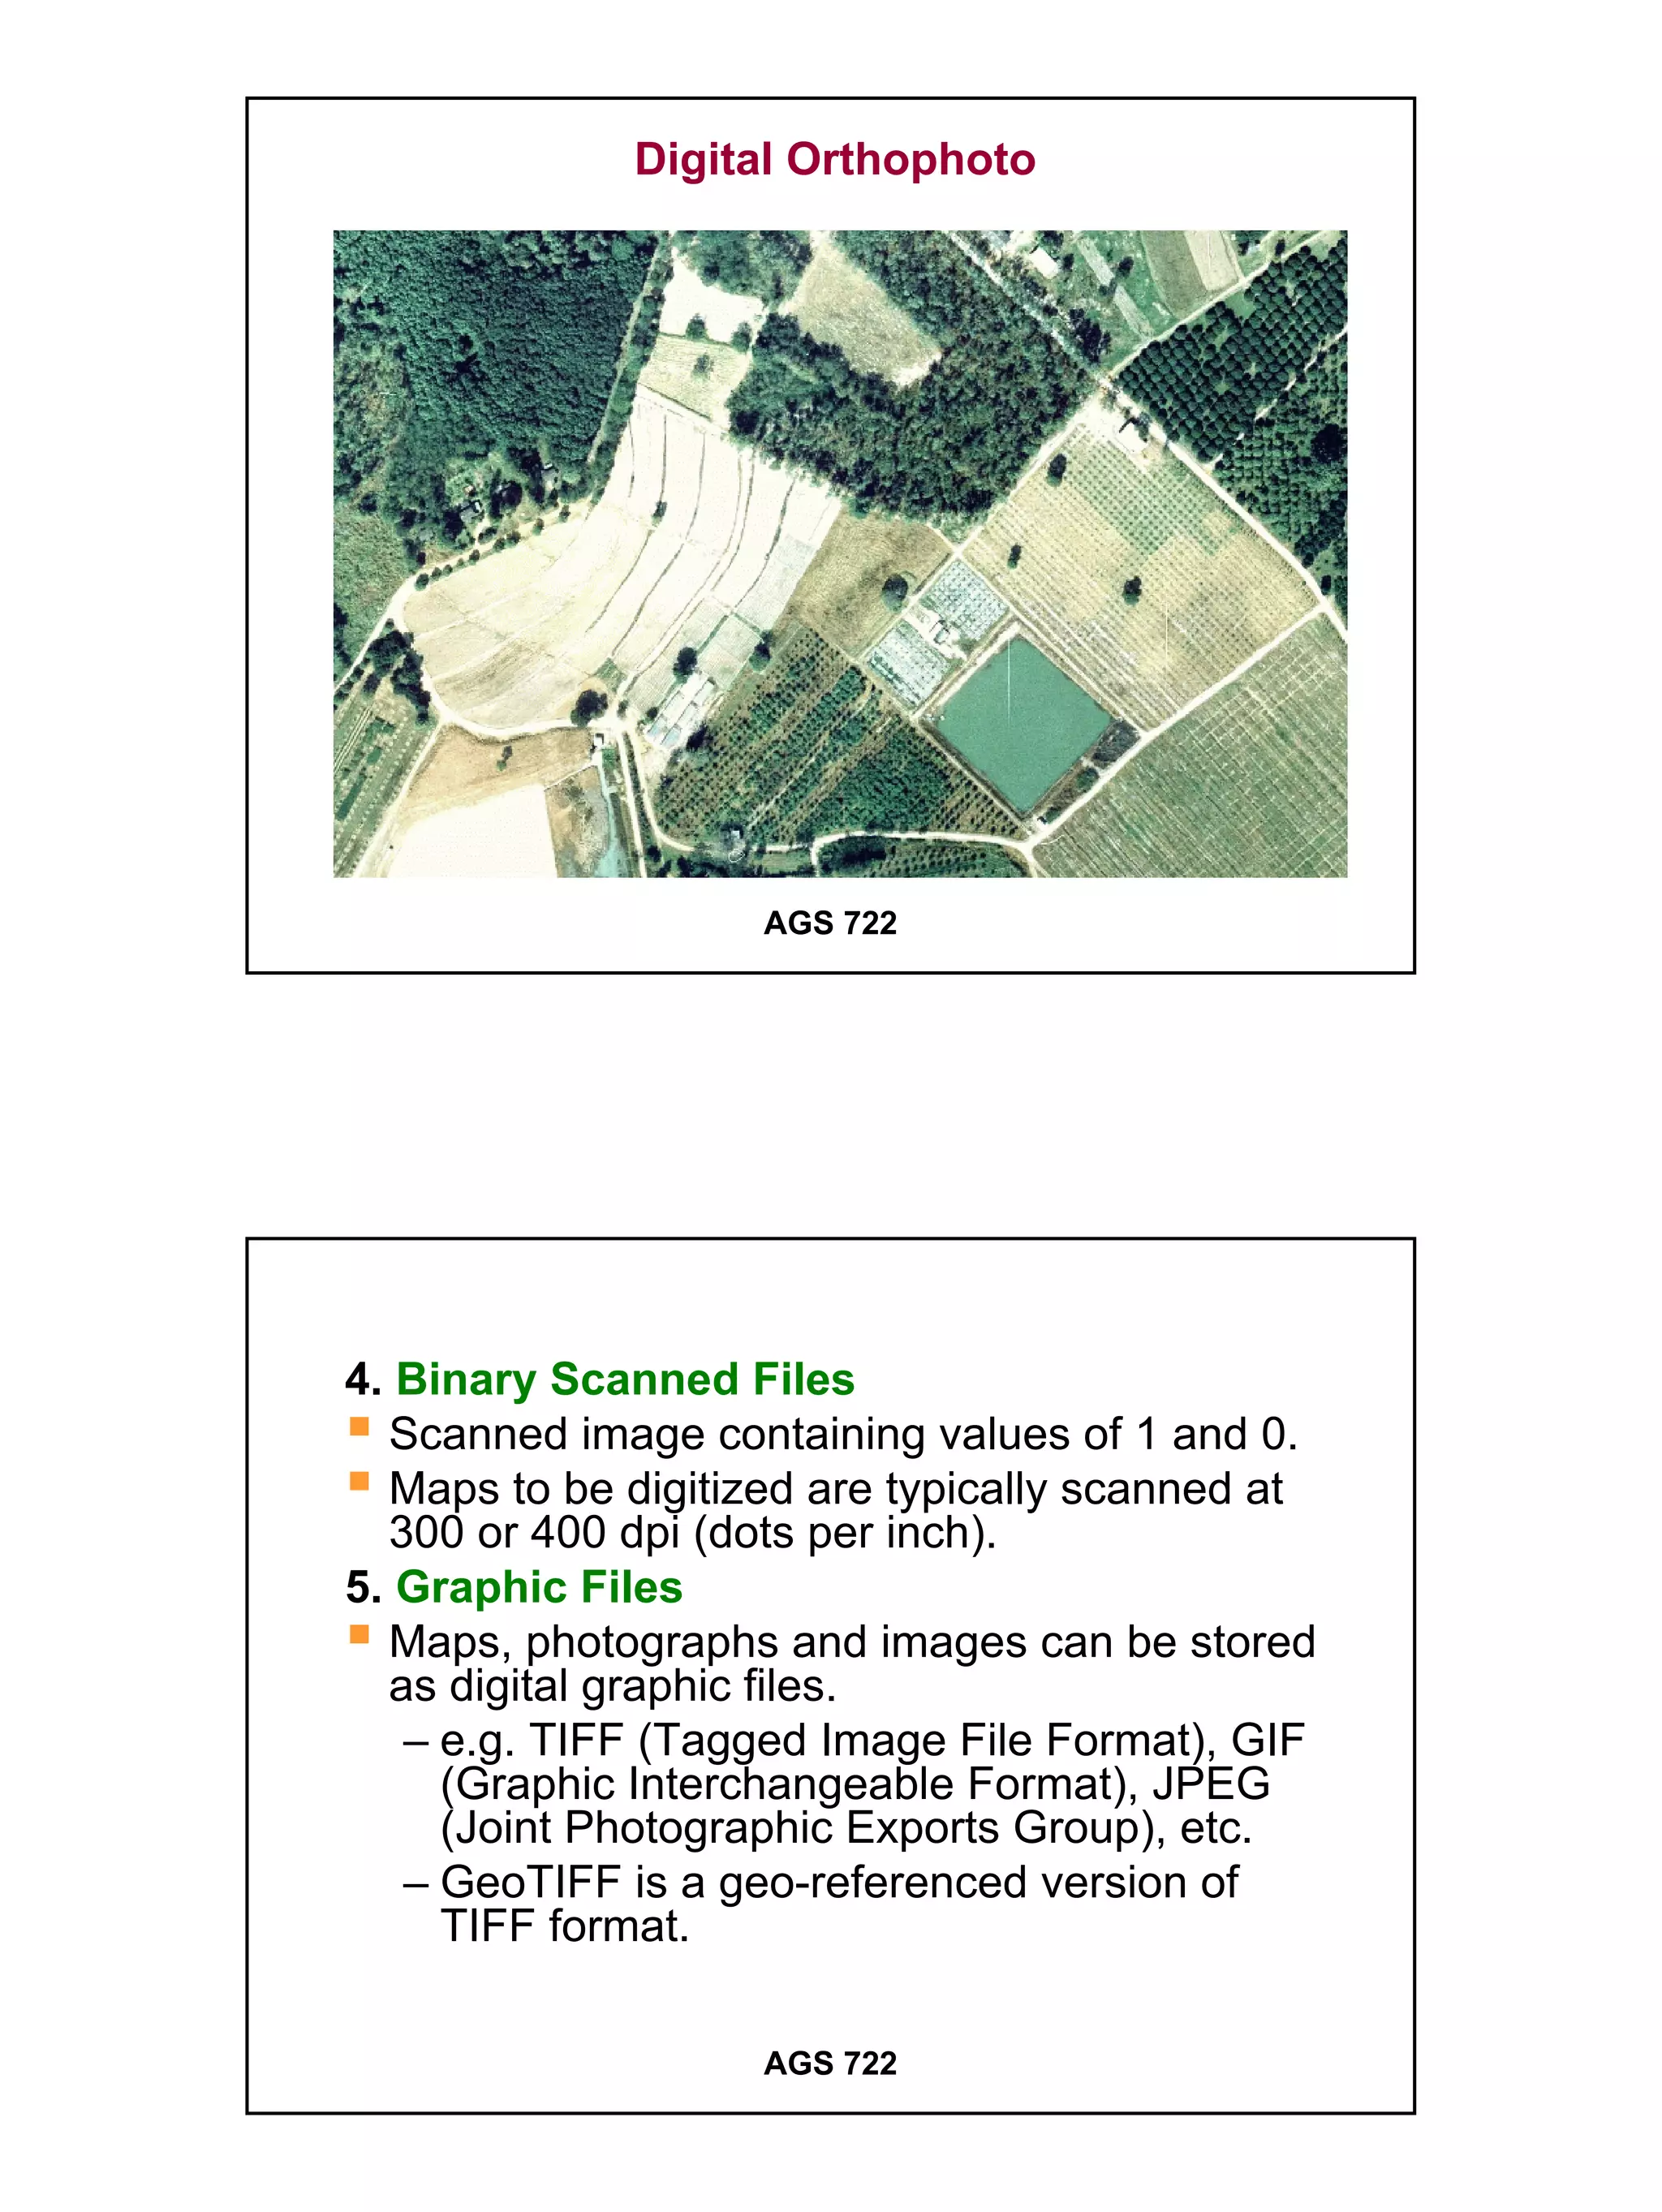
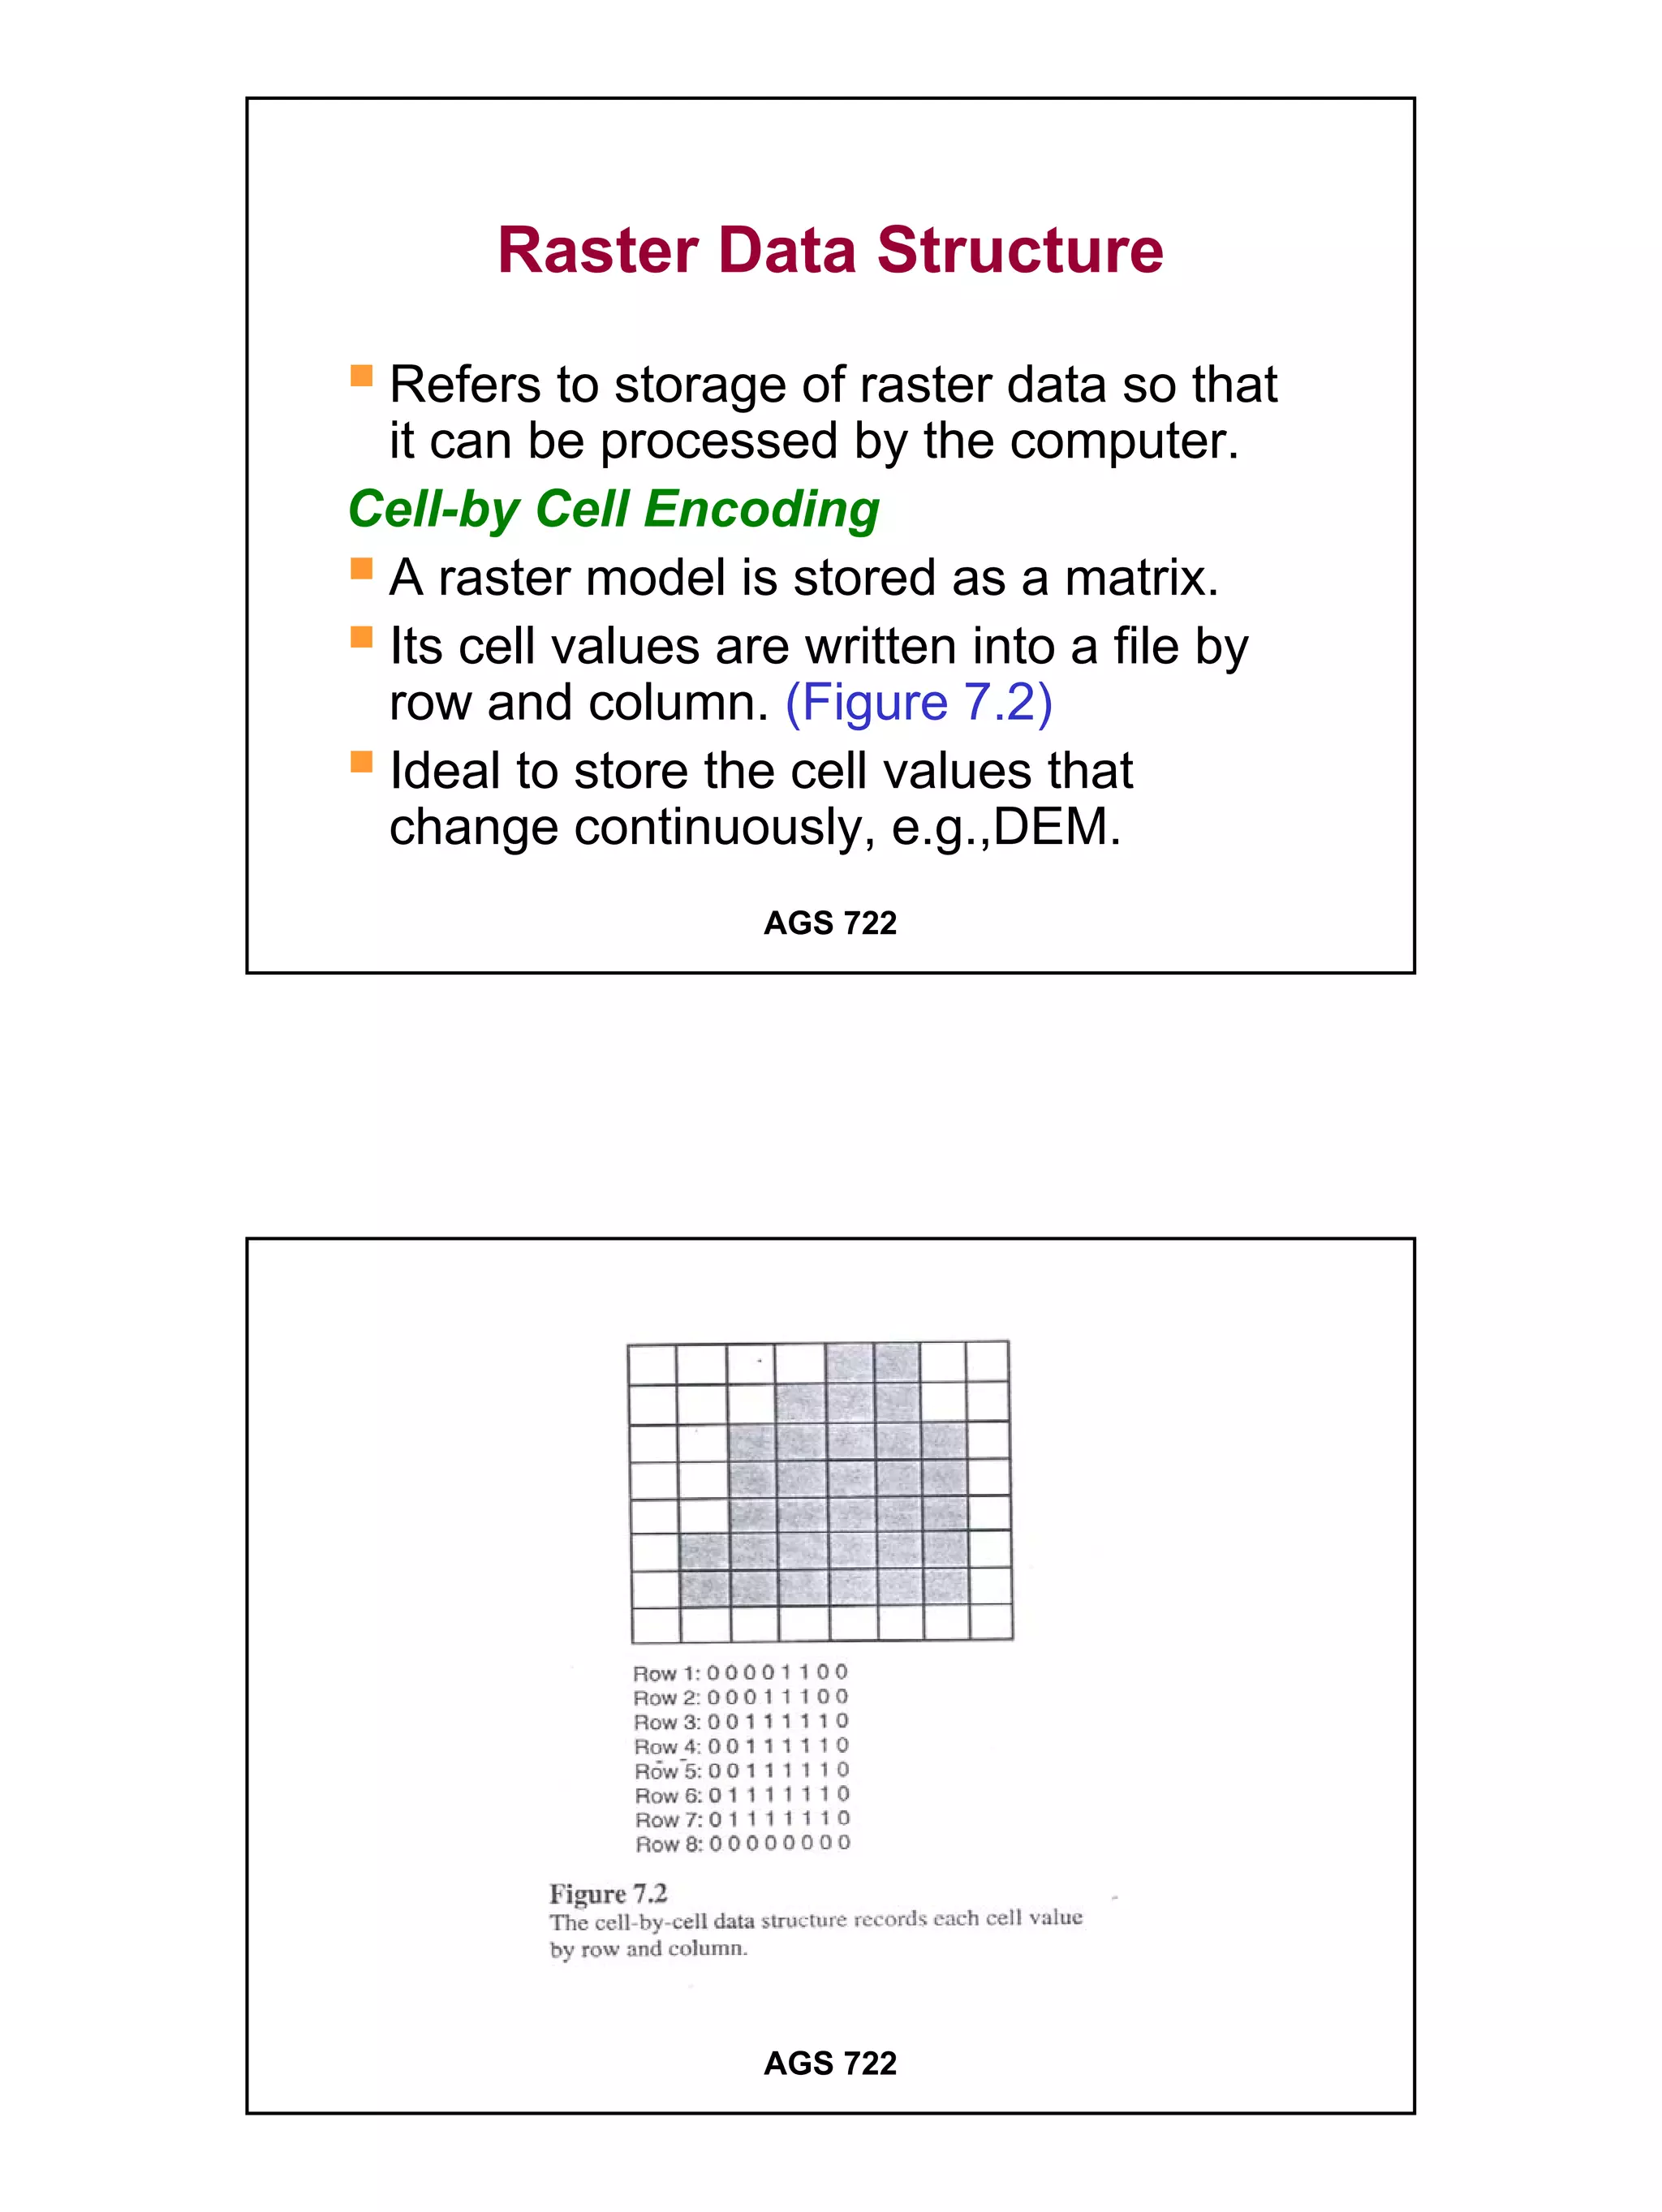
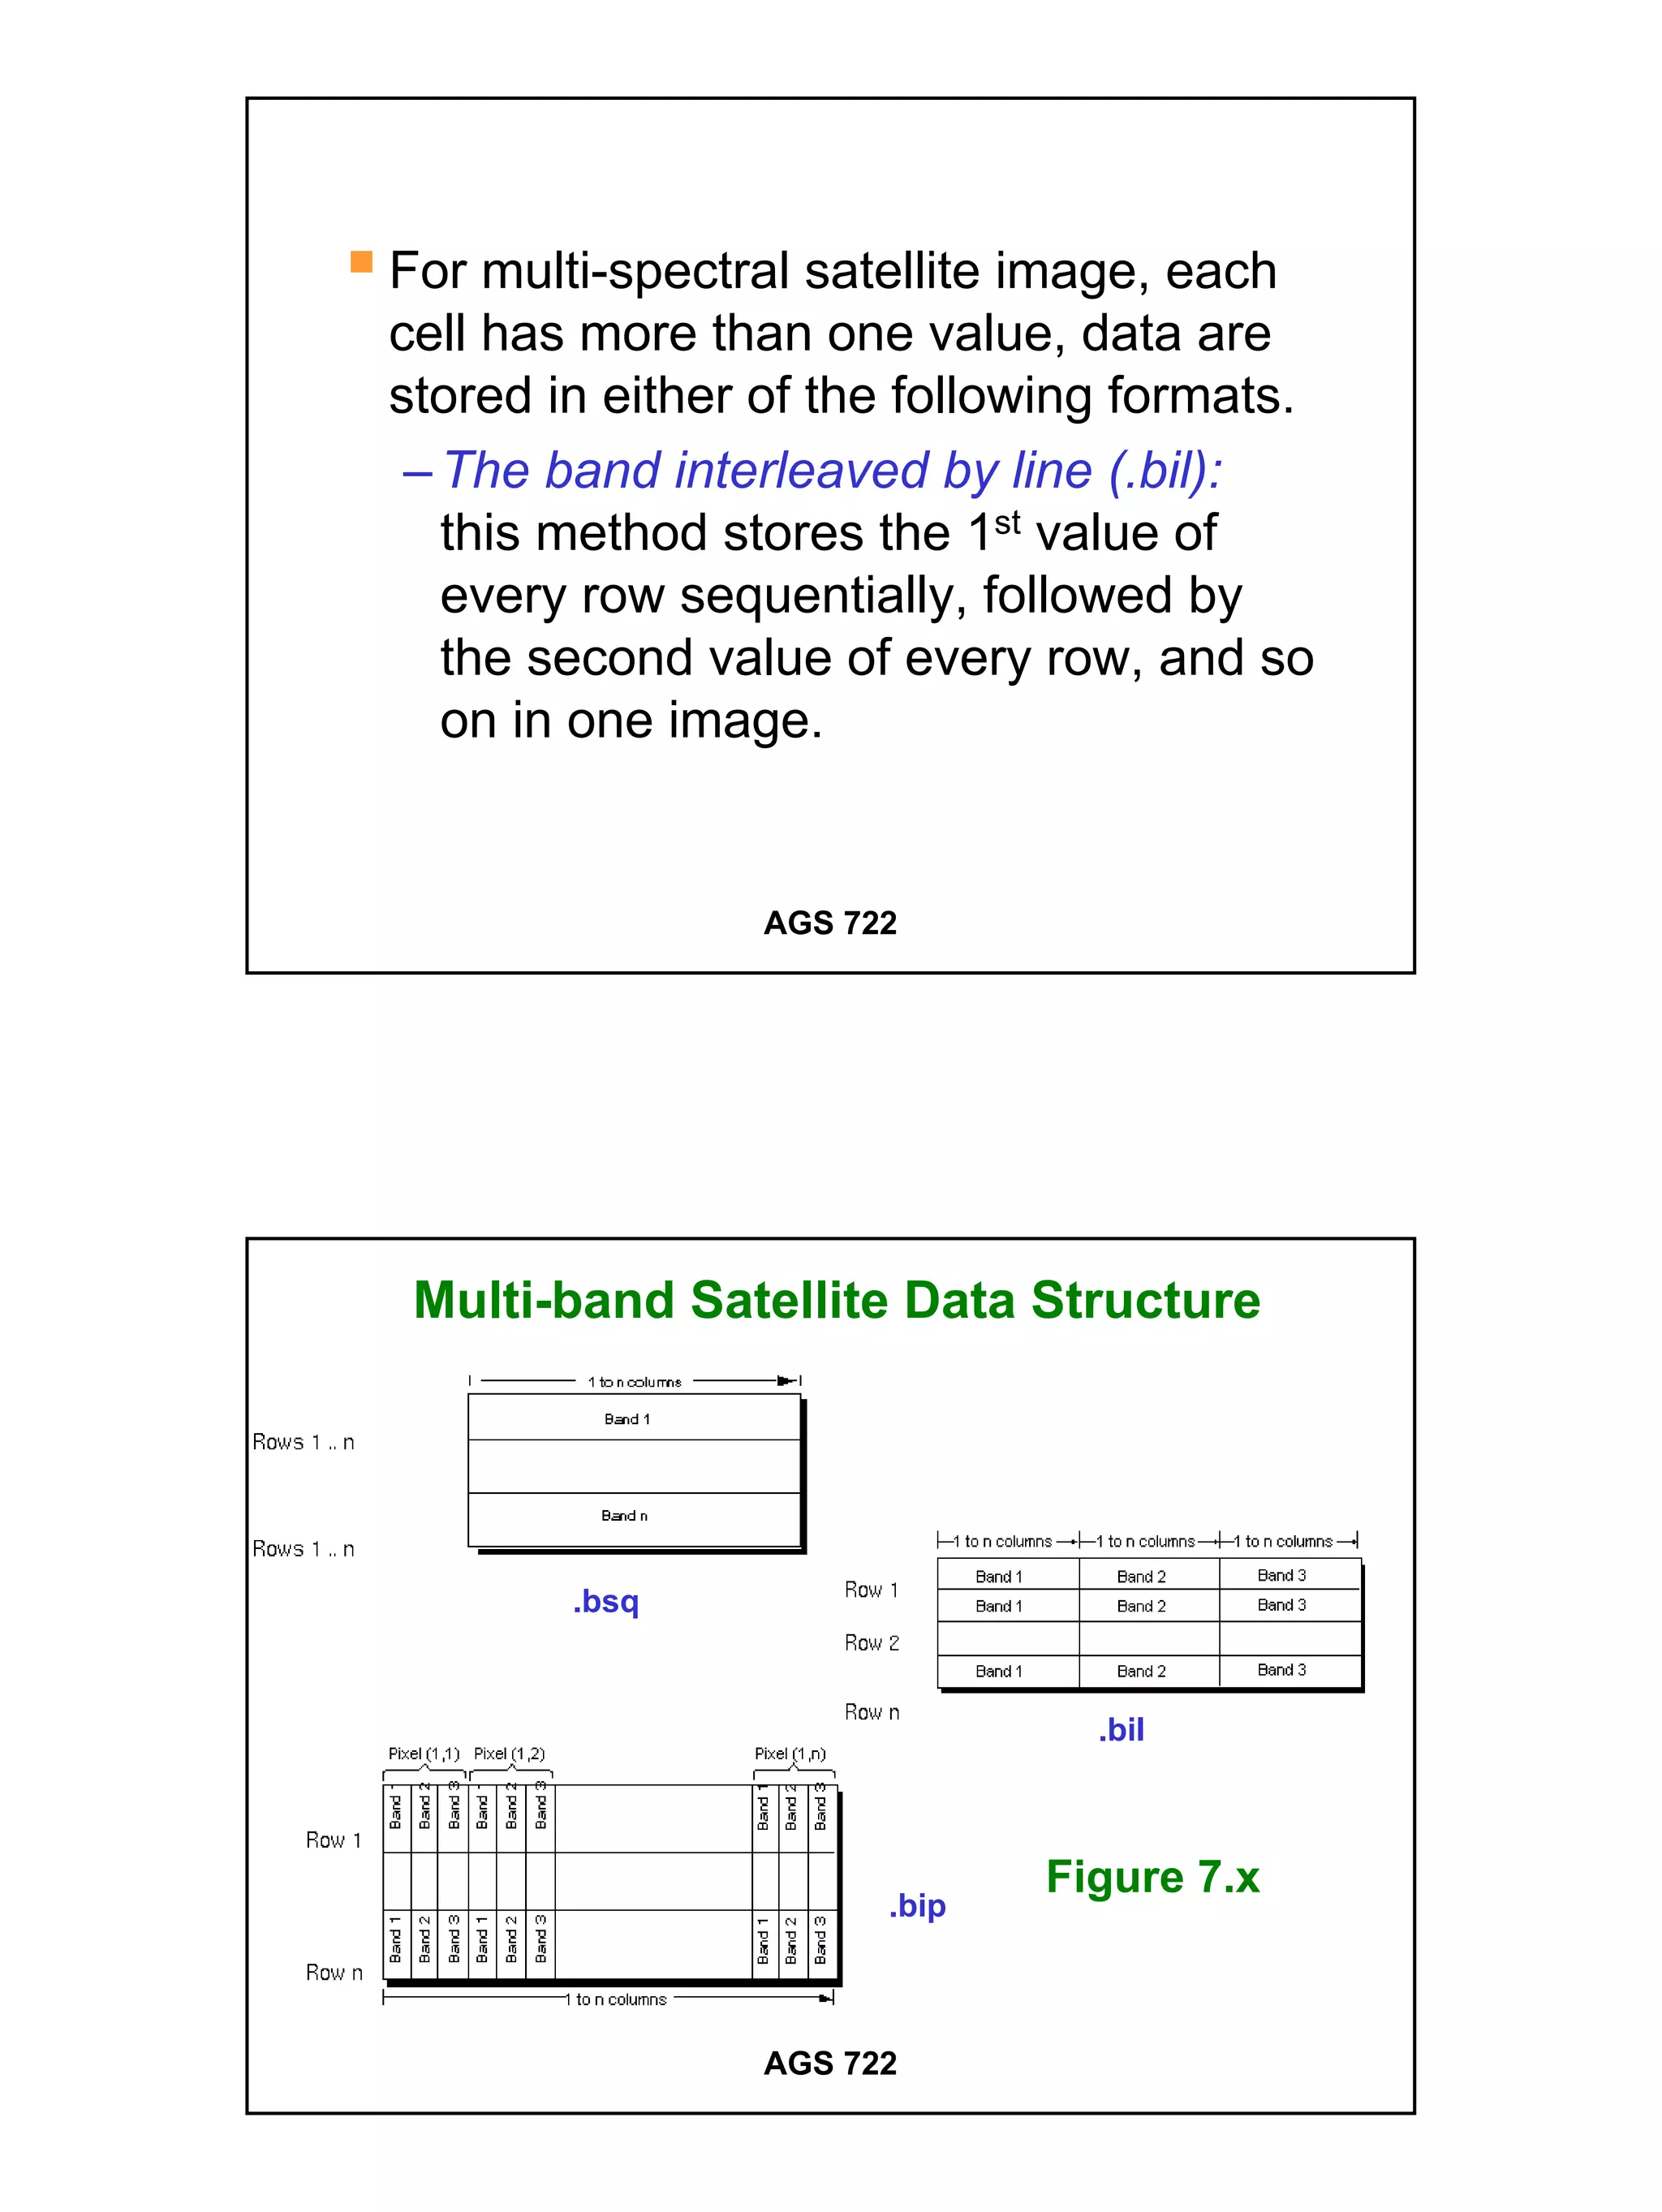
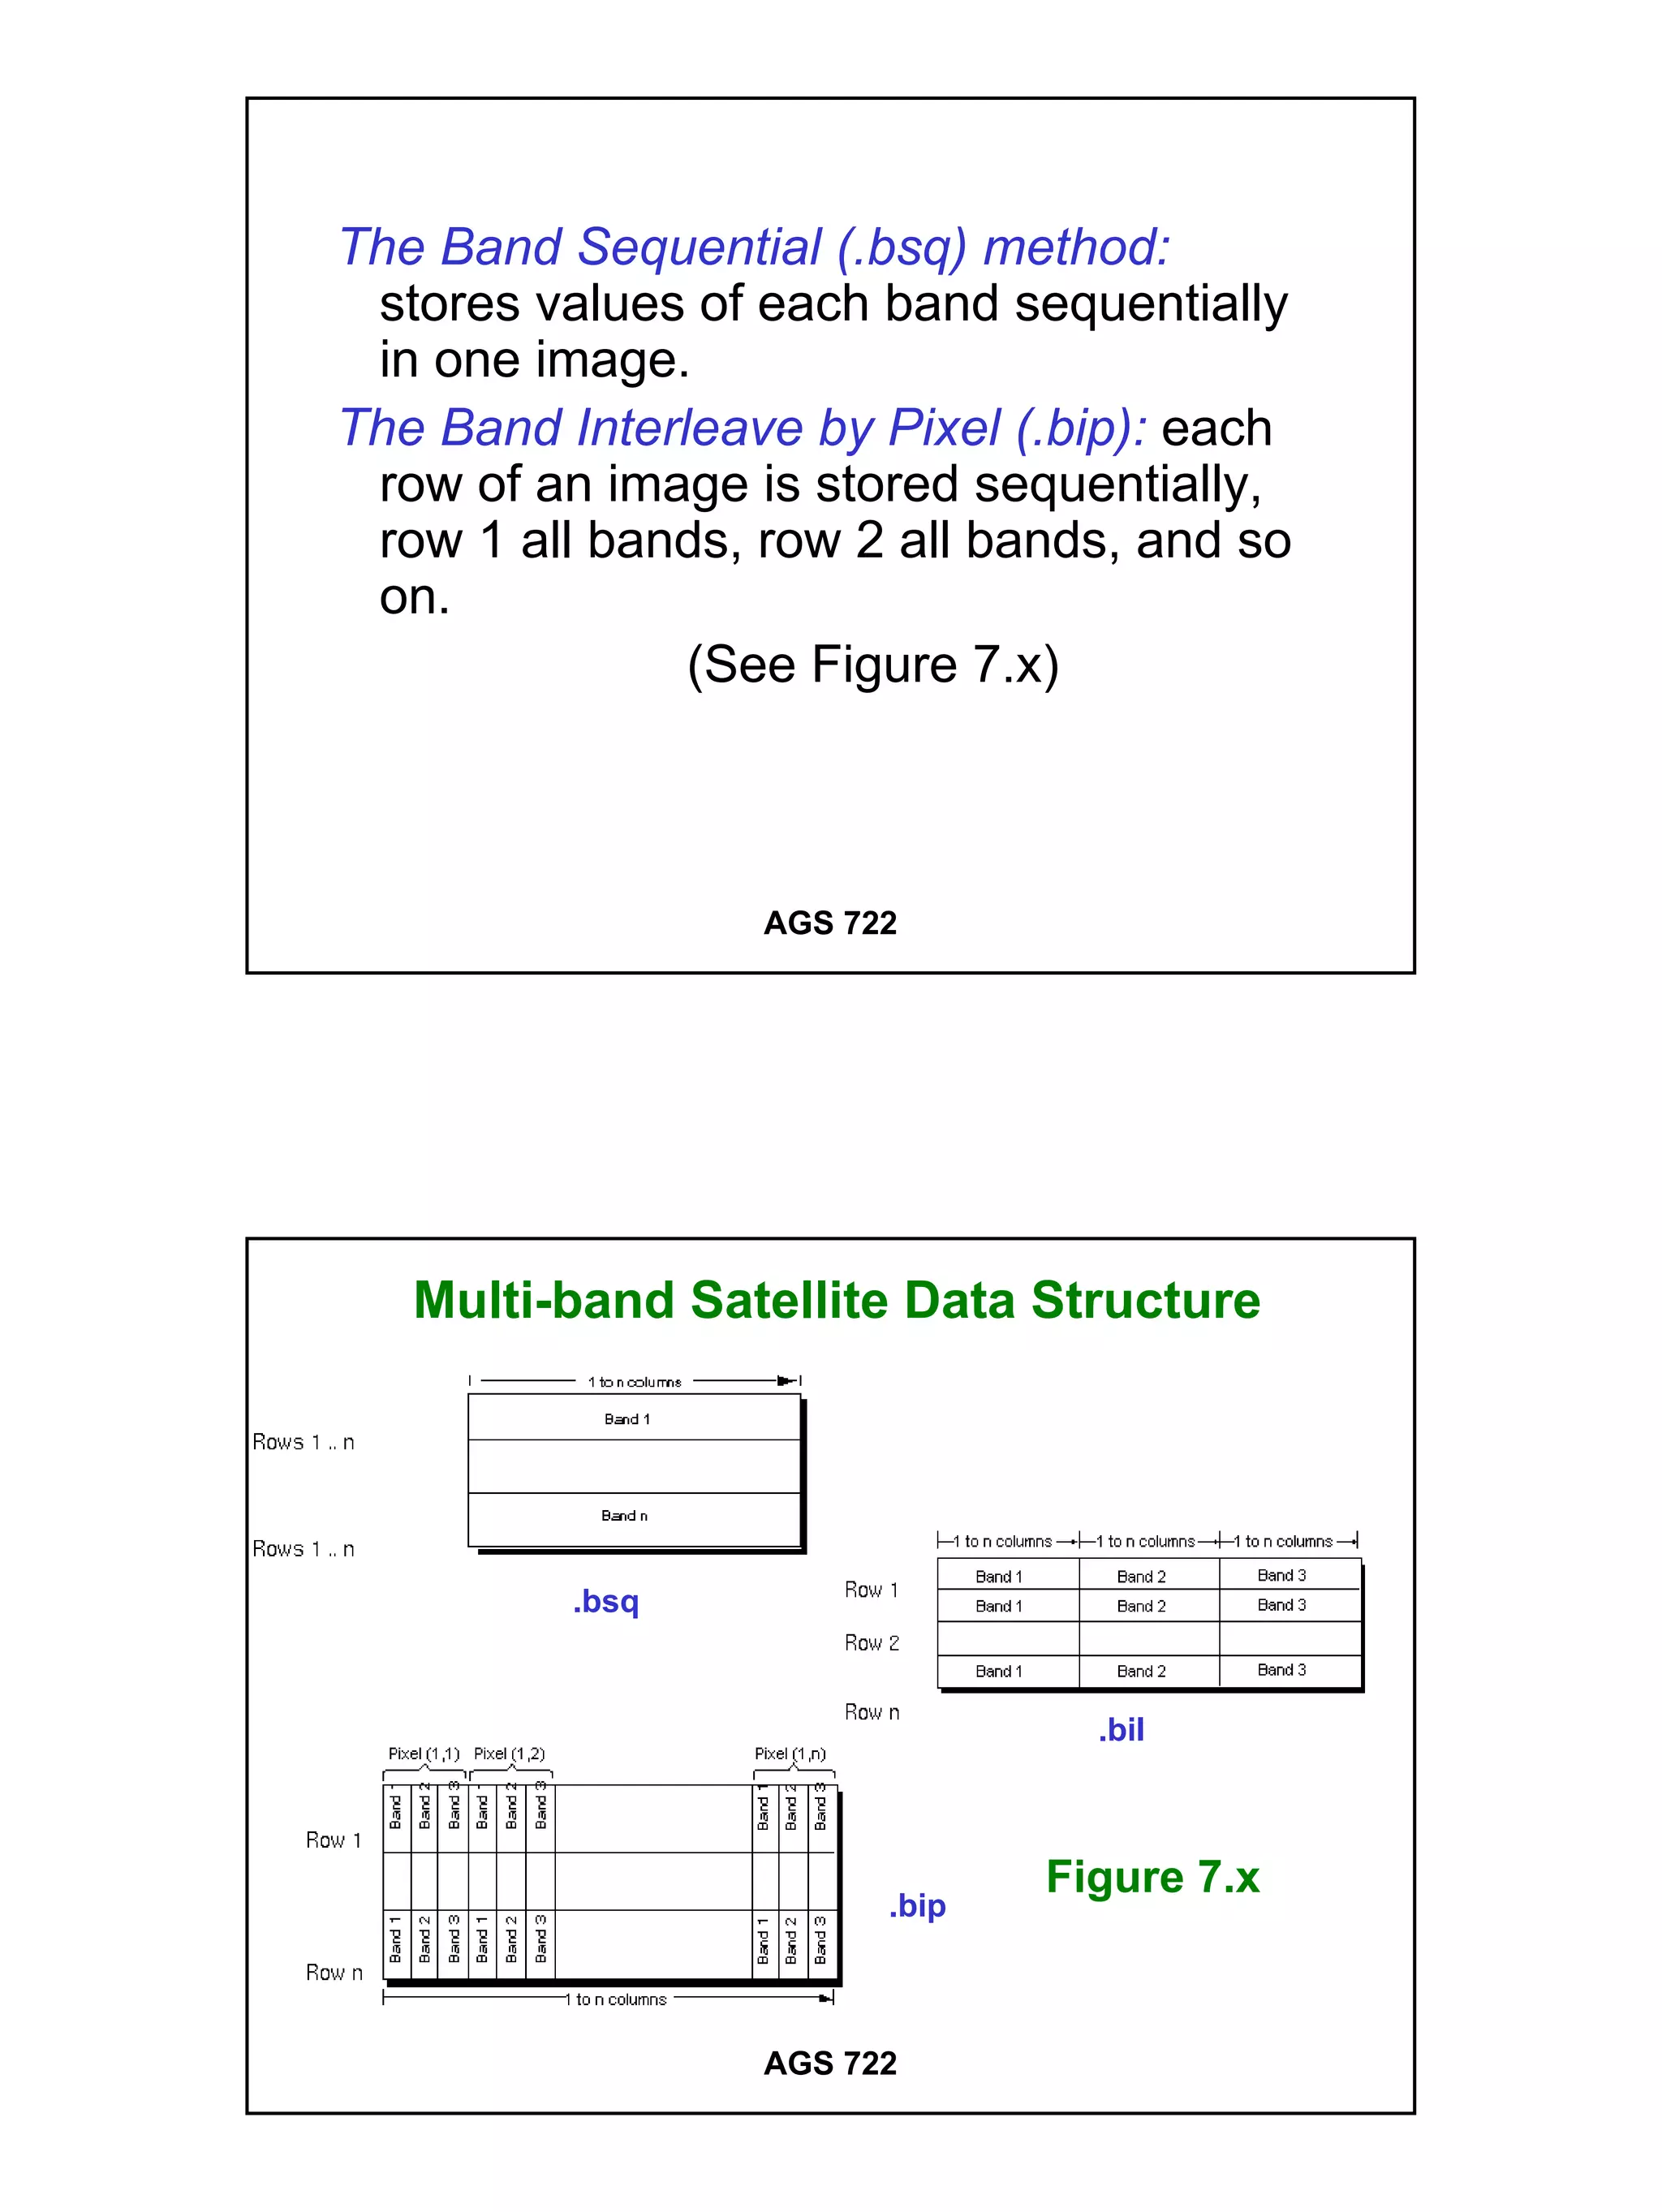
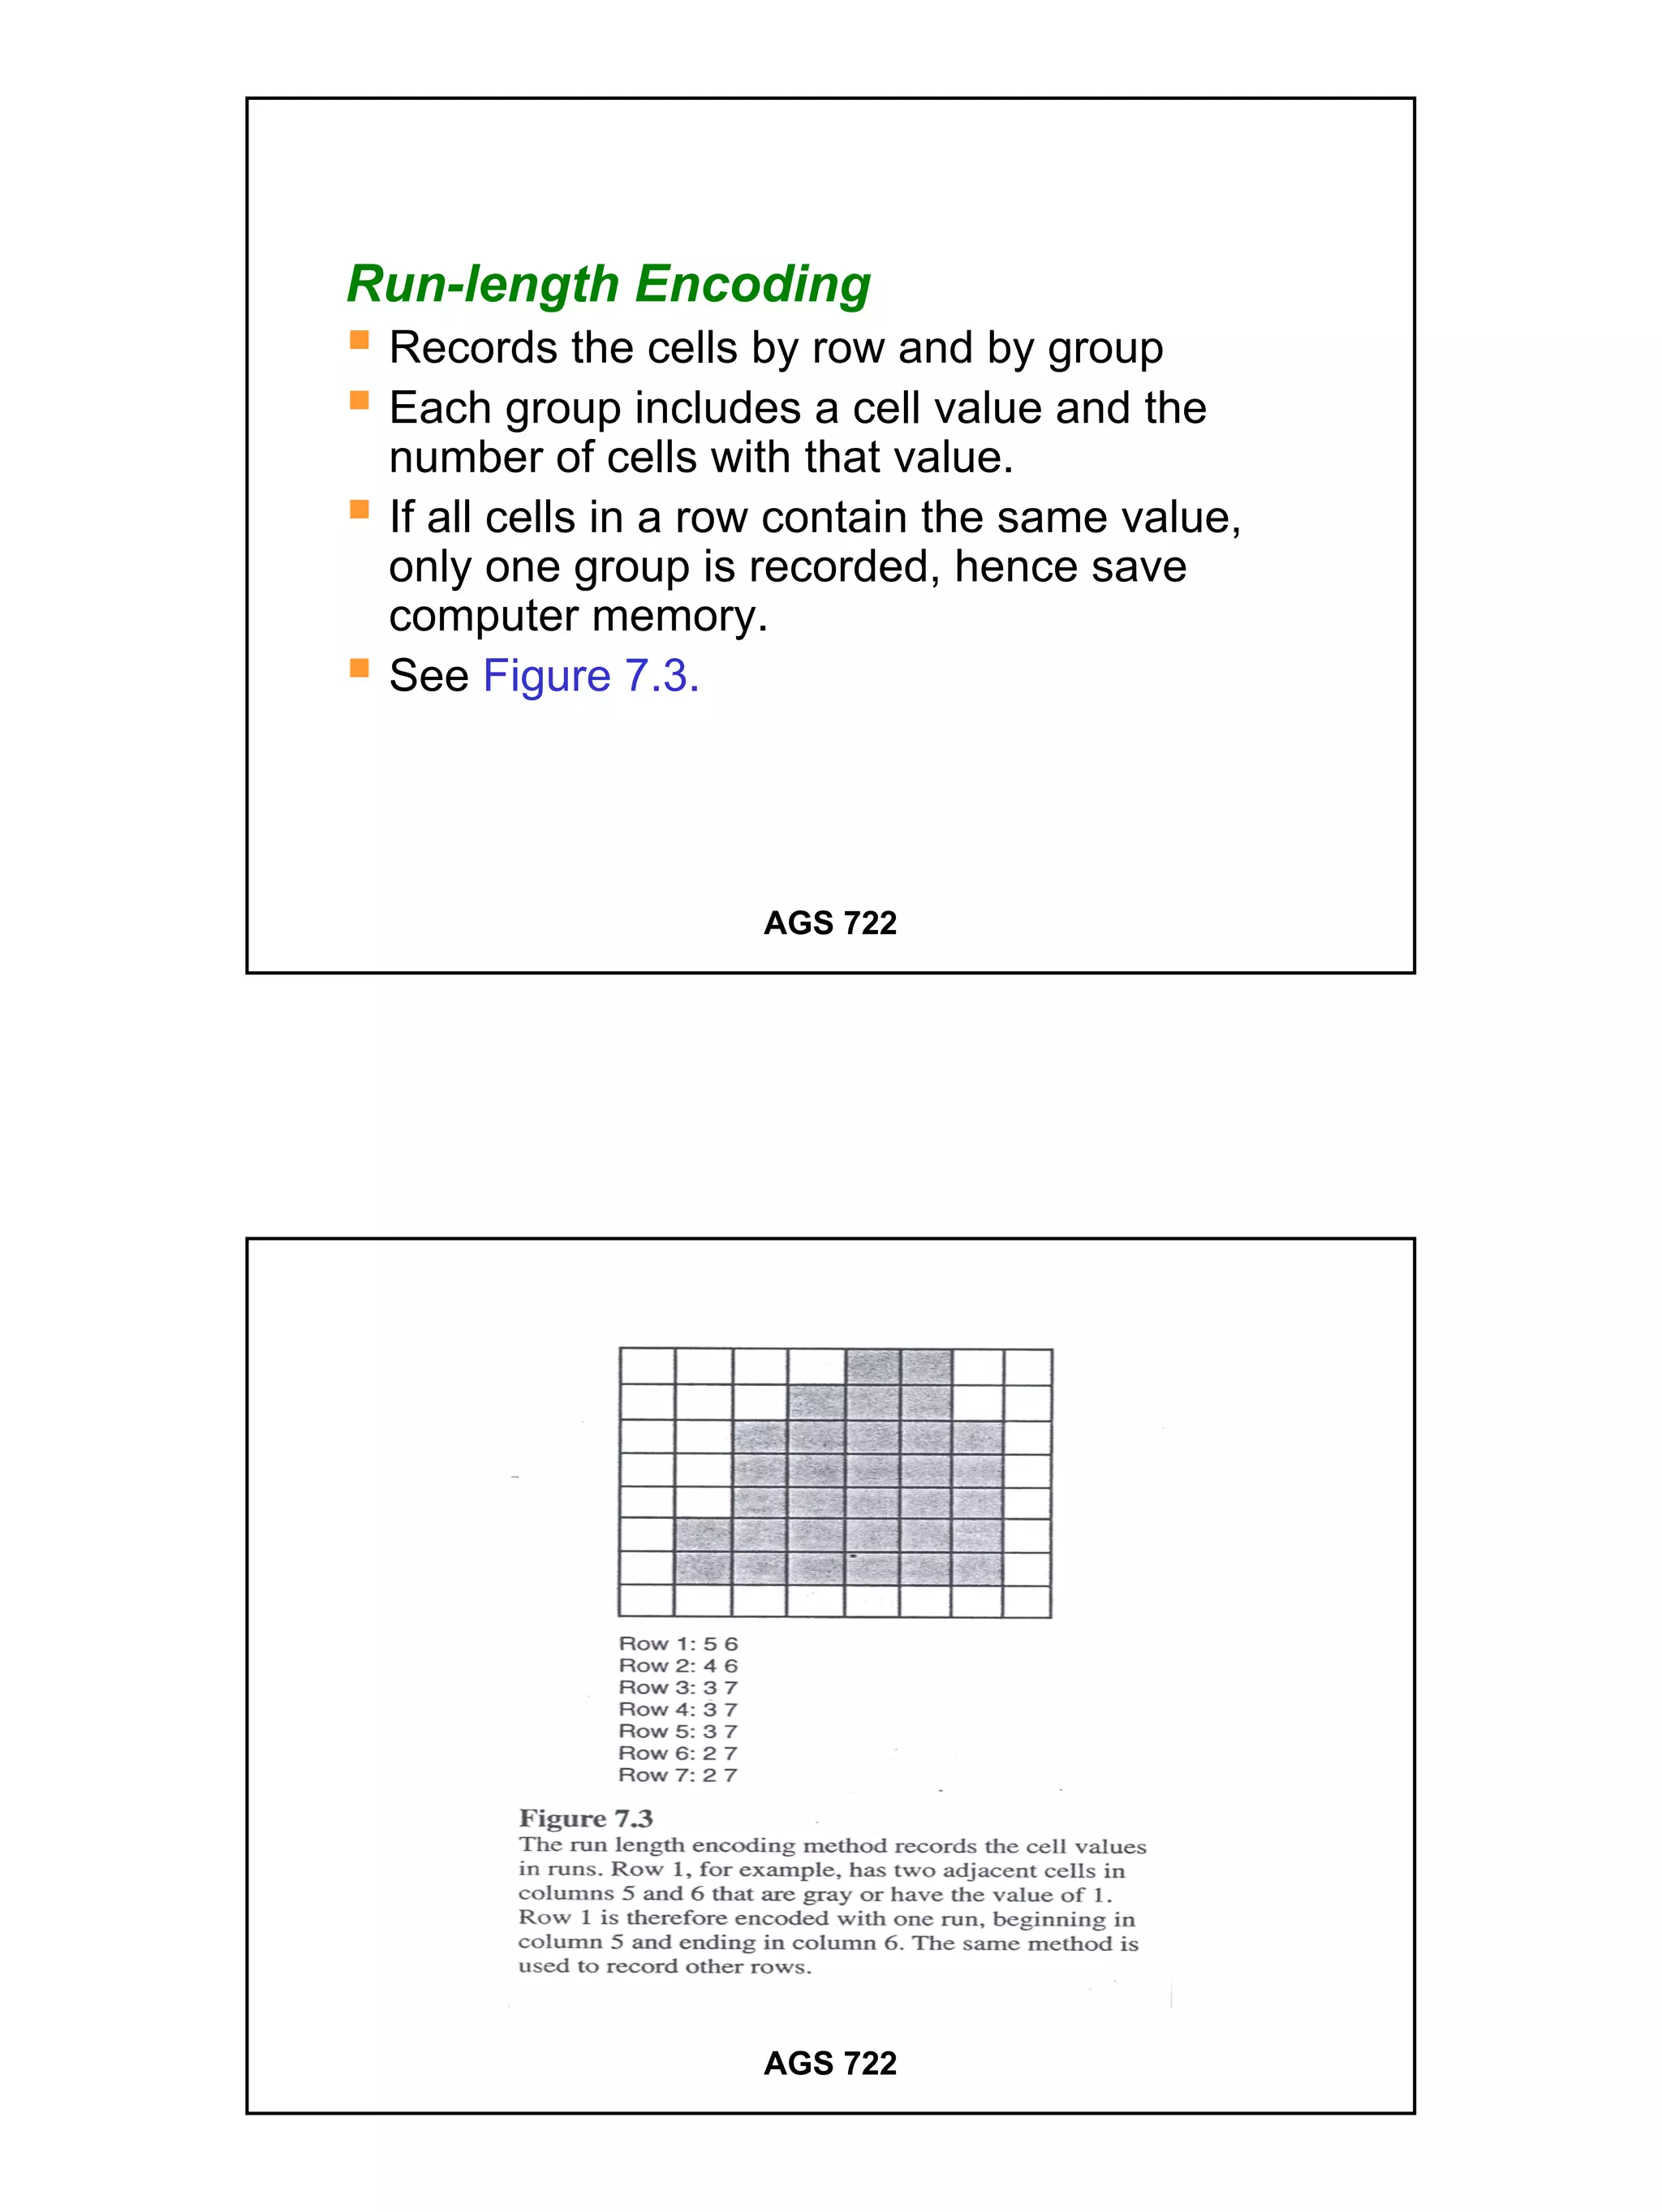
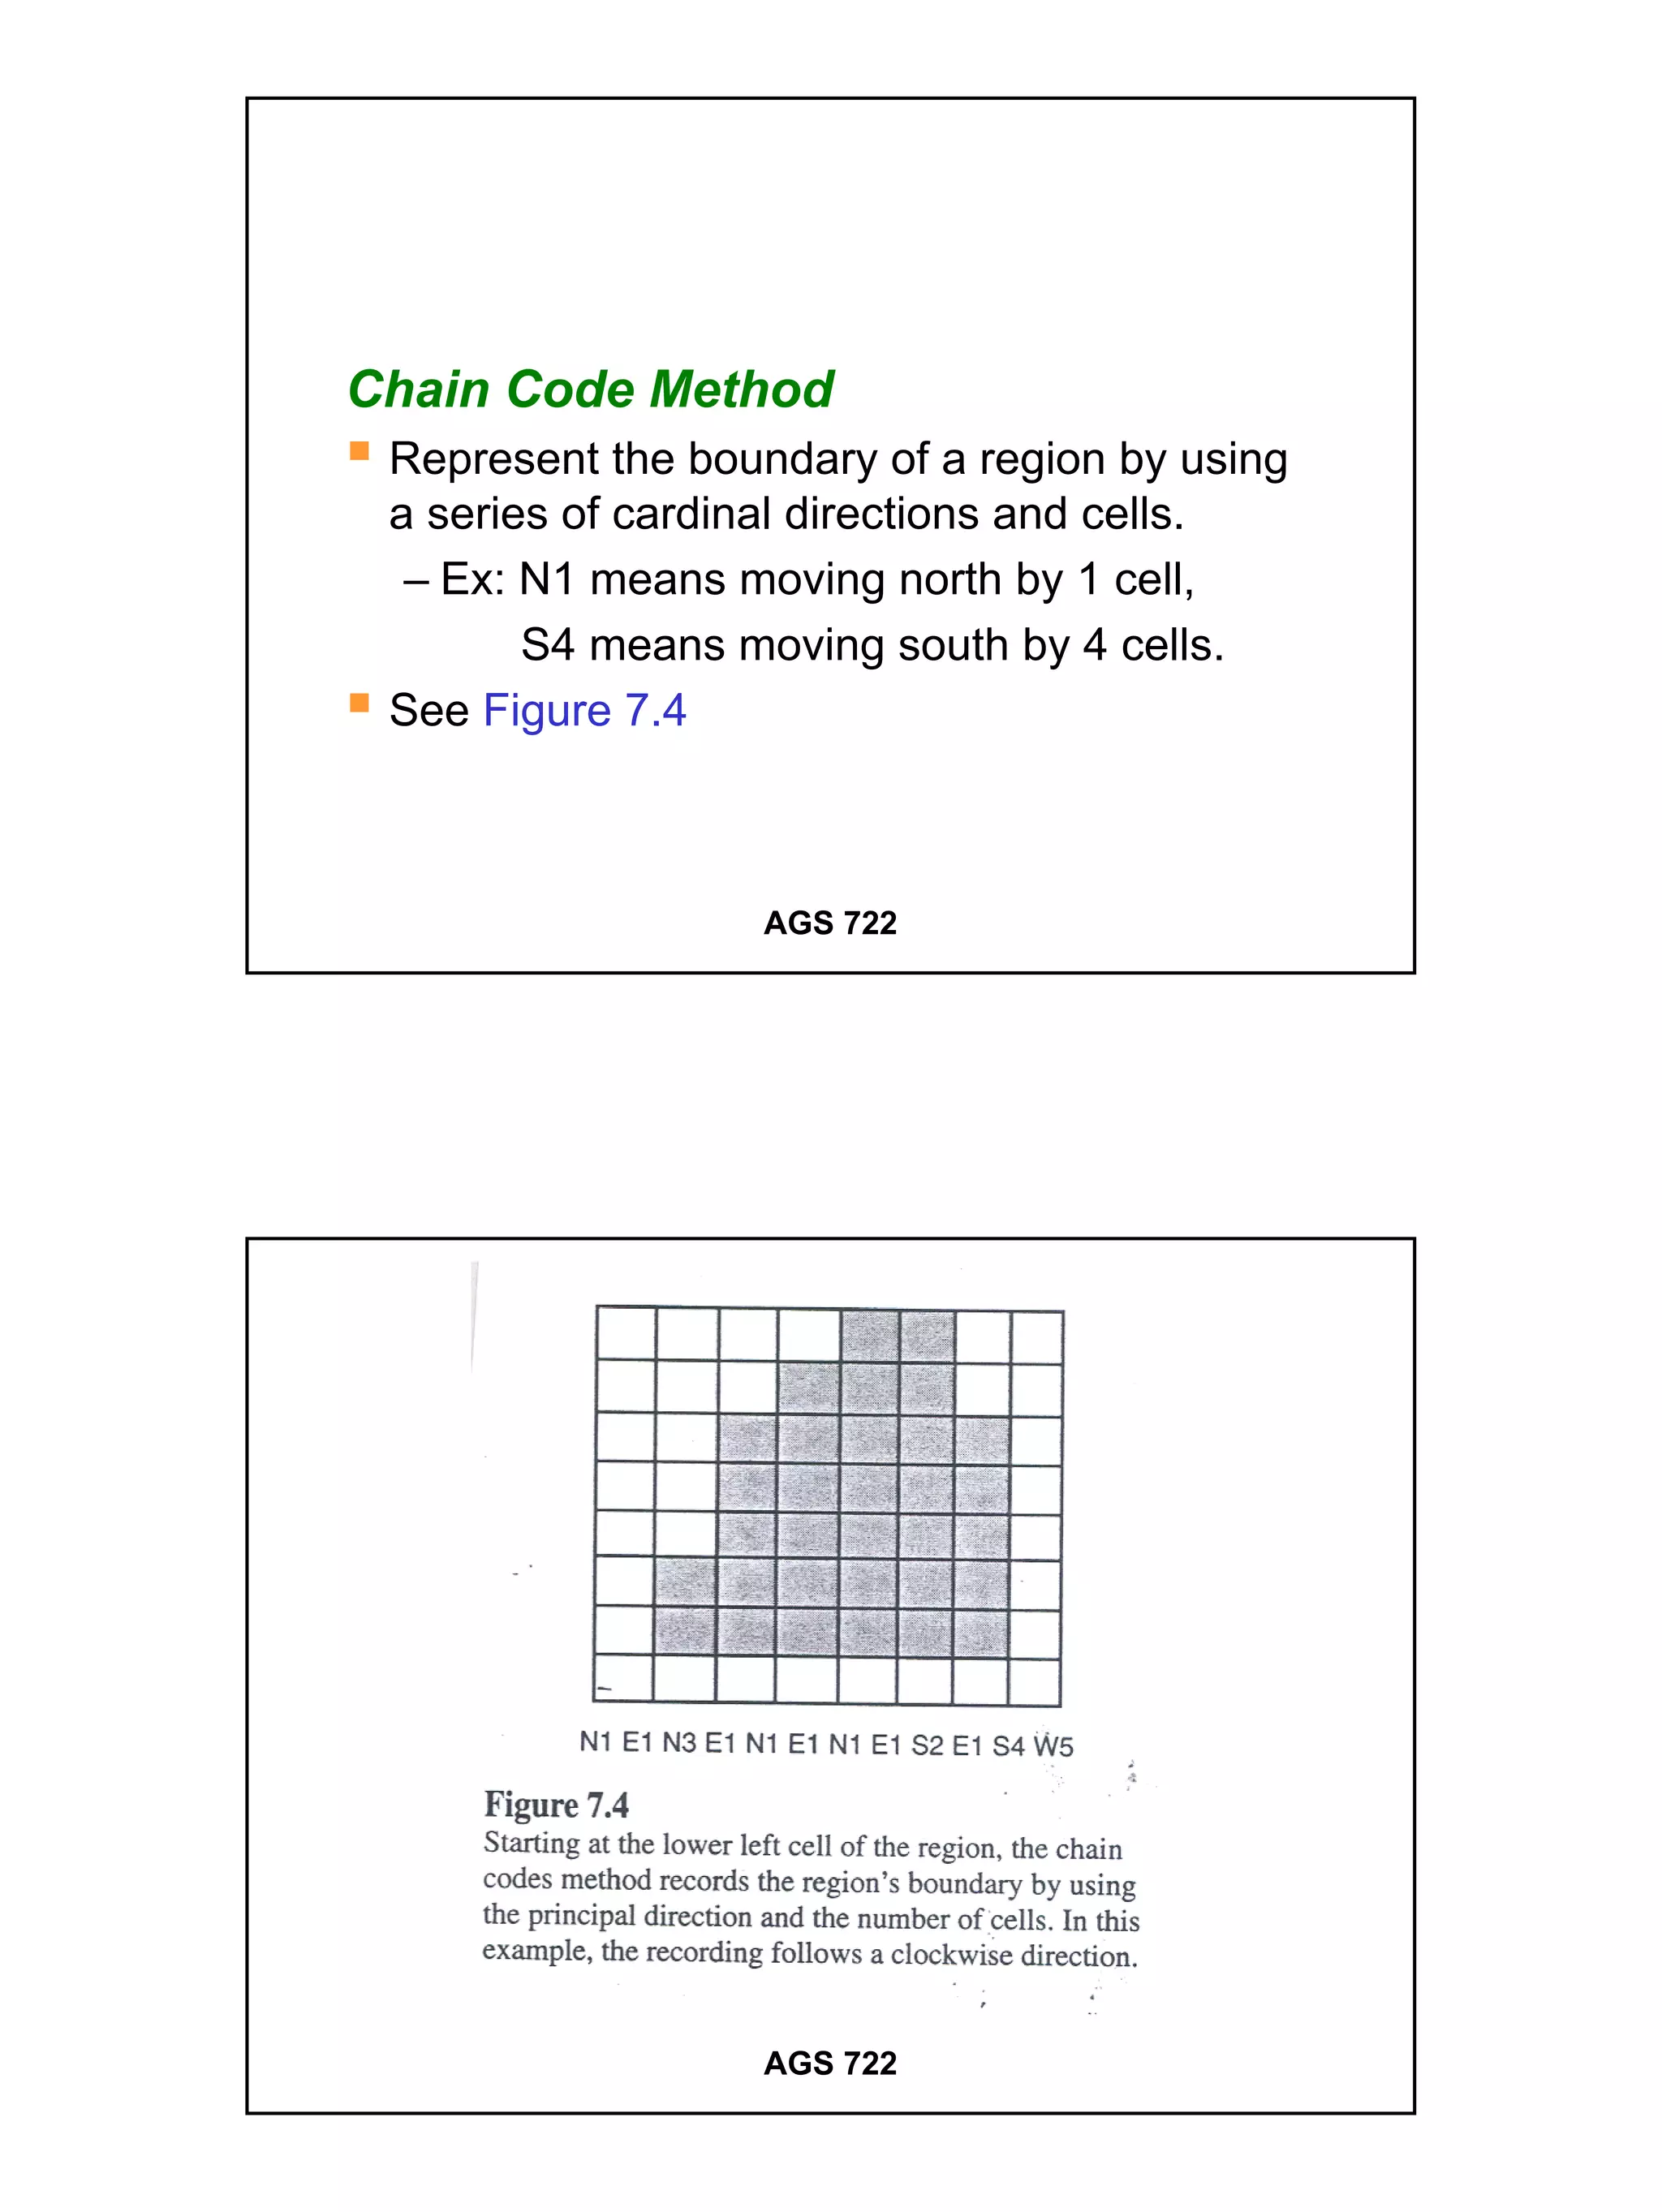
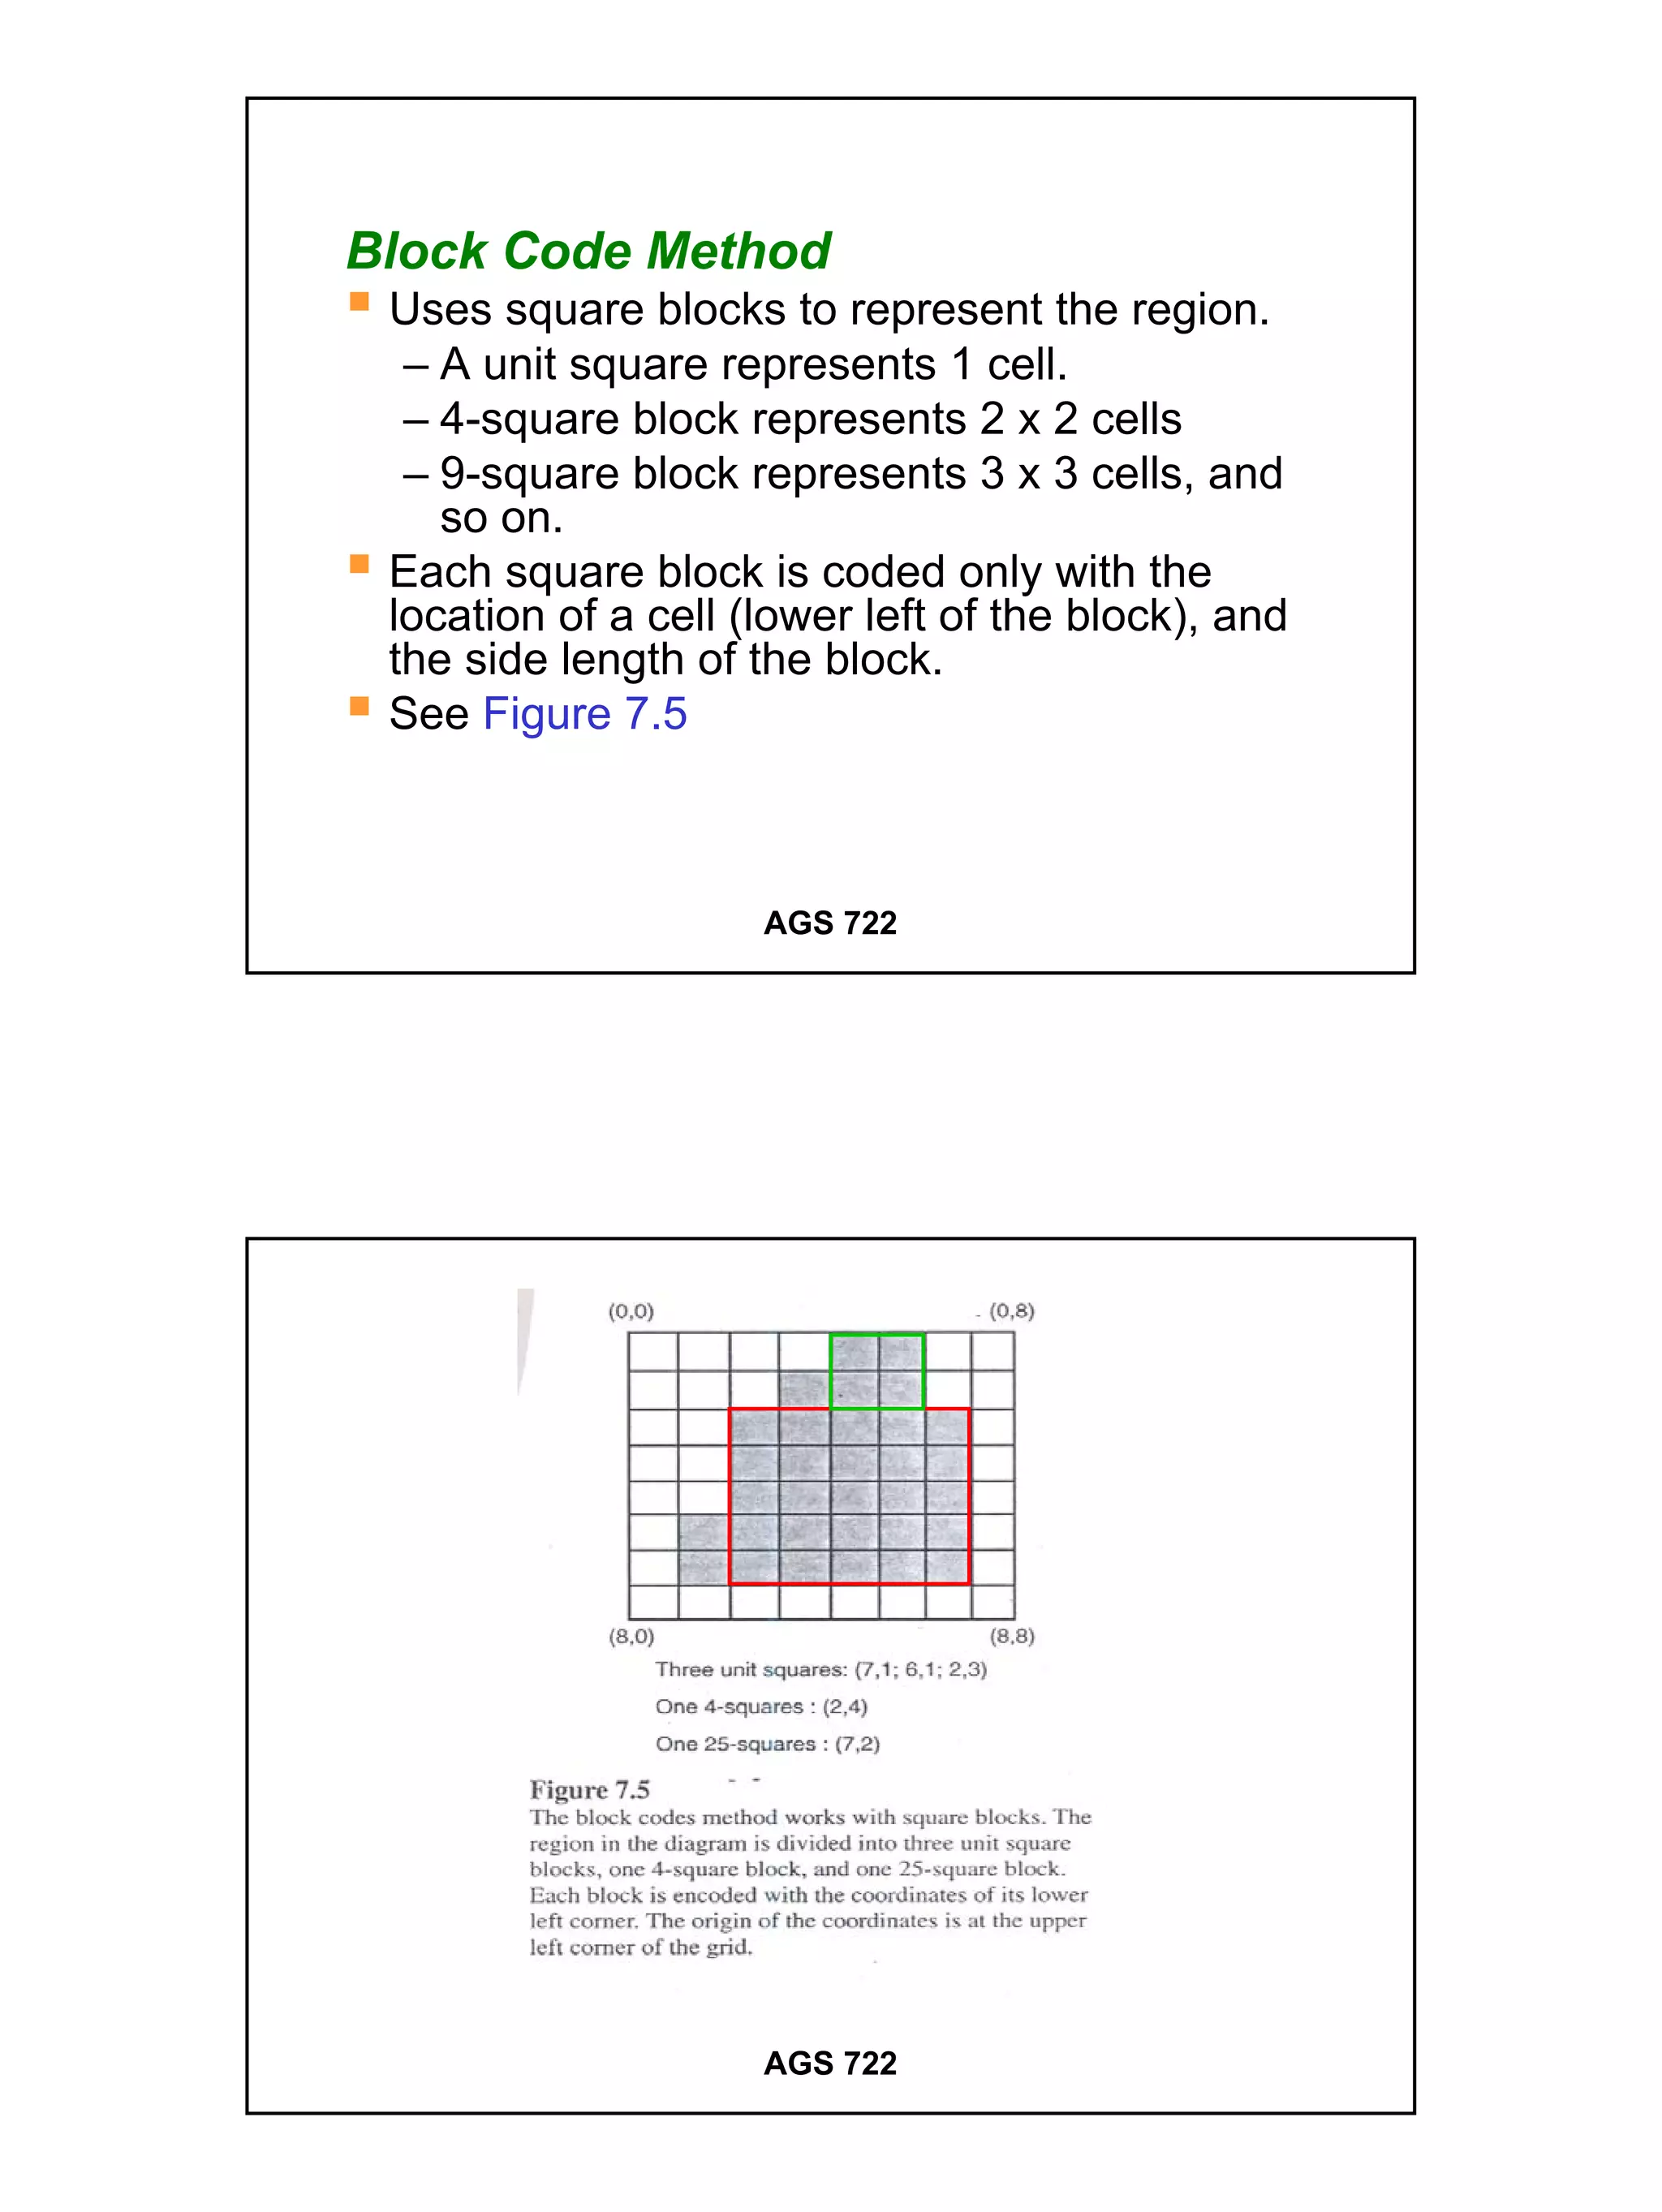
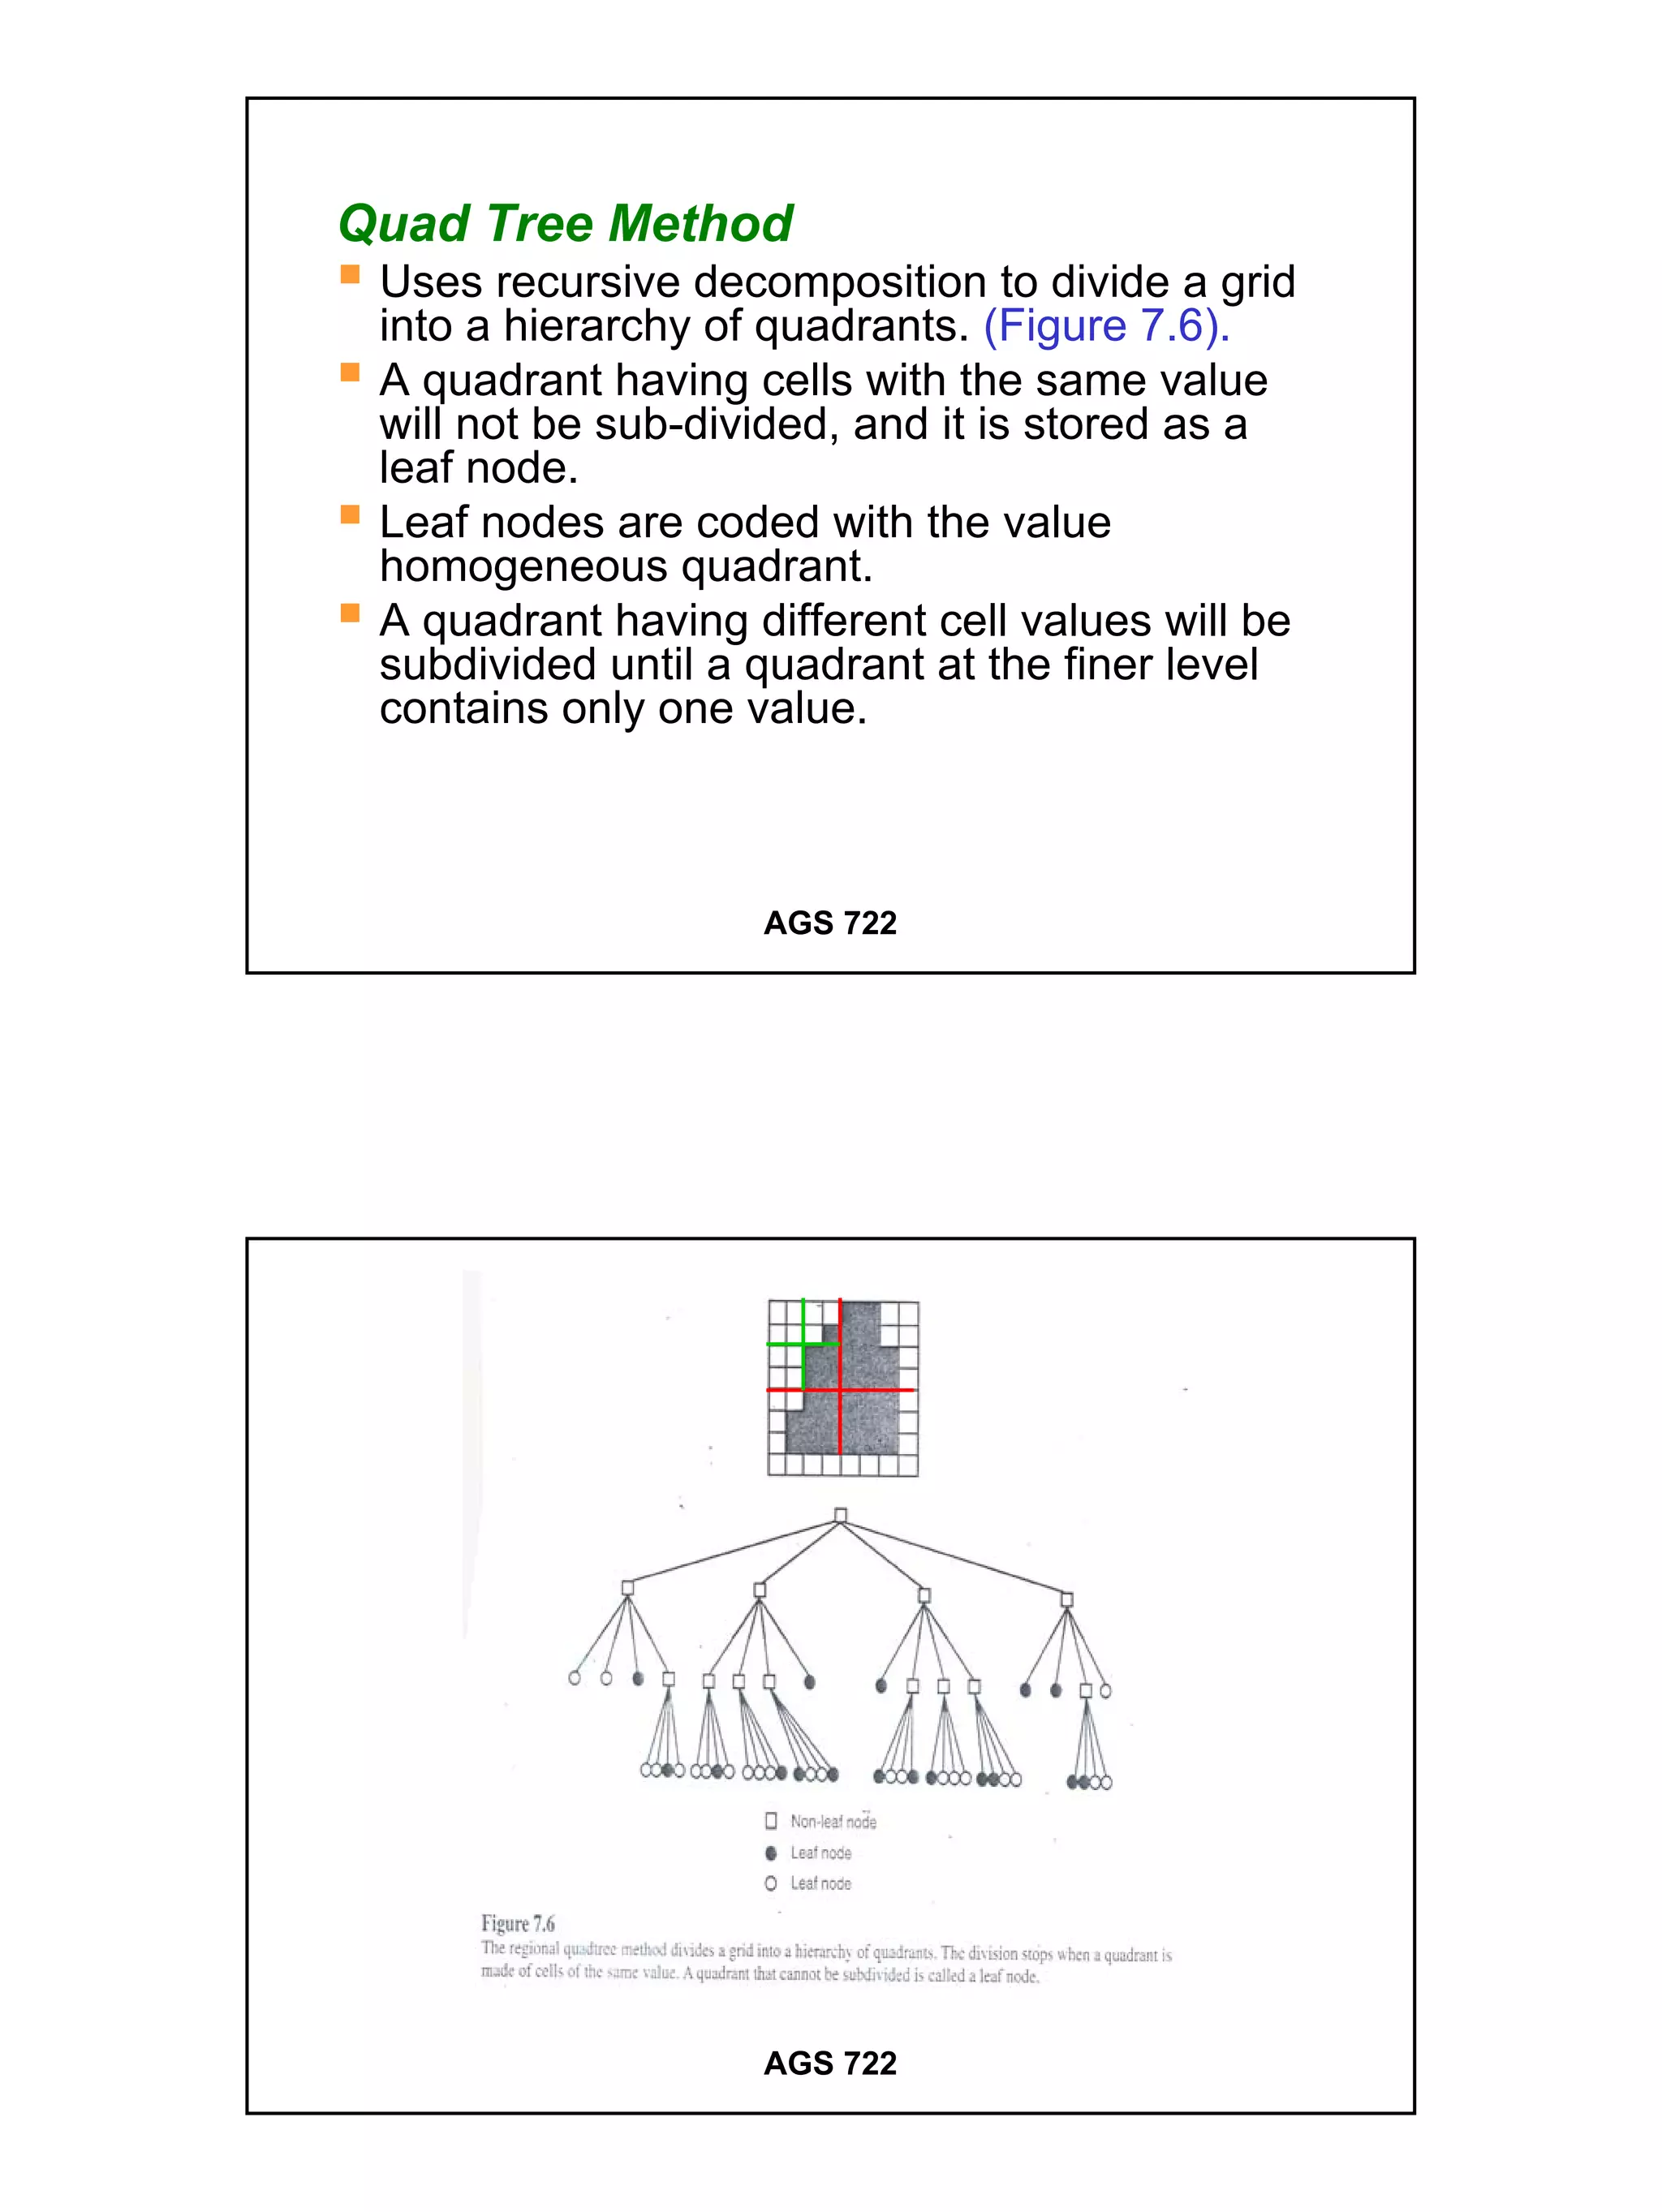
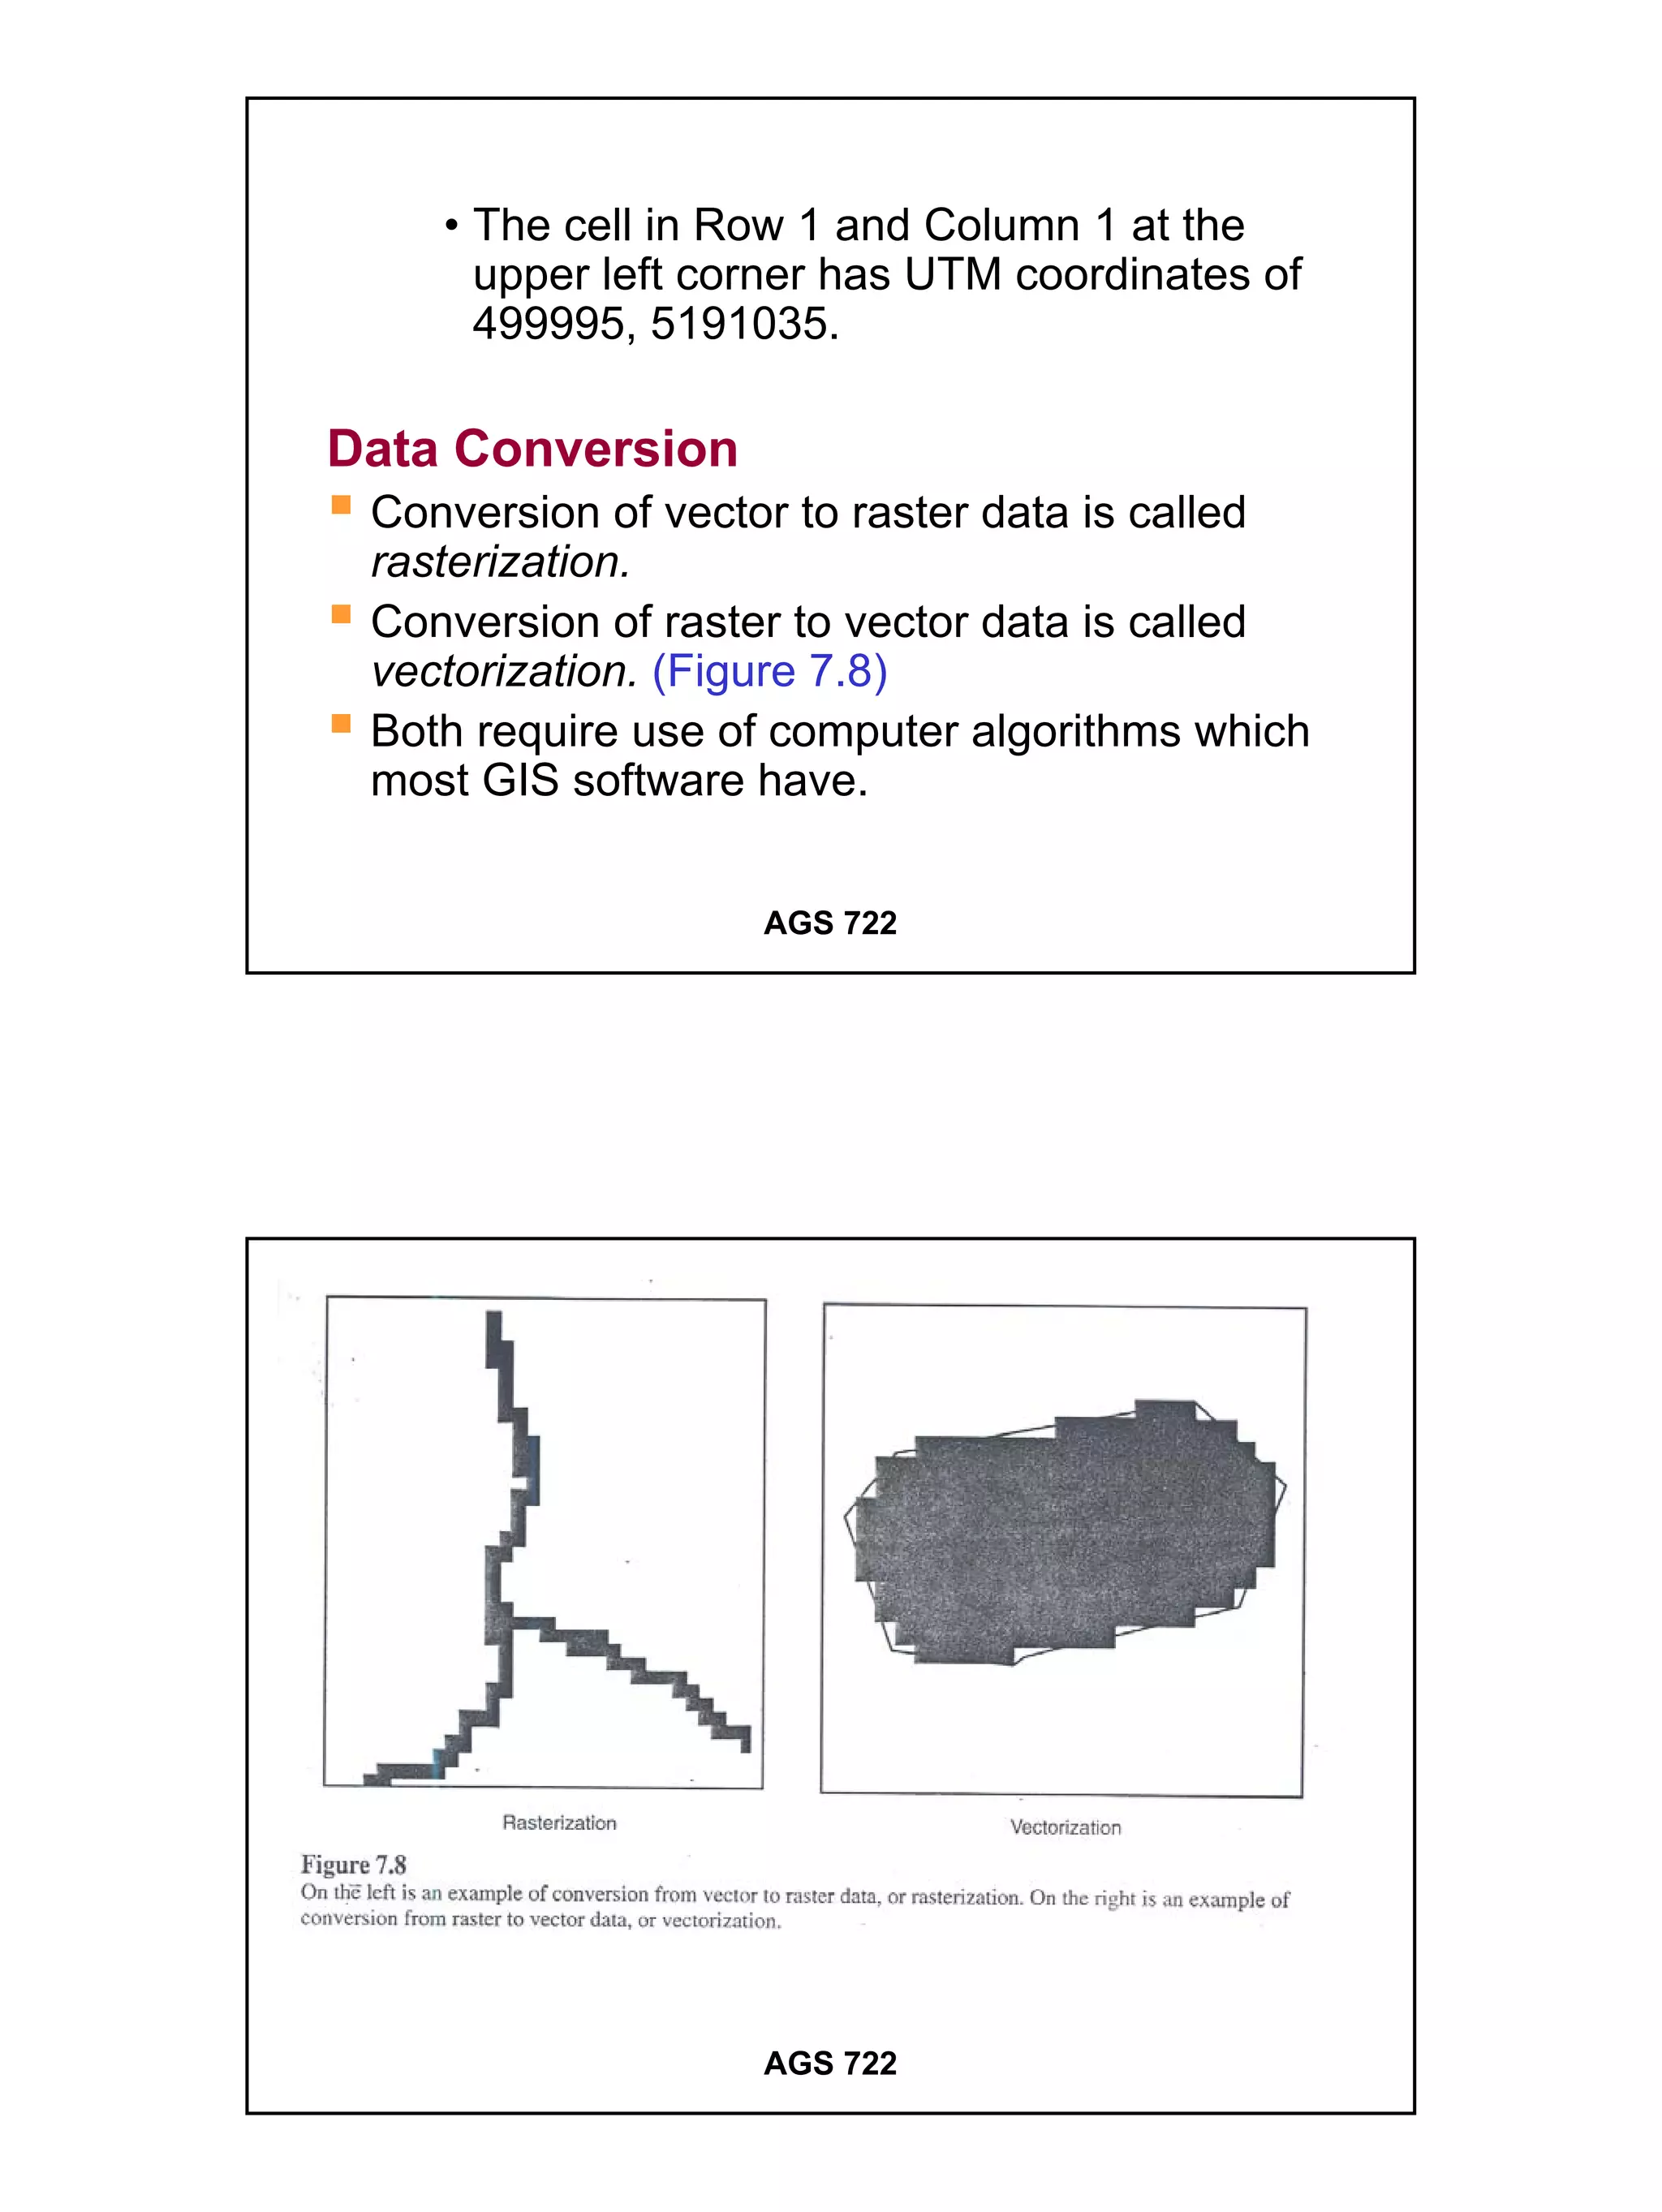

The raster data model divides a geographic area into a grid of cells or pixels that represent attribute values. Each cell has a specific resolution depending on the real world area it represents. Common types of raster data include satellite imagery, digital elevation models (DEMs), digital orthophotos, scanned maps, and graphic files. Raster data is stored using different structures like cell-by-cell encoding, run-length encoding, and quadtree encoding to reduce storage requirements. Raster data can be projected and integrated with vector data for analysis and display in GIS.