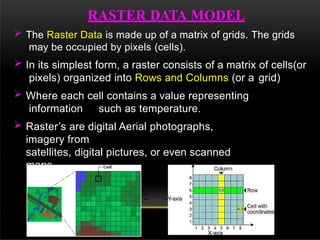
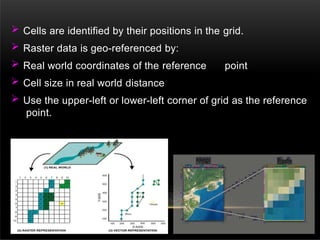
The document provides an overview of the raster data model as part of Geographic Information Systems (GIS), detailing its structure, uses, advantages, and disadvantages. It distinguishes between raster and vector data, explains how raster data is organized in grids of pixels, and discusses various raster data formats, applications like satellite imagery and digital elevation models, and the types of data it can represent. Additionally, the document highlights the importance of raster data in mathematical modeling and quantitative analysis.


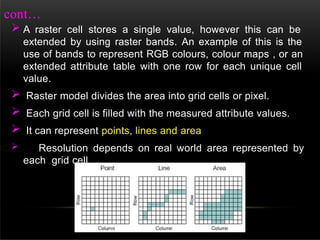
![Reference Frame
'
I
...,
_ ·- ._,
_
-!- ·-
' I
I
.
,
I
I
....}
.
-f F, O - ,
·'
.•
H .
,
. ·1-
1 ,-..
., ,-
-
f
-
t +- - . - J ••
,-.'
!'
t
4
"
1,l
m
1.800
-
'1.82
3
1.lfl4
U1
41
UilJ ;
.. - - -- -- t
1,81
17
2,31
8 :'
:
.
f1-
6
.
.
1 ,S1i'
'1.&l
1,tol 1$16
1 4 11'3
1.927
1.sli
1,B:']6
, 1
l
,
F
i
f
l
3
-
-
1.79
5
r r B
m
.318
1, 94
·™
1.770
.
w
1,10:i
1,7'84
·
1:i'ta
T
3 T m m r .. ·
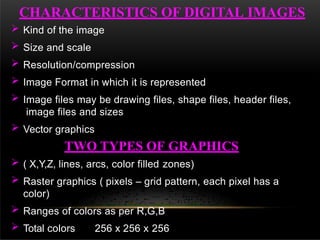
Dat a Values
20 Latt ice
n
oo1
! G r..,t
10, lff i
I Q r8'lt
uoo r"""
'15'0Q
[ ,.,;l
'l]Oi) jQ-,et
11 . , .., ,
aoo
fe,c,!
Jl)or l
oor t
2D Grid
30 Lattice
3D Grid
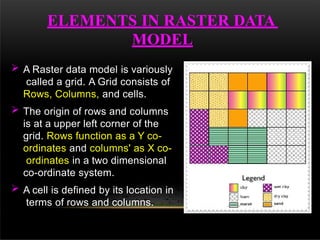
G1
rid- b ased dat,a c.a1
1
1 be displayed ilil 2D/ 3D tattice 0 1
r grid
for ms 7](https://image.slidesharecdn.com/rasterdatamodel-1706061358521-241006160523-ff14fd0b/85/rasterdatamodel-34-320.jpg)