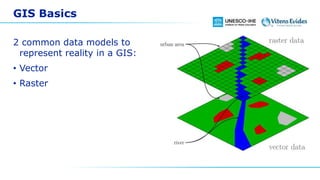
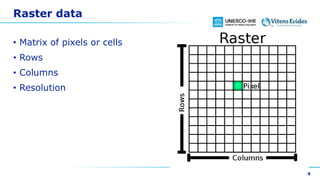
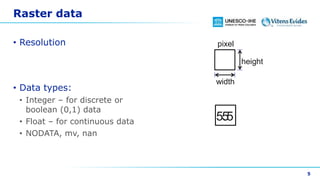
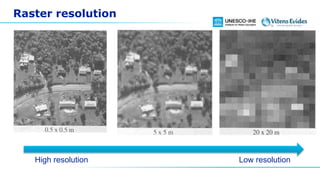
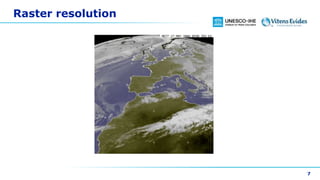
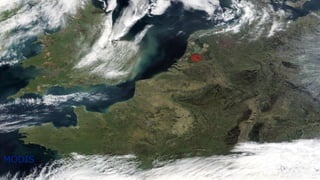
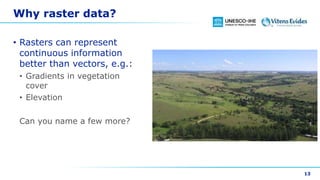
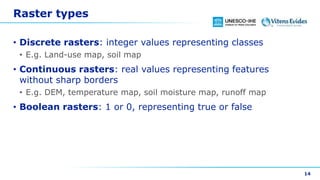
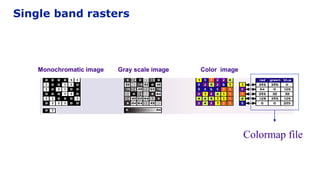
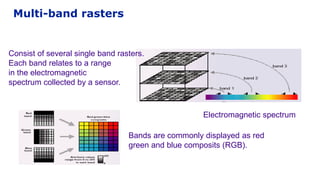
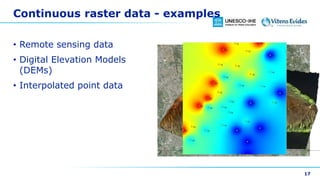
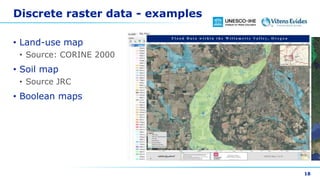
Raster data
Dr. Hans van der Kwast
OpenCourseWare
ocw.unesco-ihe.org
Learning objectives
After this course you are able to:
• Understand what raster data is and how it can be used in
GIS
GIS Basics
2 common data models to
represent reality in a GIS:
• Vector
• Raster
Raster data
• Matrix of pixels or cells
• Rows
• Columns
• Resolution
4
Raster data
• Resolution
• Data types:
• Integer – for discrete or
boolean (0,1) data
• Float – for continuous data
• NODATA, mv, nan
5
pixel
height
width
55.5
Raster resolution
High resolution Low resolution
Raster resolution
7
What is Remote Sensing?RS in een notendop – Opbouw van RS afbeeldingen - Gebruik van False Coilour - Opdracht
MODIS
What is Remote Sensing?RS in een notendop – Opbouw van RS afbeeldingen - Gebruik van False Coilour - Opdracht
ASTER
RS in een notendop – Opbouw van RS afbeeldingen - Gebruik van False Coilour - OpdrachtWhat is Remote Sensing?
IKONOS
What is Remote Sensing?RS in een notendop – Opbouw van RS afbeeldingen - Gebruik van False Coilour - Opdracht
IKONOS
Aerial Photograph
Why raster data?
• Rasters can represent
continuous information
better than vectors, e.g.:
• Gradients in vegetation
cover
• Elevation
Can you name a few more?
13
Raster types
• Discrete rasters: integer values representing classes
• E.g. Land-use map, soil map
• Continuous rasters: real values representing features
without sharp borders
• E.g. DEM, temperature map, soil moisture map, runoff map
• Boolean rasters: 1 or 0, representing true or false
14
Single band rasters
Monochromatic image Gray scale image Color image
Colormap file
Consist of several single band rasters.
Each band relates to a range
in the electromagnetic
spectrum collected by a sensor.
Electromagnetic spectrum
Bands are commonly displayed as red
green and blue composits (RGB).
Multi-band rasters
Continuous raster data - examples
• Remote sensing data
• Digital Elevation Models
(DEMs)
• Interpolated point data
17
Discrete raster data - examples
• Land-use map
• Source: CORINE 2000
• Soil map
• Source JRC
• Boolean maps
18
Vector versus Raster
• Raster data is computationally less expensive to render than vector graphics
• Transparency and aliasing problems when overlaying raster data
• Vector data allows for visually smooth and easy implementation of overlay operations
• Vector data can be easier to register, scale, and re-project
• Vector data is more compatible with relational database environments, where they can
be part of a relational table as a normal column and processed using a multitude of
operators.
• Vector file sizes are usually smaller than raster data, which can be tens, hundreds or
more times larger than vector data
• Vector data is simpler to update and maintain, whereas a raster image will have to be
completely reproduced.
• Vector data allows much more analysis capability, especially for "networks" such as
roads, power, rail, telecommunications, etc.
19

GIS fundamentals - raster

  • 1.
    Raster data Dr. Hansvan der Kwast OpenCourseWare ocw.unesco-ihe.org
  • 2.
    Learning objectives After thiscourse you are able to: • Understand what raster data is and how it can be used in GIS
  • 3.
    GIS Basics 2 commondata models to represent reality in a GIS: • Vector • Raster
  • 4.
    Raster data • Matrixof pixels or cells • Rows • Columns • Resolution 4
  • 5.
    Raster data • Resolution •Data types: • Integer – for discrete or boolean (0,1) data • Float – for continuous data • NODATA, mv, nan 5 pixel height width 55.5
  • 6.
  • 7.
  • 8.
    What is RemoteSensing?RS in een notendop – Opbouw van RS afbeeldingen - Gebruik van False Coilour - Opdracht MODIS
  • 9.
    What is RemoteSensing?RS in een notendop – Opbouw van RS afbeeldingen - Gebruik van False Coilour - Opdracht ASTER
  • 10.
    RS in eennotendop – Opbouw van RS afbeeldingen - Gebruik van False Coilour - OpdrachtWhat is Remote Sensing? IKONOS
  • 11.
    What is RemoteSensing?RS in een notendop – Opbouw van RS afbeeldingen - Gebruik van False Coilour - Opdracht IKONOS
  • 12.
  • 13.
    Why raster data? •Rasters can represent continuous information better than vectors, e.g.: • Gradients in vegetation cover • Elevation Can you name a few more? 13
  • 14.
    Raster types • Discreterasters: integer values representing classes • E.g. Land-use map, soil map • Continuous rasters: real values representing features without sharp borders • E.g. DEM, temperature map, soil moisture map, runoff map • Boolean rasters: 1 or 0, representing true or false 14
  • 15.
    Single band rasters Monochromaticimage Gray scale image Color image Colormap file
  • 16.
    Consist of severalsingle band rasters. Each band relates to a range in the electromagnetic spectrum collected by a sensor. Electromagnetic spectrum Bands are commonly displayed as red green and blue composits (RGB). Multi-band rasters
  • 17.
    Continuous raster data- examples • Remote sensing data • Digital Elevation Models (DEMs) • Interpolated point data 17
  • 18.
    Discrete raster data- examples • Land-use map • Source: CORINE 2000 • Soil map • Source JRC • Boolean maps 18
  • 19.
    Vector versus Raster •Raster data is computationally less expensive to render than vector graphics • Transparency and aliasing problems when overlaying raster data • Vector data allows for visually smooth and easy implementation of overlay operations • Vector data can be easier to register, scale, and re-project • Vector data is more compatible with relational database environments, where they can be part of a relational table as a normal column and processed using a multitude of operators. • Vector file sizes are usually smaller than raster data, which can be tens, hundreds or more times larger than vector data • Vector data is simpler to update and maintain, whereas a raster image will have to be completely reproduced. • Vector data allows much more analysis capability, especially for "networks" such as roads, power, rail, telecommunications, etc. 19