Downloaded 284 times

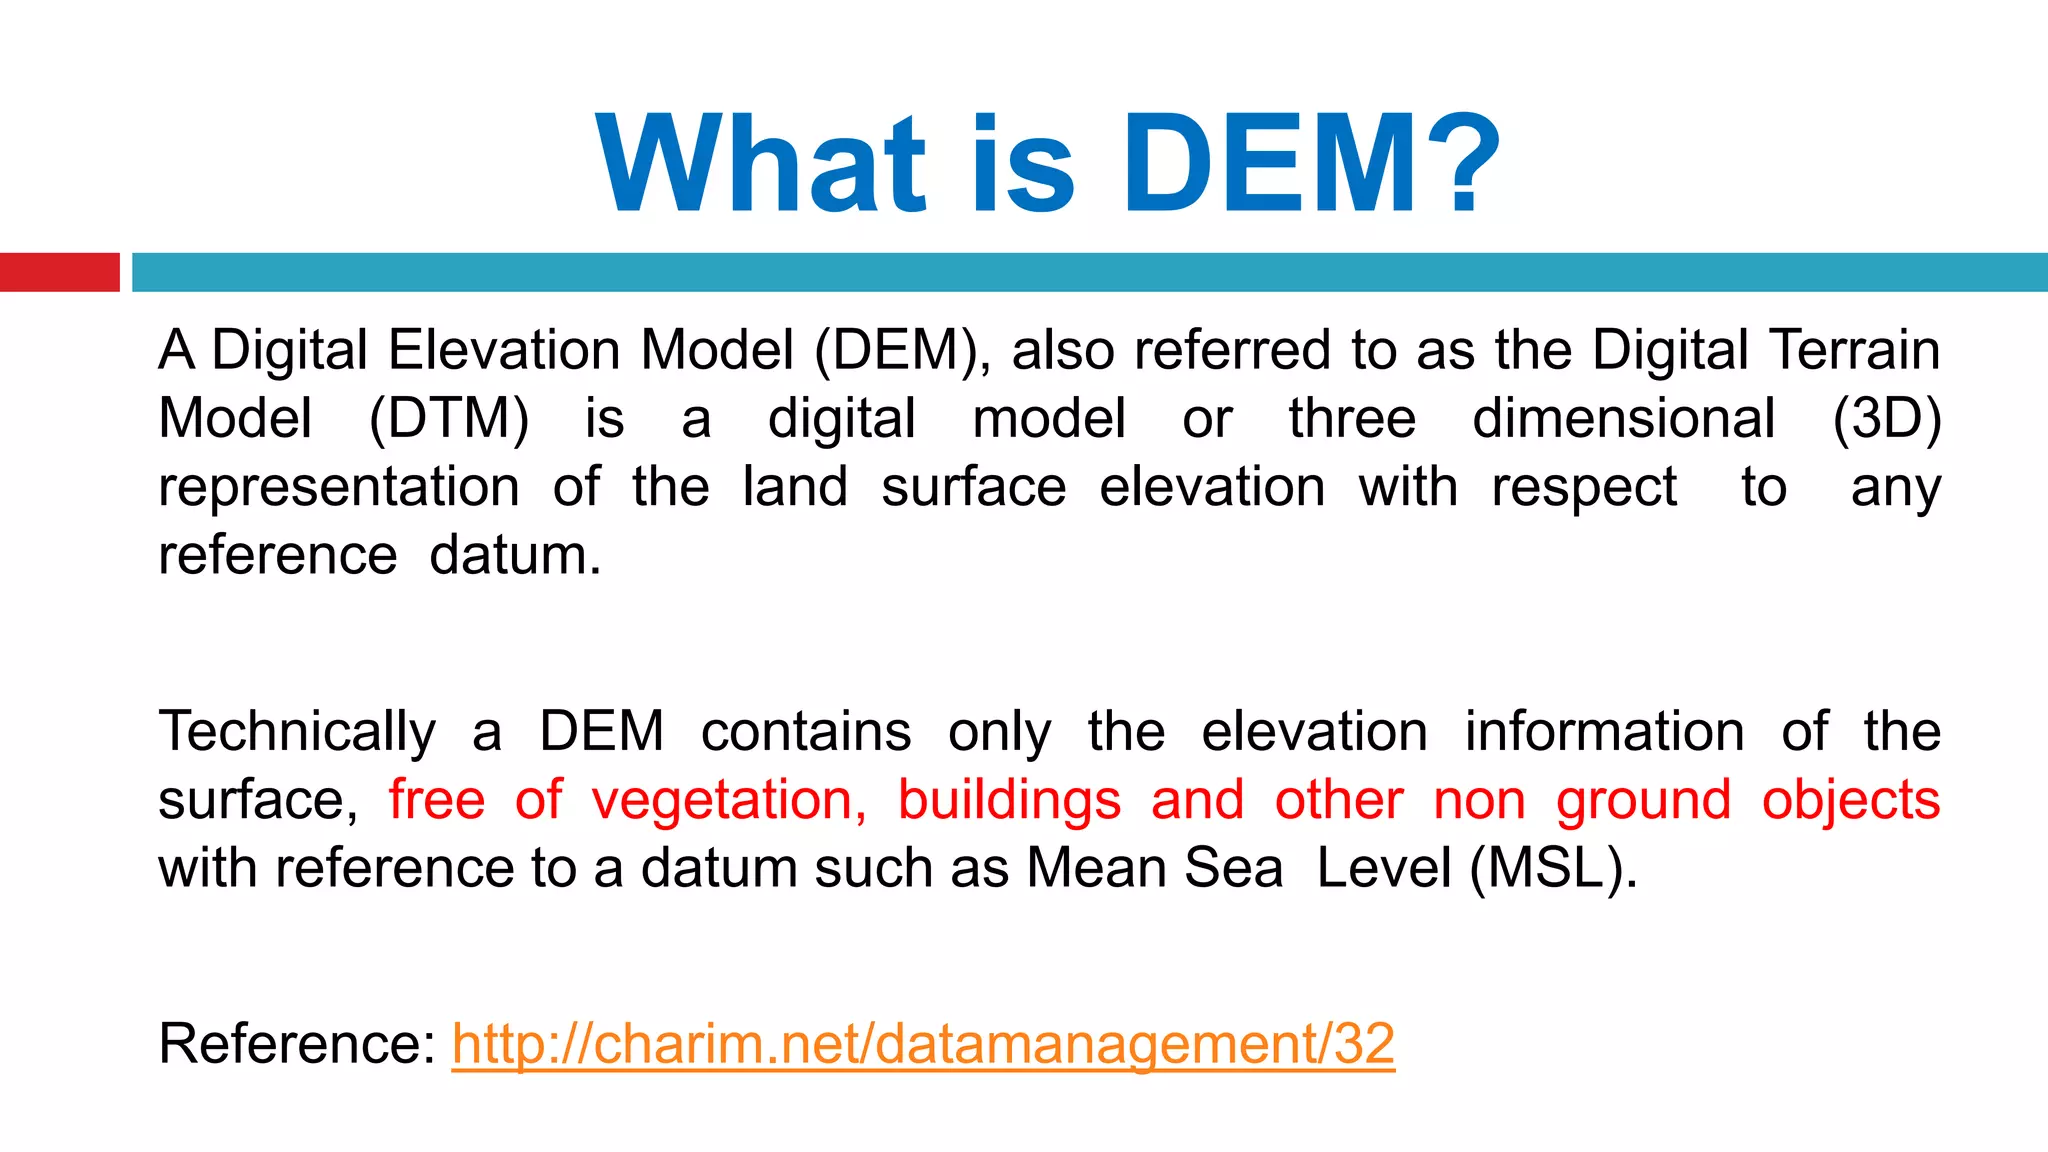

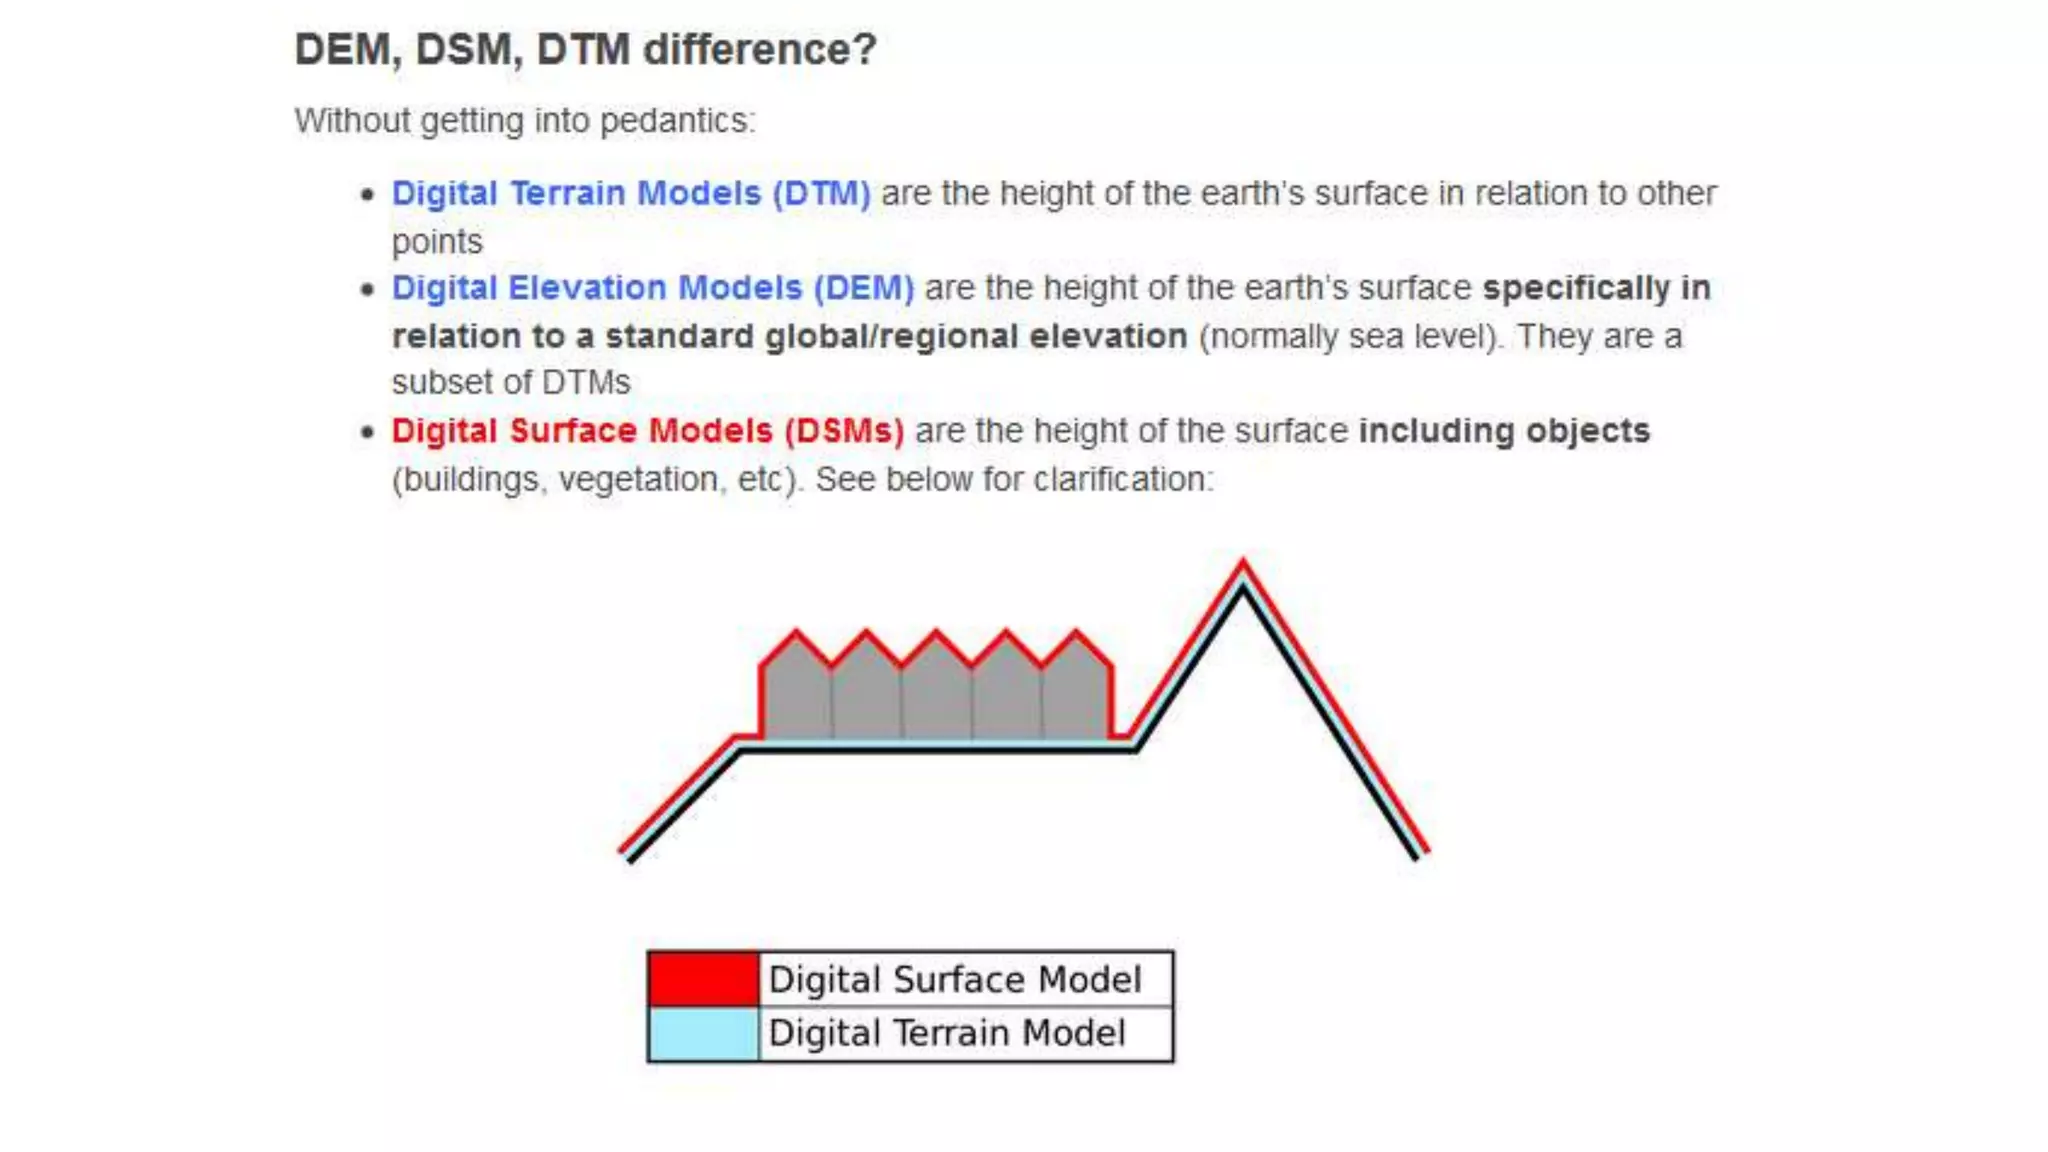


This document defines and describes Digital Elevation Models (DEMs). It discusses that DEMs are 3D representations of land surface elevation from various data sources. There are two main types of DEMs - raster and vector (TIN). Data can be captured through remote sensing, photogrammetry, or land surveys. Free global DEMs are available from sources like SRTM, ASTER, and ALOS. DEMs have many applications including terrain analysis, hydrology, mapping, and more.