Downloaded 685 times

![DIFFERENCE BETWEEN VECTOR AND
RASTER DATA MODEL
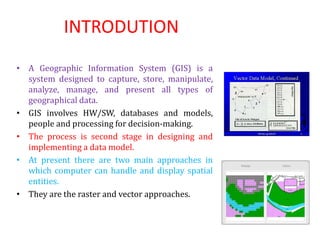
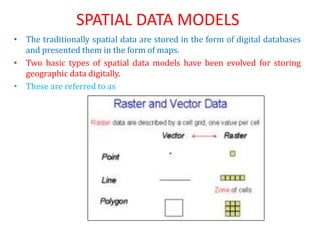
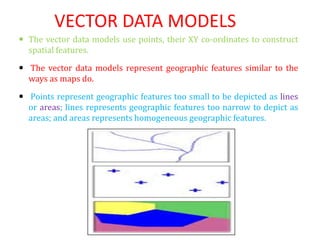
• Vector Data Model: [data models] A representation of the world using
points, lines, and polygons. Vector models are useful for storing data
that has discrete boundaries, such as country borders, land parcels,
and streets.
• Raster Data Model: [data models] A representation of the world as a
surface divided into a regular grid of cells. Raster models are useful for
storing data that varies continuously, as in an aerial photograph, a
satellite image, a surface of chemical concentrations, or an elevation
surface.
• Both vector and raster data constitute of "latitudes and longitudes",
only. The difference is in the way they are displayed.
• Latitudes and Longitudes in Vector data are displayed in the form of
lines, points, etc.
• Latitudes and Longitudes in Raster data are displayed in the form of
closed shapes where each pixel has a particular latitude and longitude
associated with it.](https://image.slidesharecdn.com/vectordatamodelfinall-170606135659/85/Vector-data-model-11-320.jpg)


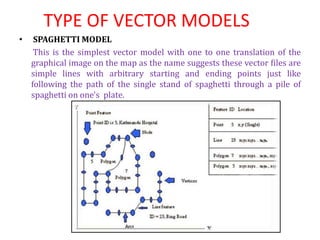
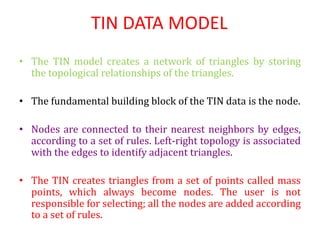
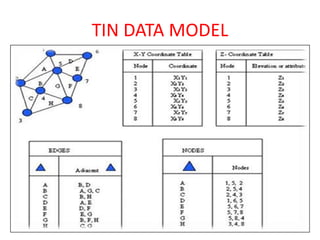
The document discusses vector data models in GIS. Vector data models represent geographic features using points, lines, and polygons. The key vector data models are the spaghetti model, which encodes features as strings of coordinates, and the TIN (triangulated irregular network) model, which creates a network of triangles connecting points. Vector models allow for discrete boundaries but complex algorithms, while raster models divide space into a grid but are simpler.