Download as PDF, PPTX


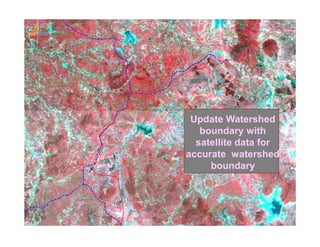

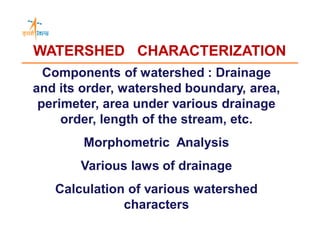


This document discusses remote sensing and GIS applications for watershed management. It describes how remote sensing can be used to characterize watersheds by mapping attributes like size, shape, drainage patterns, geology, soil, land use, and groundwater potential. Remote sensing data can be integrated with socioeconomic data and used to delineate watershed boundaries, prioritize watersheds for development, and generate action plans. The document also outlines steps for watershed demarcation, characterization using tools like GEOMORIS, and prioritization using methods such as the sediment yield index.