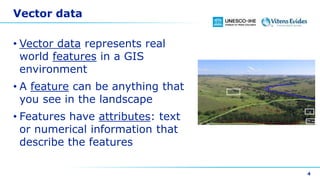
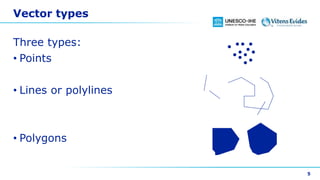
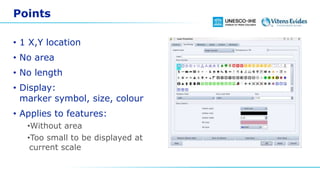
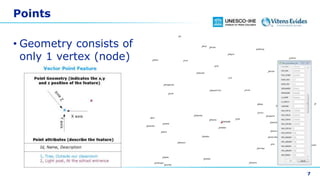
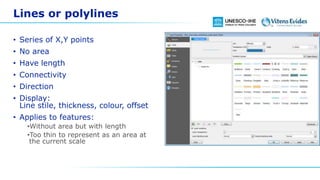
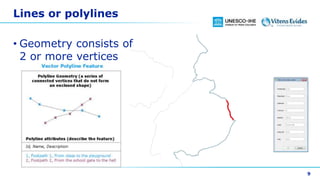
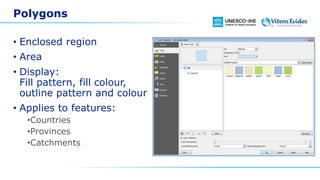
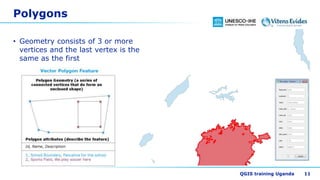
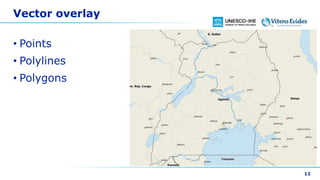
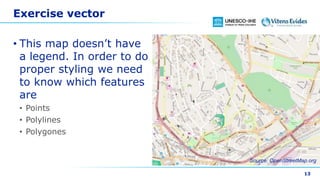
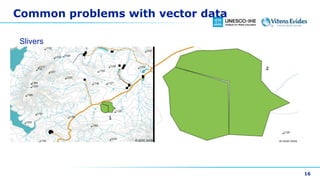
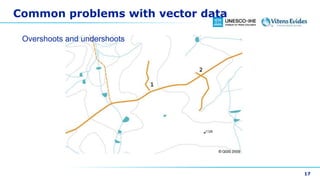
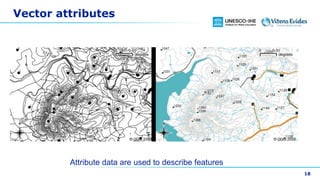
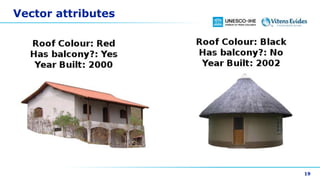
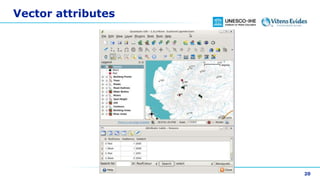
This document discusses vector data in GIS. It begins by defining vector data as representing real-world features using points, lines, and polygons. It then describes the three vector types - points as single X,Y coordinates with no area or length, lines/polylines as a series of points with length but no area, and polygons as enclosed areas formed by connecting three or more points. The document provides examples of each vector type and how they can represent different landscape features. It also discusses attributes associated with vector data, common problems like slivers and overshoots/undershoots, and how vector data can be queried and symbolized based on attributes.
Geographical Information System (GIS) Georeferencing and Digitization, Bihar ...Kamlesh Kumar
This work is an effort to share Geographical Information System: Georeferencing, digitization and map making steps through QGIS 2.0.1
Georeferencing
Digitization of Topographical sheet
Point
Line
Area
Bihar Map
District Headquarters
Railway of Bihar
District Boundaries
Thematic Maps (Literacy & Sex Ratio)
The advantage of digital imagery is that it allows us to manipulate the digital pixel values in the image. Even after the radiometric corrections image may still not be optimized for visual interpretation. An image 'enhancement' is basically anything that makes it easier or better to visually interpret. An enhancement is performed for a specific application as well. This enhancement may be inappropriate for another purpose, which would demand a different type of enhancement.
Filtering is used to enhance the appearance of an image. Spatial filters are designed to highlight or suppress specific features in an image based on their spatial frequency. ‘Rough’ textured areas of an image, where the changes in tone are abrupt, have high spatial frequencies, while ‘smooth’ areas with little variation have low spatial frequencies. A common filtering procedure involves moving a ‘matrix' of a few pixels in dimension (ie. 3x3, 5x5, etc.) over each pixel in the image, using mathematical calculation and replacing the central pixel with the new value.
A low-pass filter is designed to emphasize larger, homogeneous areas of similar tone and reduce the smaller detail in an image. Thus, low-pass filters generally serve to smooth the appearance of an image. In some cases, like 'low-pass filtering', the enhanced image can actually look worse than the original, but such an enhancement was likely performed to help the interpreter see low spatial frequency features among the usual high frequency clutter found in an image. High-pass filters do the opposite and serve to sharpen the appearance of fine detail in an image. Directional, or edge detection filters are designed to highlight linear features, such as roads or field boundaries. These filters can also be designed to enhance features which are oriented in specific directions.
THIS PRESENTATION IS TO HELP YOU PERFORM THE TASK STEP BY STEP.
Prepared as part of the IT for Business Intelligence course of MBA @VGSOM, IIT Kharagpur. The tutorial describes how to represent vector data on a map using the open source software QGIS.
Advantages and Disadvantages of video marketingClifford Petry
With every marketing method, there is a weakness. It’s good to be aware of these. No matter how good video marketing might initially sound to you, it might not necessarily be right for your business. Here are the top three advantages and disadvantages of video marketing.
A geographic information system (GIS) is a system designed to capture, store, manipulate, analyze, manage, and present all types of geographical data. The acronym GIS is sometimes used for geographical information science or geospatial information studies to refer to the academic discipline or career of working with geographic information systems and is a large domain within the broader academic discipline of Geoinformatics. In the simplest terms, GIS is the merging of cartography, statistical analysis, and computer science technology.
This is presentation is intended for middle school students. It provides a short introduction to GIS and how to use GIS in the real-world.
ArcGIS Explorer is the software used to demonstrate concepts.
45 minutes + 15 minutes demo
Download ArcGIS Explorer here...
http://www.esri.com/software/arcgis/explorer/
Big Data and Geospatial with HPCC SystemsHPCC Systems
This presentation covers one topic that we have mastered after several years : Geospatial.
We will reveal how we deal with very specific spatial challenges in our day to day use cases :
• Answer questions combining the best of BigData and geospatial analysis.
• Ingestion and use of raster and vector data with our Massive Parallel Processing platform (Thor).
• Store and query spatial information with sub-second queries, using our data refinery (Roxie)
And much more under the umbrella of LexisNexis HPCC Systems (High Performance Computing Cluster), an open source platform for Big Data processing and analytics.
Advanced Web-Based Geospatial Visualization using Leaflet HumanGeo Group
In Intel Analytic DC's first meetup, Danny Holloway presented a tool that allows users to find and map the latest tweets in Australia using Leaflet, TileMill, MongoDB, and other technologies. Given the audience interest in geospatial technologies/analytics and web-based mapping, this presentation introduces and provides examples using the HumanGeo Data Visualization Framework, a soon to be released open source JavaScript framework based on CloudMade's Leaflet web-mapping framework. The goal of the Data Visualization Framework is to provide a core set of capabilities for visualizing data using Leaflet while simplifying common tasks and reducing the amount of code that developers need to write in order to create compelling geospatial visualizations.
Using Deep Learning to Derive 3D Cities from Satellite ImageryAstraea, Inc.
Detection and reconstruction of 3D buildings in urban areas has been a hot topic of research due to its many applications, including 3D population density studies, emergency planning, and building value estimation. Standard approaches to extract building footprint and measure building height rely on either aerial or space borne point cloud data, which in many areas is unavailable. In contrast, high resolution satellite imagery has become more readily available in recent years, and could provide enough information to estimate a building’s height. Recent successes of deep learning on semantic segmentation have shown that convolutional neural networks can be effective tools at extracting 2D building footprints. Using a digital surface model derived using FOSS and LiDAR data as ground truth, this study goes a step further by employing state of the art deep learning architectures such as U-net to infer both building footprints and estimated building heights in one pass from a single satellite image. This application of open deep learning frameworks can bring the benefits of 3D cities to a larger portion of the world.
Workshop at the Information Experience Design programme at RCA.
The blurb:
"Till Nagel will introduce his Unfolding Map library for Processing to create geospatial data visualizations. Participants will learn how to find and use urban data sets, how to load and display them, and how to design simple visualizations. It will be a very hands-on and interactive workshop. All participants should bring their own computer with Processing installed."
Map box styles in GeoServer and OpenLayersJody Garnett
The GeoServer and OpenLayers teams at Boundless are working hard to implement direct native support for MapBox styles. Using the same configuration for client and server styling is a wonderful improvement providing a consistent visual presentation.
MapBox style provides a capability for styling maps with an easy to read JSON format. For OpenLayers this is a significant development as it allows the library to be configured using JSON files, rather than hand building JavaScript objects for each layer. For GeoServer the use of JSON is far easier than the raw XML used by the OGC Styled Layer Descriptor language.
This presentation provides a quick introduction to the visual concepts presented by MapBox style, before switching gears to focus on how they have been implemented by the OpenLayers and GeoServer projects:
OpenLayers provides an amazing hi-def experience on today’s screens and mobile devices. This presentation digs into how this experience has been achieved, what capabilities are supported, and what we are excited to work on next.
For GeoServer you can see how many MapBox style features are now available (and review what control you are giving up by choosing this portable standard).
This presentations provides a good visual comparison of client and server side rendering using identical styling configuration.
To celebrate FOSS4G this is a FOSS4G technical presentation and we will be happy to take questions, demonstrate live examples, explore the implementation challenges, and talk about our lessons learned. We are excited to introduce these capabilities to the community, providing users and developers with an easier and more flexible way to style their maps.
Unit 8 - Information and Communication Technology (Paper I).pdfThiyagu K
This slides describes the basic concepts of ICT, basics of Email, Emerging Technology and Digital Initiatives in Education. This presentations aligns with the UGC Paper I syllabus.
Acetabularia Information For Class 9 .docxvaibhavrinwa19
Acetabularia acetabulum is a single-celled green alga that in its vegetative state is morphologically differentiated into a basal rhizoid and an axially elongated stalk, which bears whorls of branching hairs. The single diploid nucleus resides in the rhizoid.
June 3, 2024 Anti-Semitism Letter Sent to MIT President Kornbluth and MIT Cor...Levi Shapiro
Letter from the Congress of the United States regarding Anti-Semitism sent June 3rd to MIT President Sally Kornbluth, MIT Corp Chair, Mark Gorenberg
Dear Dr. Kornbluth and Mr. Gorenberg,
The US House of Representatives is deeply concerned by ongoing and pervasive acts of antisemitic
harassment and intimidation at the Massachusetts Institute of Technology (MIT). Failing to act decisively to ensure a safe learning environment for all students would be a grave dereliction of your responsibilities as President of MIT and Chair of the MIT Corporation.
This Congress will not stand idly by and allow an environment hostile to Jewish students to persist. The House believes that your institution is in violation of Title VI of the Civil Rights Act, and the inability or
unwillingness to rectify this violation through action requires accountability.
Postsecondary education is a unique opportunity for students to learn and have their ideas and beliefs challenged. However, universities receiving hundreds of millions of federal funds annually have denied
students that opportunity and have been hijacked to become venues for the promotion of terrorism, antisemitic harassment and intimidation, unlawful encampments, and in some cases, assaults and riots.
The House of Representatives will not countenance the use of federal funds to indoctrinate students into hateful, antisemitic, anti-American supporters of terrorism. Investigations into campus antisemitism by the Committee on Education and the Workforce and the Committee on Ways and Means have been expanded into a Congress-wide probe across all relevant jurisdictions to address this national crisis. The undersigned Committees will conduct oversight into the use of federal funds at MIT and its learning environment under authorities granted to each Committee.
• The Committee on Education and the Workforce has been investigating your institution since December 7, 2023. The Committee has broad jurisdiction over postsecondary education, including its compliance with Title VI of the Civil Rights Act, campus safety concerns over disruptions to the learning environment, and the awarding of federal student aid under the Higher Education Act.
• The Committee on Oversight and Accountability is investigating the sources of funding and other support flowing to groups espousing pro-Hamas propaganda and engaged in antisemitic harassment and intimidation of students. The Committee on Oversight and Accountability is the principal oversight committee of the US House of Representatives and has broad authority to investigate “any matter” at “any time” under House Rule X.
• The Committee on Ways and Means has been investigating several universities since November 15, 2023, when the Committee held a hearing entitled From Ivory Towers to Dark Corners: Investigating the Nexus Between Antisemitism, Tax-Exempt Universities, and Terror Financing. The Committee followed the hearing with letters to those institutions on January 10, 202
Honest Reviews of Tim Han LMA Course Program.pptxtimhan337
Personal development courses are widely available today, with each one promising life-changing outcomes. Tim Han’s Life Mastery Achievers (LMA) Course has drawn a lot of interest. In addition to offering my frank assessment of Success Insider’s LMA Course, this piece examines the course’s effects via a variety of Tim Han LMA course reviews and Success Insider comments.
Synthetic Fiber Construction in lab .pptxPavel ( NSTU)
Synthetic fiber production is a fascinating and complex field that blends chemistry, engineering, and environmental science. By understanding these aspects, students can gain a comprehensive view of synthetic fiber production, its impact on society and the environment, and the potential for future innovations. Synthetic fibers play a crucial role in modern society, impacting various aspects of daily life, industry, and the environment. ynthetic fibers are integral to modern life, offering a range of benefits from cost-effectiveness and versatility to innovative applications and performance characteristics. While they pose environmental challenges, ongoing research and development aim to create more sustainable and eco-friendly alternatives. Understanding the importance of synthetic fibers helps in appreciating their role in the economy, industry, and daily life, while also emphasizing the need for sustainable practices and innovation.
The French Revolution, which began in 1789, was a period of radical social and political upheaval in France. It marked the decline of absolute monarchies, the rise of secular and democratic republics, and the eventual rise of Napoleon Bonaparte. This revolutionary period is crucial in understanding the transition from feudalism to modernity in Europe.
For more information, visit-www.vavaclasses.com
3. GIS Basics
2 common data models
to represent reality in a
GIS:
• Vector
• Raster
4. Vector data
• Vector data represents real
world features in a GIS
environment
• A feature can be anything that
you see in the landscape
• Features have attributes: text
or numerical information that
describe the features
4
6. Points
• 1 X,Y location
• No area
• No length
• Display:
marker symbol, size, colour
• Applies to features:
•Without area
•Too small to be displayed at
current scale
8. Lines or polylines
• Series of X,Y points
• No area
• Have length
• Connectivity
• Direction
• Display:
Line stile, thickness, colour, offset
• Applies to features:
•Without area but with length
•Too thin to represent as an area at
the current scale
10. Polygons
• Enclosed region
• Area
• Display:
Fill pattern, fill colour,
outline pattern and colour
• Applies to features:
•Countries
•Provinces
•Catchments
11. Polygons
• Geometry consists of 3 or more
vertices and the last vertex is the
same as the first
QGIS training Uganda 11
13. Exercise vector
13
• This map doesn’t have
a legend. In order to do
proper styling we need
to know which features
are
• Points
• Polylines
• Polygones
Source: OpenStreetMap.org
14. What can we do with vector data?
• Spatial queries, e.g.:
• Which houses are within the 100 year flood level of a river?
• Where is the best place to put a hospital so that it is easily
accessible to as many people as possible?
• Which learners live in a particular suburb?
14
15. Common problems with vector data
• Accuracy of vectors depend on scale of digitizing
15
Digitized from 1/1000000 map Digitized from 1/50000 map
23. Attributes in detail
Attribute
Table
Field 1 :
YearBuilt
Field 2:
RoofColour
Field 3:
Balcony
Record 1 1998 Red Yes
Record 2 2000 Black No
Record 3 2001 Silver Yes
23
Fields represent properties of the feature.
Can you think of other attributes that we can connect to houses?