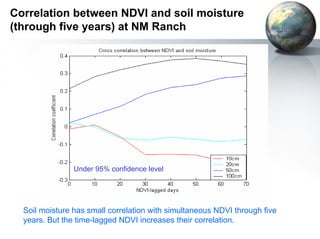
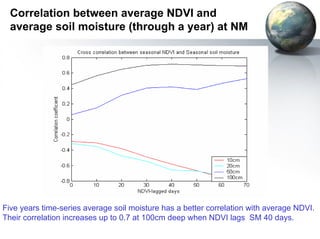
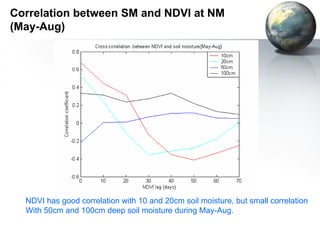
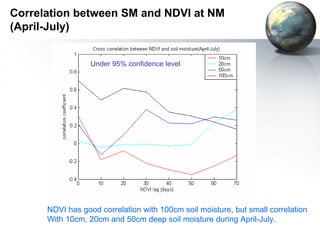
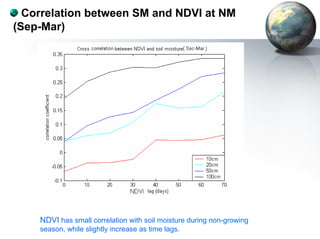
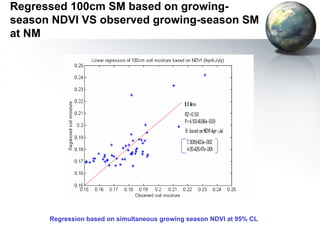
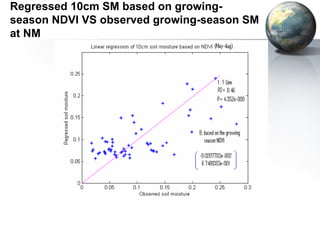
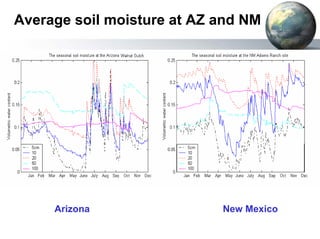
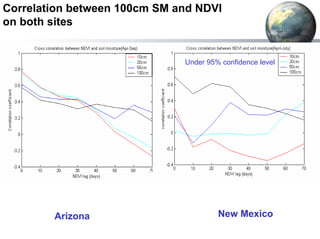
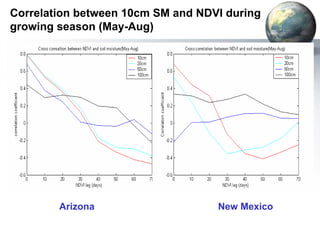
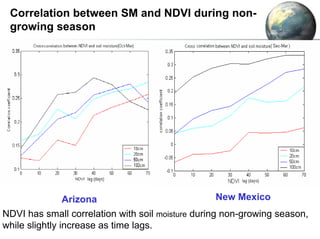
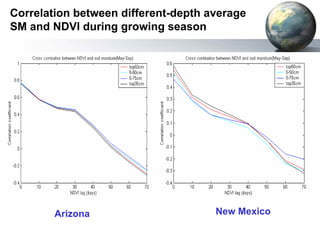
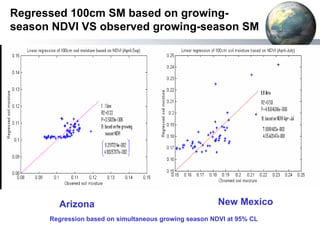
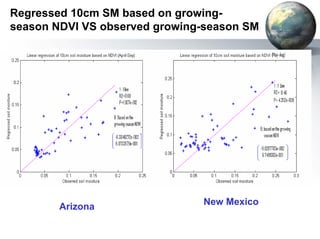
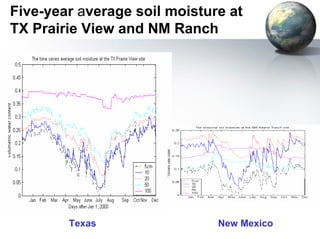
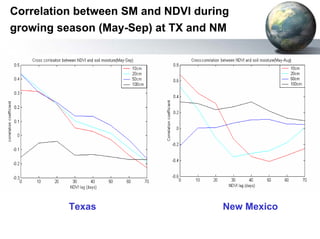
The document analyzes the relationship between ground-based soil moisture measurements from the Soil Climate Analysis Network (SCAN) and satellite-derived NDVI values from MODIS. It finds moderate to good correlation between deeper soil moisture (50-100cm) and NDVI during growing seasons in semi-arid regions, allowing estimation of deeper moisture from NDVI. Root zone soil moisture in humid regions also correlates with NDVI to allow estimation. Deeper moisture in humid areas shows little correlation with NDVI. No strong correlation is found between soil moisture and NDVI during non-growing seasons.
Linking the Quasi-Biennial Oscillation and Projected Arctic Sea-Ice Loss to S...Zachary Labe
20th Conference on Middle Atmosphere at the 99th Annual Meeting of the American Meteorological Society (abstract: https://ams.confex.com/ams/2019Annual/meetingapp.cgi/Paper/352664)
Poster showcasing preliminary results of thesis work at Southeastern Division of the Association of American Geographers (SEDAAG), November 2016. I was awarded Best Graduate Honors poster.
The need for new theory in global dendroclimatologyScott St. George
So much of what we know about the Earth’s climate during the past two millennia comes from tree rings. Information gleaned from the physical or chemical properties of growth rings in trees have allowed us to extend hemispheric-scale temperature records back by several centuries, construct annual maps of drought severity that span several continents, and generate proxy estimates for many of the leading modes within the climate system. The theoretical foundation that underpins these products — and most others in dendroclimatology — was fully mature by the early 1990s and set out in detail by Cook and Kairiukstis in their seminal book, ‘Methods in Dendrochronology’. Most of the core analytical methods used to infer past climate from tree rings that appear in this reference (as well as prior works) depend on two concepts in particular: first, the idea that patterns common to many trees at many sites are more likely to be related to synoptic-scale climate variability (the principle of replication), and second, the notion that the most useful tree-ring records are found in forests where growth is particularly sensitive to a specific aspect of local climate (the principle of site selection). But because of (i) the gradual expansion, extension, and in-filling of the global tree-ring network and (ii) the emphasis given to atypical or even unique site-specific signals by some novel reconstruction methods, it is a point of debate within our community, at least implicitly, whether these principles remain valid. This presentation will review several recent studies that illustrate the possible advantages offered by a disregard for the usual ‘rules’ of dendroclimatology but will also discuss the potential pitfalls of placing too much emphasis on apparently optimal records. We hope this talk will encourage the sharing of ideas on how best to extract climate information from the ever-expanding network of tree-ring records across our planet and help open a discussion on the relevance of our standard theoretical framework to contemporary global dendroclimatology.
A new framework to test the origins of western American megadroughtScott St. George
We know from tree rings and other natural drought records that the western United States has been affected by several 'megadroughts' during the past millennium. But are these exceptionally long-lasting droughts due to unusual external forcings, or are they inevitable given a sufficiently long period of time? Here we present a statistical model that combines sea surface temperature records and drought severity statistics from the western USA, and use that tool to set out an expectation for megadrought, given no other changes in the climate system. Even though this model was trained using only modern climate data (and incorporates no information from tree rings or other proxies), it still produced megadroughts. Moreover, those simulated megadroughts were just as long-lasting, covered as large an area, and were just as severe as real megadroughts estimated from tree rings. That result means that megadroughts can occur in the western United States even if nothing else changes in the climate -- they really are just a matter of time. On the other hand, the only aspect of real-world megadroughts that the model cannot duplicate was the high number of these events during the so-called Medieval Climate Anomaly (800 to 1300 CE). So that cluster of megadroughts may have been caused by some sort of unusual climate circumstances that have not been observed by us during the past few decades. The proxy record tells us that many different kinds of exceptional or unusual climate events happened in the past. But it is often difficult to determine what caused those exceptional events because even, within a period of a thousand years, we still have very few cases. So besides being an aid to understand the causes of past megadroughts, we hope this approach can be applied to other paleoclimate records to distinguish between real interrelations between separate components of the climate system and simple coincidences.
Paper - Landscape Change Over 60 Years Surrounding Cedarburg BogJason Schroeder
This article describes my project to classify historical land use of the Cedarburg Bog. I worked on this as a student at the University of Wisconsin-Milwaukee.
Satellite passive microwave measurements of the climate crisisChelle Gentemann
Invited presentation at the NASEM Committee on Radio Frequencies 2021 Fall Meeting. An overview of how passive microwave measurements are used to understand climate change.
Oak woodlands of California provide a wide range of societal values and ecosystem services, including forage for livestock, wildlife habitat, recreation, soil conservation, and watershed protection. The future of these ecosystems is threatened by a combination grazing pressure, competition from exotic grasses, wildfire severity, and climate change. Kueppers et al. predicted that by the year 2099 the ranges of California endemic oaks would shrink by over 50% of modern potential range sizes, and would shift northward due to climate warming trends and larger precipitation deficits during the growing season.
Assessment of wheat crop coefficient using remote sensing techniquesPremier Publishers
Irrigation water consumption under physical and climatic conditions for large scale will be easier with remote sensing techniques. Crop evapotranspiration (ETc) uses crop coefficient (Kc) and reference evapotranspiration (ETo). Kc plays an essential role in agricultural practices and it has been widely used to estimate ETc. In this paper Normalized Deference Vegetation Index (NDVI) used to estimate crop coefficient according to satellite data (KcSat) through simple model (KcSat = 2NDVI - 0.2). Landsat8; bands 4 and 5 provide Red (R) and Near Infra-Red (NIR) measurements and it used to calculate NDVI. Single KcFAO estimated under Egyptian conditions according to FAO 56 paper. The KcFAO used to validate KcSat. Linear relationship between KcFAO and KcSat was established and R2 was 0.96. The main objective of this paper is estimation of wheat crop coefficient using remote sensing techniques.
Forecasting monthly water resources conditions by using different indicesAI Publications
Sharp changes in the SWSI are an obstacle for accurate estimation of this parameter. In addition, providing all of the information needed to determine the SWSI is not always possible. The SWE because of effective role in the calculation of the SWSI, it is a viable alternative to forecast instead the SWSI. The obtained results showed that the ARIMA model forecasted the SWE values for January to June successfully. Using these forecasted data and by non-linear regression can be estimated the SWSI values for all points of each basin except in cases that the amounts of SWSI and SWE are very low (drought conditions).
International Journal of Computational Engineering Research(IJCER)ijceronline
International Journal of Computational Engineering Research(IJCER) is an intentional online Journal in English monthly publishing journal. This Journal publish original research work that contributes significantly to further the scientific knowledge in engineering and Technology.
NISAR
Oil, Gas, and Water Underground Reservoirs
NASA
National Aeronautics and Space Administration
NASA-ISRO Synthetic Aperture Radar (NISAR)
By
Dr. Pankaj Dhussa
diurnal temperature range trend over North Carolina and the associated mechan...Sayem Zaman, Ph.D, PE.
This study seeks to investigate the variability and presence of trends in the diurnal surface air temperature range
(DTR) over North Carolina (NC) for the period 1950–2009. The significance trend test and the magnitude of trends were determined using the non-parametric Mann–Kendall test and the Theil–Sen approach, respectively.
Statewide significant trends (p b 0.05) of decreasing DTR were found in all seasons and annually during the analysis period. The highest (lowest) temporal DTR trends of magnitude −0.19 (−0.031) °C/decade were found in summer (winter). Potential mechanisms for the presence/absence of trends in DTR have been highlighted. Historical
data sets of the three main moisture components (precipitation, total cloud cover (TCC), and soil moisture) and
the two major atmospheric circulation modes (North Atlantic Oscillation and Southern Oscillation) were used for
correlation analysis. The DTRs were found to be negatively correlated with the precipitation, TCC, and soil moisture across the state for all the seasons and annual basis. It appears that the moisture components related better to the DTR than to the atmospheric circulation modes.
Similar to Relation between Ground-based Soil Moisture and Satellite Image-based NDVI (20)
Collapsing Narratives: Exploring Non-Linearity • a micro report by Rosie WellsRosie Wells
Insight: In a landscape where traditional narrative structures are giving way to fragmented and non-linear forms of storytelling, there lies immense potential for creativity and exploration.
'Collapsing Narratives: Exploring Non-Linearity' is a micro report from Rosie Wells.
Rosie Wells is an Arts & Cultural Strategist uniquely positioned at the intersection of grassroots and mainstream storytelling.
Their work is focused on developing meaningful and lasting connections that can drive social change.
Please download this presentation to enjoy the hyperlinks!
This presentation, created by Syed Faiz ul Hassan, explores the profound influence of media on public perception and behavior. It delves into the evolution of media from oral traditions to modern digital and social media platforms. Key topics include the role of media in information propagation, socialization, crisis awareness, globalization, and education. The presentation also examines media influence through agenda setting, propaganda, and manipulative techniques used by advertisers and marketers. Furthermore, it highlights the impact of surveillance enabled by media technologies on personal behavior and preferences. Through this comprehensive overview, the presentation aims to shed light on how media shapes collective consciousness and public opinion.
Relation between Ground-based Soil Moisture and Satellite Image-based NDVI
1. Relation between Ground-based Soil Moisture
and Satellite Image-based NDVI
Presenter: Xianwei Wang
April 15, 2005
Instructor: Dr. Hongjie Xie
Earth and Environmental Science Department
University of Texas at San Antonio
2. Introduction
• Soil moisture is very important parameters for vegetation
growth and climatic and hydrological modeling. Surface
soil moisture (<10cm) can be easily acquired, like
remotely sensing by microwave, or estimating with
satellite surface vegetation index. However, there was few
ways to obtain the deeper zone soil moisture. Ground-based
measurement of soil moisture is very expensive
and can’t satisfy the need of climatic and hydrological
modeling. The Soil Climate Analysis Network (SCAN)
provides the hourly profile soil moisture, which provides
us chance to estimate soil moisture using MODIS NDVI.
3. Objectivity
To find if there is any correlation
between soil moisture and MODIS
image-based NDVI.
To estimate the soil moisture using
NDVI if there is good correlation
between soil moisture and NDVI.
5. Research Areas and Period
Three sites with different climate and vegetation.
Adams Ranch (2015) in New Mexico, semi-arid region,
grassland.
Walnut Gulch (2026) in Arizona, semi-arid region,
shrubland;
Prairie View (2016) in Texas, moderate humid region,
grassland, to be completed.
Period is from Feb 26, 2000 to Apr 31, 2004.
6. SCAN Site Information
Adams Ranch: 2015
Lincoln County in New Mexico
Latitude: 34° 15' N
Longitude: 105° 25' W
Elevation: 6175 feet
Period of Record: 10/1/1994 to Present
Walnut Gulch: 2026
Cochise County, in Arizona
Latitude: 31° 44' N
Longitude: 110° 03' W
Elevation: 4500 feet
Period of Record: 3/19/1999 to Present
Prairie View: 2016
Waller County in Texas
Latitude: 30° 05' N
Longitude: 95° 59' W
Elevation: 270 feet
Period of Record: 10/1/1994 to Present
7. Data Sources
Soil moisture
Soil Moisture data was downloaded from three SCAN
Sites.
Measured with neutron probe;
Including 5cm, 10cm, 20cm, 50cm, and 100cm depth.
Frequency: hourly
Period is from Feb, 2000 through Apr, 2004
8. 1 2 3
4 5 6
7 8 9
Data Source
NDVI
NDVI was calculated using band1 and
band2 from the MODIS images
downloaded from Earth Observation
System (EOS) data gateway.
NDVI= (R2-R1) / (R2+R1)
R1, R2: Reflectance of band1, 2.
Period is from Feb, 2000 through Apr,
2004
250 by 250 meter spatial resolution
Frequency: daily
8-day average
10. Methods
Time series average of five-year data
SM d i
n
SM d
n
i Σ=
= 1
( , )
( )
Cross Correlation analysis
R = C i j
2 ( , )
SQRT C i j C i j
( ( , ) * ( , ))
R2 is a matrix of correlation coefficients from matrix X.
C is the covariance matrix of Matrix X.
SQRT(X) is the square root of the elements of Matrix X.
X is a matrix composed of soil moisture and NDVI
11. Methods
Regression Analysis
Y is an n by 1 vector of observed
soil moisture.
X is an n by 2 matrix composed
of 1 and NDVI.
b is a p by 1 constant vector
calculated from X and Y
^Y, estimated n by 1 vector.
r or e is an n by 1 vector error
between observed soil moisture
and estimated soil moisture.
13. Correlation between NDVI and soil moisture
(through five years) at NM Ranch
Under 95% confidence level
Soil moisture has small correlation with simultaneous NDVI through five
years. But the time-lagged NDVI increases their correlation.
14. Correlation between average NDVI and
average soil moisture (through a year) at NM
Five years time-series average soil moisture has a better correlation with average NDVI.
Their correlation increases up to 0.7 at 100cm deep when NDVI lags SM 40 days.
15. Correlation between SM and NDVI at NM
(May-Aug)
NDVI has good correlation with 10 and 20cm soil moisture, but small correlation
With 50cm and 100cm deep soil moisture during May-Aug.
16. Correlation between SM and NDVI at NM
(April-July)
Under 95% confidence level
NDVI has good correlation with 100cm soil moisture, but small correlation
With 10cm, 20cm and 50cm deep soil moisture during April-July.
17. Correlation between SM and NDVI at NM
(Sep-Mar)
NDVI has small correlation with soil moisture during non-growing
season, while slightly increase as time lags.
18. Regressed 100cm SM based on growing-season
NDVI VS observed growing-season SM
at NM
Regression based on simultaneous growing season NDVI at 95% CL
19. Regressed 10cm SM based on growing-season
NDVI VS observed growing-season SM
at NM
23. Correlation between SM and NDVI during non-growing
season
Arizona New Mexico
NDVI has small correlation with soil moisture during non-growing season,
while slightly increase as time lags.
25. Regressed 100cm SM based on growing-season
NDVI VS observed growing-season SM
Arizona New Mexico
Regression based on simultaneous growing season NDVI at 95% CL
26. Regressed 10cm SM based on growing-season
NDVI VS observed growing-season SM
Arizona New Mexico
28. Correlation between SM and NDVI during
growing season (May-Sep) at TX and NM
Texas New Mexico
29. Conclusion
The root and below-root zone soil moisture in semi-arid
climate has good correlation with simultaneous NDVI and
can be estimated using NDVI during growing season.
The root zone soil moisture in humid climate also has
moderate correlation with simultaneous NDVI and can be
estimated using NDVI during growing season.
The below-root soil moisture in humid climate has small
correlation with NDVI and can’t be effectively estimated
using NDVI.
Soil moisture has small correlation with NDVI and can’t be
effectively estimated using NDVI during non-growing
season (Oct-March).