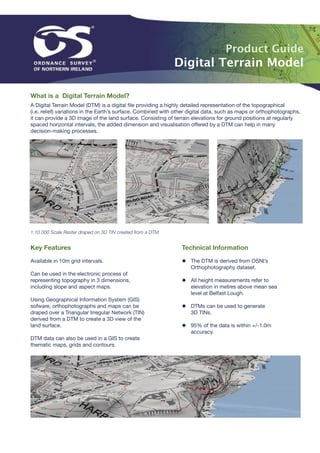
A Digital Terrain Model (DTM) is a digital file that provides a detailed 3D representation of the topography of the Earth's surface. It consists of terrain elevations at regularly spaced intervals that can be used to create 3D visualizations and analyze slope, aspect, height, and other topographical features. DTMs with draped aerial imagery can help with planning, engineering, and environmental impact assessments by providing accurate 3D models of land surfaces. They are used across a variety of industries and applications.
This presentation is about the raster and vector data in GIS which is important and costly as well, through the presentation we will learn about both type of data.
Digital Elevation Model (DEM) is the digital representation of the land surface elevation with respect to any reference datum. DEM is frequently used to refer to any digital representation of a topographic surface. DEM is the simplest form of digital representation of topography. GIS applications depend mainly on DEMs, today.
Topics:
1. Introduction to GIS
2. Components of GIS
3. Types of Data
4. Spatial Data
5. Non-Spatial Data
6. GIS Operations
7. Coordinate Systems
8. Datum
9. Map Projections
10. Raster Data Compression Techniques
11. GIS Software
12. Free GIS Data Resources
DEFINITION :
GIS is a powerful set of tools for collecting, storing , retrieving at will, transforming and displaying spatial data from the real world for a particular set of purposes
APPLICATION AREAS OF GIS
Agriculture
Business
Electric/Gas utilities
Environment
Forestry
Geology
Hydrology
Land-use planning
Local government
Mapping
11. Military
12. Risk management
13. Site planning
14. Transportation
15. Water / Waste water industry
COMPONENTS OF GIS
DATA INPUT
SPATIAL DATA MODEL
Data Model:
It describes in an abstract way how the data is represented in an information system or in DBMS
Spatial Data Model :
The models or abstractions of reality that are intended to have some similarity with selected aspects of the real world
Creation of analogue and digital spatial data sets involves seven levels of model development and abstraction
SPATIAL DATA MODEL
Conceptual model : A view of reality
Analog model : Human conceptualization leads to analogue abstraction
Spatial data models : Formalization of analogue abstractions without any conventions
Database model : How the data are recorded in the computer
Physical computational model : Particular representation of the data structures in computer memory
Data manipulation model : Accepted axioms and rules for handling the data
SPATIAL DATA MODEL
SPATIAL DATA MODEL
Objects on the earth surface are shown as continuous and discrete objects in spatial data models
Types of data models
Raster data model
vector data models
RASTER DATA MODEL
Basic Elements :
Extent
Rows
Columns
Origin
Orientation
Resolution: pixel = grain = grid cell
Ex: Bit Map Image (BMP),Joint Photographic Expert Group (JPEG), Portable Network Graphics(PNG) etc
RASTER DATA MODEL
VECTOR DATA MODEL
Basic Elements:
Location (x,y) or (x,y,z)
Explicit, i.e. pegged to a coordinate system
Different coordinate system (and precision) require different values
o e.g. UTM as integer (but large)
o Lat, long as two floating point numbers +/-
Points are used to build more complex features
Ex: Auto CAD Drawing File(DWG), Data Interchange(exchange) File(DXF), Vector Product Format (VPF) etc
VECTOR DATA MODEL
RASTER vs VECTORRaster is faster but Vector is corrector
TESSELLATIONS OF CONTINUOUS FIELDS
Triangular Irregular Network: (TIN)
TIN is a vector data structure for representing geographical information that is continuous
Digital elevation model
TIN is generally used to create Digital Elevation Model (DEM)
DIGITAL ELEVATION MODEL
DATA STRUCTURES
Data structure tells about how the data is stored
Data organization in raster data structures
Each cell is referenced directly
Each overlay Is referenced directly
Each mapping unit is referenced directly
Each overlay is separate file with general header
When you georeference your raster data, you define its location using map coordinates and assign the coordinate system of the map frame. Georeferencing raster data allows it to be viewed, queried, and analyzed with your other geographic data. The georeferencing tools on the Georeference tab allows you to georeference any raster dataset.
In general, there are four steps to georeference your data:
Add the raster dataset that you want to align with your projected data.
Use the Georeference tab to create control points, to connect your raster to known positions in the map
Review the control points and the errors
Save the georeferencing result, when you are satisfied with the alignment.
International Journal of Modern Engineering Research (IJMER) is Peer reviewed, online Journal. It serves as an international archival forum of scholarly research related to engineering and science education.
International Journal of Modern Engineering Research (IJMER) covers all the fields of engineering and science: Electrical Engineering, Mechanical Engineering, Civil Engineering, Chemical Engineering, Computer Engineering, Agricultural Engineering, Aerospace Engineering, Thermodynamics, Structural Engineering, Control Engineering, Robotics, Mechatronics, Fluid Mechanics, Nanotechnology, Simulators, Web-based Learning, Remote Laboratories, Engineering Design Methods, Education Research, Students' Satisfaction and Motivation, Global Projects, and Assessment…. And many more.
We are the leading investing and buildings businesses involved in geospatial software and geo data production. Our elusive goal is to focus on the creation and delivery of geo data and the development of 3d map rf planning software for the global telecom.
Today very high resolution DEM from satellite image data with resolution of about one meter allows to depict very detailed surface changes.
High resolution DEM increase accurate satellite image geometry and adding DGPS ground control points increases x.y.z accuracy.
Wrong positioning of objects or bad parameters calculation often result in bad image geometry.
From along track stereo pairs of VHR satellite optical data it’s possible to generate an automatic DEM.
Applications :
Ortho-rectification of satellite images, 3D display.
Creation of accurate topographic reference, relief maps.
Topographic profiles and contour generation.
Surface analysis.
Calculations of slope, orientation and shading.
Calculations of volume and elevation
Extraction of terrain and morphometric parameters.
Geomorphology and structural analysis.
Geological quantifications (dips, lithological thicknesses, faults and folds of geometry, etc.).
3D Reference map of resources extraction zones (quarries, open-pits).
Calculation of hydrographic networks and watershed basin.
Determination of hypsometric curves, knickpoints, etc.
Characterization of eroded areas.
Floods simulation, risks evaluation.
Volume calculation for restraints of dams.
1. Product Guide
Digital Terrain Model
What is a Digital Terrain Model?
A Digital Terrain Model (DTM) is a digital file providing a highly detailed representation of the topographical
(i.e. relief) variations in the Earth’s surface. Combined with other digital data, such as maps or orthophotographs,
it can provide a 3D image of the land surface. Consisting of terrain elevations for ground positions at regularly
spaced horizontal intervals, the added dimension and visualisation offered by a DTM can help in many
decision-making processes.
1:10 000 Scale Raster draped on 3D TIN created from a DTM
Key Features Technical Information
Available in 10m grid intervals. ◆ The DTM is derived from OSNI’s
Orthophotography dataset.
Can be used in the electronic process of
representing topography in 3 dimensions, ◆ All height measurements refer to
including slope and aspect maps. elevation in metres above mean sea
level at Belfast Lough.
Using Geographical Information System (GIS)
sofware, orthophotographs and maps can be ◆ DTMs can be used to generate
draped over a Triangular Irregular Network (TIN) 3D TINs.
derived from a DTM to create a 3D view of the
land surface. ◆ 95% of the data is within +/-1.0m
accuracy.
DTM data can also be used in a GIS to create
thematic maps, grids and contours.
2. Digital Terrain Model
Applications
◆ Planning
◆ Engineering
◆ Visualisation
◆ Height Analysis
X Co-Ordinate 337990
Y Co-Ordinate 405050
◆ Environmental Impact Analysis
Height 91.1868
◆ Sight Lines
◆ Wind flow and pollution dispersion
◆ Soil erosion modelling
◆ Flow direction and accumulation
DTM Data ◆ Watershed delineation
DTMs in Action
DTMs are used by a number of organisations and businesses
such as the construction industry, where they are used for
the creation of elevation models. Digital data, for example,
maps or photographs are draped over the elevation models to
provide a 3D view of the land surface. Architectural 3D models
can be added to the data to envisage future developments.
The resulting 3D models can then be used for planning and
environmental impact assessments.
OSNI in partnership with European Air Surveys created a 3D
‘fly through’ of the Mourne Mountains and Silent Valley.
By combining DTM with orthophotography the fly through
accurately represents land and height variations.
DTMs are also used for analytical applications. For example
telecommunication companies use a DTM for viewshed
analysis when planning sites of new masts. Insurance
companies also use a DTM to carry out floodplain analysis,
to identify areas at high and low risk of flooding, when setting
premiums.
Contact us
Ordnance Survey of Northern Ireland, Telephone 028 9025 5723
Colby House, Stranmillis Court, Email osni@osni.gov.uk
Malone Lower, Belfast, BT9 5BJ www.osni.gov.uk