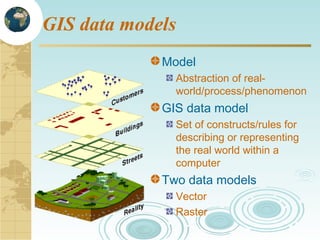
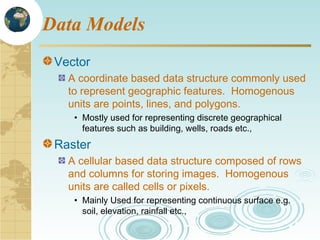
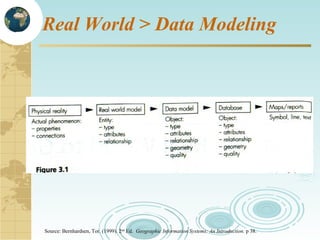
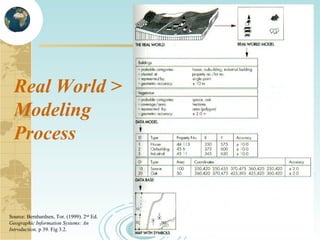
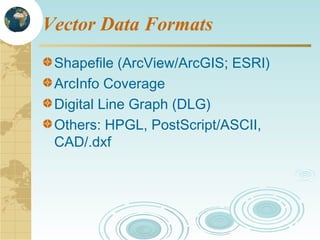
GIS Data Models
GIS Data Models
The real world can only be depicted in a
GIS through the use of models that
define phenomena in a manner that
computer systems can interpret, as well
perform meaningful analysis
GIS data models
Model
Abstraction of realworld/process/phenomenon

GIS data model
Set of constructs/rules for
describing or representing
the real world within a
computer

Two data models
Vector
Raster
Data Models
Vector
A coordinate based data structure commonly used
to represent geographic features. Homogenous
units are points, lines, and polygons.
• Mostly used for representing discrete geographical
features such as building, wells, roads etc.,

Raster
A cellular based data structure composed of rows
and columns for storing images. Homogenous
units are called cells or pixels.
• Mainly Used for representing continuous surface e.g.
soil, elevation, rainfall etc.,
Vector Data Model
Real World > Data Modeling

Source: Bernhardsen, Tor. (1999). 2nd Ed. Geographic Information Systems: An Introduction. p 38.
Real World >
Modeling
Process

Source: Bernhardsen, Tor. (1999). 2nd Ed.
Geographic Information Systems: An
Introduction. p 39. Fig 3.2.
Vector Data Model
Points

Points are associated
with single set of
coordinates (X, Y)

Lines

Lines are a connected
sequence of
coordinate pairs

Polygons

Areas are a sequence
of interconnected lines
whose 1st & last
coordinate points are
the same
Scale
Scale plays a major role in how you
represent a spatial entity
i.e whether to represent an entity as a
point, line or a polygon

Scale = Map Distance / Real Distance
E.g. 1: 1,000: large scale
1:1,000,000: small scale
Vector Data Formats
Shapefile (ArcView/ArcGIS; ESRI)
ArcInfo Coverage
Digital Line Graph (DLG)
Others: HPGL, PostScript/ASCII,
CAD/.dxf
Your will encounter mostly
Arcview shape files or ArcInfo Coverage
CAD/.dxf

Conversion tools are available in most
GIS platforms
However, topology should be built to
make it useful for further analysis

datamodel_vector

  • 1.
  • 2.
    GIS Data Models Thereal world can only be depicted in a GIS through the use of models that define phenomena in a manner that computer systems can interpret, as well perform meaningful analysis
  • 3.
    GIS data models Model Abstractionof realworld/process/phenomenon GIS data model Set of constructs/rules for describing or representing the real world within a computer Two data models Vector Raster
  • 4.
    Data Models Vector A coordinatebased data structure commonly used to represent geographic features. Homogenous units are points, lines, and polygons. • Mostly used for representing discrete geographical features such as building, wells, roads etc., Raster A cellular based data structure composed of rows and columns for storing images. Homogenous units are called cells or pixels. • Mainly Used for representing continuous surface e.g. soil, elevation, rainfall etc.,
  • 6.
  • 7.
    Real World >Data Modeling Source: Bernhardsen, Tor. (1999). 2nd Ed. Geographic Information Systems: An Introduction. p 38.
  • 8.
    Real World > Modeling Process Source:Bernhardsen, Tor. (1999). 2nd Ed. Geographic Information Systems: An Introduction. p 39. Fig 3.2.
  • 9.
    Vector Data Model Points Pointsare associated with single set of coordinates (X, Y) Lines Lines are a connected sequence of coordinate pairs Polygons Areas are a sequence of interconnected lines whose 1st & last coordinate points are the same
  • 10.
    Scale Scale plays amajor role in how you represent a spatial entity i.e whether to represent an entity as a point, line or a polygon Scale = Map Distance / Real Distance E.g. 1: 1,000: large scale 1:1,000,000: small scale
  • 14.
    Vector Data Formats Shapefile(ArcView/ArcGIS; ESRI) ArcInfo Coverage Digital Line Graph (DLG) Others: HPGL, PostScript/ASCII, CAD/.dxf
  • 16.
    Your will encountermostly Arcview shape files or ArcInfo Coverage CAD/.dxf Conversion tools are available in most GIS platforms However, topology should be built to make it useful for further analysis

Editor's Notes

  • #3 There are two significant model categories at present: Graphic Models: Vector and Raster Database Models/Structures: simple lists, sequential files, indexed files, hierarchal files, network files, relational database, etc. Today we’ll touch upon real-world entities translated into database objects, but our main focus will be on the models used in representing GIS data graphically (Vector vs Raster)
  • #8 Source: Bernhardsen, Tor. (1999). 2nd Ed. Geographic Information Systems: An Introduction. p 38. Fig 3.1. (simplified model of real world) The process of interpreting reality by using both a real world and a data model is called data modeling.
  • #9 Source: Bernhardsen, Tor. (1999). 2nd Ed. Geographic Information Systems: An Introduction. p 39. Fig 3.2. (Modeling process) The process of interpreting reality by using both a real world and a data model is called data modeling.