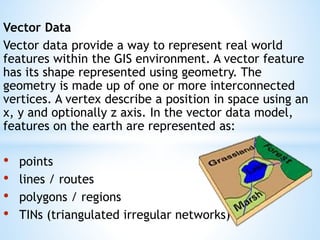
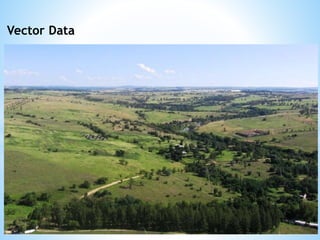
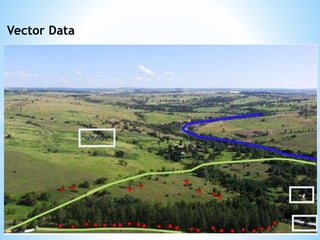
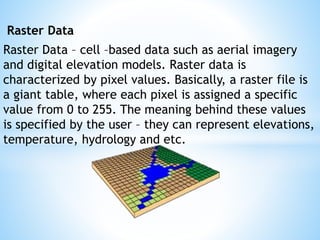
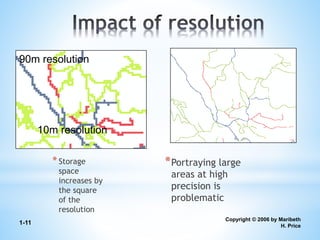
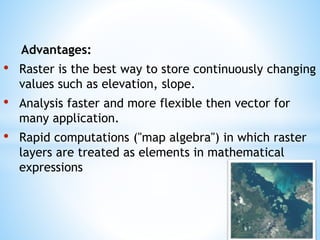
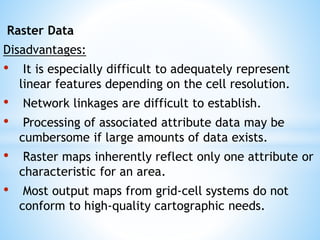
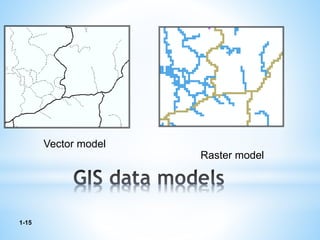
This document discusses two types of spatial data used in GIS - vector data and raster data. Vector data represents geographic features as points, lines, and polygons using vertices with x, y, and z coordinates. It allows for accurate representation of shapes and storing of attribute data but requires more processing and storage. Raster data represents geographic information through a grid of cells (pixels), with each cell storing attribute values like elevation or temperature. It is better for continuously changing data but cannot represent linear features well and has increased storage needs at higher resolutions. Both data types have advantages and disadvantages depending on the use case.
Also known as geospatial data or geographic information it is the data or information that identifies the geographic location of features and boundaries on Earth, such as natural or constructed features, oceans, and more. Spatial data is usually stored as coordinates and topology, and is data that can be mapped.
This presentation is about the raster and vector data in GIS which is important and costly as well, through the presentation we will learn about both type of data.
An introduction to GIS Data Types. Strengths and weaknesses of raster and vector data are discussed. Also covered is the importance of topology. Concludes with a discussion of the vector-based format of OpenStreetMap data.
When you georeference your raster data, you define its location using map coordinates and assign the coordinate system of the map frame. Georeferencing raster data allows it to be viewed, queried, and analyzed with your other geographic data. The georeferencing tools on the Georeference tab allows you to georeference any raster dataset.
In general, there are four steps to georeference your data:
Add the raster dataset that you want to align with your projected data.
Use the Georeference tab to create control points, to connect your raster to known positions in the map
Review the control points and the errors
Save the georeferencing result, when you are satisfied with the alignment.
One of most important topics in ArcGIS and GIS, is coordinate system, the slides will cover this topic in order to understand the difference between various coordinate systems.
Gis Geographical Information System FundamentalsUroosa Samman
Gis, Geographical Information System Fundamentals. This presentation includes a complete detail of GIS and GIS Softwares. It will help students of GIS and Environmental Science.
Topics:
1. Introduction to GIS
2. Components of GIS
3. Types of Data
4. Spatial Data
5. Non-Spatial Data
6. GIS Operations
7. Coordinate Systems
8. Datum
9. Map Projections
10. Raster Data Compression Techniques
11. GIS Software
12. Free GIS Data Resources
RS & GIS, Image Interpretation, Methods of Image interpretation, Types of interpretation, Factors governing image interpretation, Activities to interpret image, Sensors, Role of sensors in Image derivation, Aerial Photography, LISS-3, Image characteristics, Special characteristics, Shadow, Texture, Pattern, associated features in images
Remote Sensing: Normalized Difference Vegetation Index (NDVI)Kamlesh Kumar
The Normalized Difference Vegetation Index (NDVI) is a numerical indicator that uses the visible and near-infrared (NIR) bands of the electromagnetic spectrum to analyze whether the target (image) being observed contains green vegetation or not. Healthy vegetation (chlorophyll) reflects more near-infrared (NIR) and green light compared to other wavelengths. But it absorbs more red and blue light. This is why our eyes see vegetation as the colour green. If we could see near-infrared, then it would be strong for vegetation too.
It is basically measured through the use of Intensity, Hue and saturation of an image and through pixels as well.
The density of vegetation (NDVI) at a certain point on the image is equal to the difference in the intensities of reflected light in the red and infrared range divided by the sum of these intensities.
푁퐷푉퐼=((푁퐼푅−푅퐸퐷))/((푁퐼푅+푅퐸퐷))
The result of this formula generates a value between -1 and +1. If you have low reflectance (low values) in the red band and high reflectance in the NIR, this will yield a high NDVI value. And vice versa.
A spatial database, or geodatabase is a database that is optimized to store and query data
that represents objects defined in a geometric space. Most spatial databases allow representing simple geometric objects such as points, lines and polygons.
the title of this course is Entitles as GIS and Remote sensingmulugeta48
This course is entitled as GIS and Remote sensing, this course is mainly focus on the application of GIS on irrigation water which is the application of water to the soil for the purpose of crop production
Data models are a set of rules and/or constructs used to describe and represent aspects of the real world in a computer. GIS can handle four data models for various applications. This module explains those four.
Democratizing Fuzzing at Scale by Abhishek Aryaabh.arya
Presented at NUS: Fuzzing and Software Security Summer School 2024
This keynote talks about the democratization of fuzzing at scale, highlighting the collaboration between open source communities, academia, and industry to advance the field of fuzzing. It delves into the history of fuzzing, the development of scalable fuzzing platforms, and the empowerment of community-driven research. The talk will further discuss recent advancements leveraging AI/ML and offer insights into the future evolution of the fuzzing landscape.
Hybrid optimization of pumped hydro system and solar- Engr. Abdul-Azeez.pdffxintegritypublishin
Advancements in technology unveil a myriad of electrical and electronic breakthroughs geared towards efficiently harnessing limited resources to meet human energy demands. The optimization of hybrid solar PV panels and pumped hydro energy supply systems plays a pivotal role in utilizing natural resources effectively. This initiative not only benefits humanity but also fosters environmental sustainability. The study investigated the design optimization of these hybrid systems, focusing on understanding solar radiation patterns, identifying geographical influences on solar radiation, formulating a mathematical model for system optimization, and determining the optimal configuration of PV panels and pumped hydro storage. Through a comparative analysis approach and eight weeks of data collection, the study addressed key research questions related to solar radiation patterns and optimal system design. The findings highlighted regions with heightened solar radiation levels, showcasing substantial potential for power generation and emphasizing the system's efficiency. Optimizing system design significantly boosted power generation, promoted renewable energy utilization, and enhanced energy storage capacity. The study underscored the benefits of optimizing hybrid solar PV panels and pumped hydro energy supply systems for sustainable energy usage. Optimizing the design of solar PV panels and pumped hydro energy supply systems as examined across diverse climatic conditions in a developing country, not only enhances power generation but also improves the integration of renewable energy sources and boosts energy storage capacities, particularly beneficial for less economically prosperous regions. Additionally, the study provides valuable insights for advancing energy research in economically viable areas. Recommendations included conducting site-specific assessments, utilizing advanced modeling tools, implementing regular maintenance protocols, and enhancing communication among system components.
Overview of the fundamental roles in Hydropower generation and the components involved in wider Electrical Engineering.
This paper presents the design and construction of hydroelectric dams from the hydrologist’s survey of the valley before construction, all aspects and involved disciplines, fluid dynamics, structural engineering, generation and mains frequency regulation to the very transmission of power through the network in the United Kingdom.
Author: Robbie Edward Sayers
Collaborators and co editors: Charlie Sims and Connor Healey.
(C) 2024 Robbie E. Sayers
NO1 Uk best vashikaran specialist in delhi vashikaran baba near me online vas...Amil Baba Dawood bangali
Contact with Dawood Bhai Just call on +92322-6382012 and we'll help you. We'll solve all your problems within 12 to 24 hours and with 101% guarantee and with astrology systematic. If you want to take any personal or professional advice then also you can call us on +92322-6382012 , ONLINE LOVE PROBLEM & Other all types of Daily Life Problem's.Then CALL or WHATSAPP us on +92322-6382012 and Get all these problems solutions here by Amil Baba DAWOOD BANGALI
#vashikaranspecialist #astrologer #palmistry #amliyaat #taweez #manpasandshadi #horoscope #spiritual #lovelife #lovespell #marriagespell#aamilbabainpakistan #amilbabainkarachi #powerfullblackmagicspell #kalajadumantarspecialist #realamilbaba #AmilbabainPakistan #astrologerincanada #astrologerindubai #lovespellsmaster #kalajaduspecialist #lovespellsthatwork #aamilbabainlahore#blackmagicformarriage #aamilbaba #kalajadu #kalailam #taweez #wazifaexpert #jadumantar #vashikaranspecialist #astrologer #palmistry #amliyaat #taweez #manpasandshadi #horoscope #spiritual #lovelife #lovespell #marriagespell#aamilbabainpakistan #amilbabainkarachi #powerfullblackmagicspell #kalajadumantarspecialist #realamilbaba #AmilbabainPakistan #astrologerincanada #astrologerindubai #lovespellsmaster #kalajaduspecialist #lovespellsthatwork #aamilbabainlahore #blackmagicforlove #blackmagicformarriage #aamilbaba #kalajadu #kalailam #taweez #wazifaexpert #jadumantar #vashikaranspecialist #astrologer #palmistry #amliyaat #taweez #manpasandshadi #horoscope #spiritual #lovelife #lovespell #marriagespell#aamilbabainpakistan #amilbabainkarachi #powerfullblackmagicspell #kalajadumantarspecialist #realamilbaba #AmilbabainPakistan #astrologerincanada #astrologerindubai #lovespellsmaster #kalajaduspecialist #lovespellsthatwork #aamilbabainlahore #Amilbabainuk #amilbabainspain #amilbabaindubai #Amilbabainnorway #amilbabainkrachi #amilbabainlahore #amilbabaingujranwalan #amilbabainislamabad
Student information management system project report ii.pdfKamal Acharya
Our project explains about the student management. This project mainly explains the various actions related to student details. This project shows some ease in adding, editing and deleting the student details. It also provides a less time consuming process for viewing, adding, editing and deleting the marks of the students.
Water scarcity is the lack of fresh water resources to meet the standard water demand. There are two type of water scarcity. One is physical. The other is economic water scarcity.
Welcome to WIPAC Monthly the magazine brought to you by the LinkedIn Group Water Industry Process Automation & Control.
In this month's edition, along with this month's industry news to celebrate the 13 years since the group was created we have articles including
A case study of the used of Advanced Process Control at the Wastewater Treatment works at Lleida in Spain
A look back on an article on smart wastewater networks in order to see how the industry has measured up in the interim around the adoption of Digital Transformation in the Water Industry.
Event Management System Vb Net Project Report.pdfKamal Acharya
In present era, the scopes of information technology growing with a very fast .We do not see any are untouched from this industry. The scope of information technology has become wider includes: Business and industry. Household Business, Communication, Education, Entertainment, Science, Medicine, Engineering, Distance Learning, Weather Forecasting. Carrier Searching and so on.
My project named “Event Management System” is software that store and maintained all events coordinated in college. It also helpful to print related reports. My project will help to record the events coordinated by faculties with their Name, Event subject, date & details in an efficient & effective ways.
In my system we have to make a system by which a user can record all events coordinated by a particular faculty. In our proposed system some more featured are added which differs it from the existing system such as security.
Courier management system project report.pdfKamal Acharya
It is now-a-days very important for the people to send or receive articles like imported furniture, electronic items, gifts, business goods and the like. People depend vastly on different transport systems which mostly use the manual way of receiving and delivering the articles. There is no way to track the articles till they are received and there is no way to let the customer know what happened in transit, once he booked some articles. In such a situation, we need a system which completely computerizes the cargo activities including time to time tracking of the articles sent. This need is fulfilled by Courier Management System software which is online software for the cargo management people that enables them to receive the goods from a source and send them to a required destination and track their status from time to time.
TECHNICAL TRAINING MANUAL GENERAL FAMILIARIZATION COURSEDuvanRamosGarzon1
AIRCRAFT GENERAL
The Single Aisle is the most advanced family aircraft in service today, with fly-by-wire flight controls.
The A318, A319, A320 and A321 are twin-engine subsonic medium range aircraft.
The family offers a choice of engines
TECHNICAL TRAINING MANUAL GENERAL FAMILIARIZATION COURSE
ppt spatial data
1. Vector and rastar data
PREPARED BY:-
13BCL041
13BCL043
13BCL044
13BCL045
13BCL046
13BCL047
2. The data or information that identifies the
geographic location of features and
boundries.
On earth, such as natural and construted
features like Ocean, lake, pond etc.
Spatial data is usually stored as coordinate
and topology, and is data that can be
mapped.
s
3. IN GIS THEARE ARE TWO BASIC
SPATIAL DATA TYPES
RASTER
DATA
VECTOR
DATA
IN GIS THERE ARE TWO TYPES OF SPATIAL
DATA TYPES
4. Vector Data
Vector data provide a way to represent real world
features within the GIS environment. A vector feature
has its shape represented using geometry. The
geometry is made up of one or more interconnected
vertices. A vertex describe a position in space using an
x, y and optionally z axis. In the vector data model,
features on the earth are represented as:
• points
• lines / routes
• polygons / regions
• TINs (triangulated irregular networks)
5. Vector Data
This system of recording features is based on the
interaction between arcs and nodes, represented by
points, lines and polygons. A point is a single node, a
line is two nodes with an arc between them, and a
polygon is a closed group of three or more arcs. With
these three elements , it is possible to record most all
necessary information.
Points Lines
Polygons
6. Vector Data
Advantages
• accurately representing true shape and size
• representing non-continuous data (e.g., rivers, political
boundaries, road lines)
• Vectors can store information
About topology
• A vector data model uses points
stored by their real (earth)
coordinates and so requires a
• precise coordinate system.
• Geographic Coordinate System
Latitude/Longitude
• Cartesian Coordinate Systems
X,Y Coordinate system
7. Vector Data
Disadvantages:
• The location of each vertex needs to be
stored explicitly.
• Vector data must be converted into a
topological structure.
• This is often processing intensive and
usually requires extensive data cleaning.
• Updating or editing of the vector data
requires re-building of the topology.
10. Raster Data
Raster Data – cell –based data such as aerial imagery
and digital elevation models. Raster data is
characterized by pixel values. Basically, a raster file is
a giant table, where each pixel is assigned a specific
value from 0 to 255. The meaning behind these values
is specified by the user – they can represent elevations,
temperature, hydrology and etc.
12. Advantages:
• Raster is the best way to store continuously changing
values such as elevation, slope.
• Analysis faster and more flexible then vector for
many application.
• Rapid computations ("map algebra") in which raster
layers are treated as elements in mathematical
expressions
14. Raster Data
Disadvantages:
• It is especially difficult to adequately represent
linear features depending on the cell resolution.
• Network linkages are difficult to establish.
• Processing of associated attribute data may be
cumbersome if large amounts of data exists.
• Raster maps inherently reflect only one attribute or
characteristic for an area.
• Most output maps from grid-cell systems do not
conform to high-quality cartographic needs.