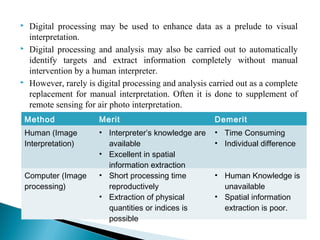
Analysis of remote sensing imagery involves identifying targets through their tone, shape, size, pattern, texture, and relationships to other objects. Targets may be environmental or artificial features appearing as points, lines, or areas. Interpretation relies on how radiation is reflected or emitted from targets and recorded by sensors to form images. The key to interpretation is recognizing targets based on these visual elements.
Spectral signatures are the specific combination of emitted, reflected or absorbed electromagnetic radiation (EM) at varying wavelengths which can uniquely identify an object. Here, i have focused on the spectral signature of water and the various micro-process that are responsible for it.
Resolution and scanning system
high resolution scanning
scanning resolution for photos
high resolution scanning service
best resolution for scanning photos
best scanning resolution for documents
scanning resolution dpi
high resolution scanning near me
A remote sensing system uses a detector to sense the reflected or emitted energy from the earth's surface, perhaps modified by the intervening atmosphere. The sensor can be on a satellite, aircraft, or drone. The sensor turns the energy into a voltage, which an analog to digital converter turns into a single integer value (called the Digital Number, or DN) for the energy. Alternatively a digital detector can store the DN directly. We can then display this value with an appropriate color to build up an image of the region sensed by the system. The DN represents the energy sensed by the sensor in a particular part of the electromagnetic spectrum, emitted or reflected from a particular region. The principles can also be applied to sonar imagery, especially useful in water where sound penetrates readily whereas electromagnetic energy attenuates rapidly.
Definitions,
Remote sensing systems can be active or passive: active systems put out their own source of energy (a large "flash bulb") whereas passive systems use solar energy reflected from the surface or thermal energy emitted by the surface. Active systems can achieve higher resolution.
Satellite resolution considers four things: spatial, spectral, radiometric, and temporal resolution.
Electromagnetic radiation and the atmosphere control many aspects of a remote sensing system.
Satellite orbits determine many characteristics of the imagery, what the satellite sees, and how often it revisits an area.
The signal to noise ratio is important for the design of remote sensing systems.
Satellite band tradeoffs.
Interpreting satellite reflectance patterns and images uses various statistical measures to assess surface properties in the image.
The colors used on the display are gray shading for single bands, and RGB for multi-band composites. We can also perform image merge and sharpening to combine the advantages of both panchromatic (higher spatial resolution) and color imagery (better differentiation of surface materials).
Keys for image analysis
Hyperspectral imagery
Spectral reflectance library--different materials reflect radiation differently
Remote Sensing: Normalized Difference Vegetation Index (NDVI)Kamlesh Kumar
The Normalized Difference Vegetation Index (NDVI) is a numerical indicator that uses the visible and near-infrared (NIR) bands of the electromagnetic spectrum to analyze whether the target (image) being observed contains green vegetation or not. Healthy vegetation (chlorophyll) reflects more near-infrared (NIR) and green light compared to other wavelengths. But it absorbs more red and blue light. This is why our eyes see vegetation as the colour green. If we could see near-infrared, then it would be strong for vegetation too.
It is basically measured through the use of Intensity, Hue and saturation of an image and through pixels as well.
The density of vegetation (NDVI) at a certain point on the image is equal to the difference in the intensities of reflected light in the red and infrared range divided by the sum of these intensities.
푁퐷푉퐼=((푁퐼푅−푅퐸퐷))/((푁퐼푅+푅퐸퐷))
The result of this formula generates a value between -1 and +1. If you have low reflectance (low values) in the red band and high reflectance in the NIR, this will yield a high NDVI value. And vice versa.
it is highly useful for geography students in the field of remote sensing and it is in very simple and explanatory for the purpose of simplification with relevant images in this ppt.
this presentation briefly describes the digital image processing and its various procedures and techniques which include image correction or rectification with remote sensing data/ images. it also contains various image classification techniques.
Lets Understand the overall working of photogrammetry. Get ideas about photogrammetry branches. Also, check the difference between photogrammetry and remote sensing.
Digital 3D imaging can benefit from advances in VLSI technology in order to accelerate its deployment in many fields like visual communication and industrial automation. High-resolution 3D images can be acquired using laser-based vision systems. With this approach, the 3D information becomes relatively insensitive to background illumination and surface texture. Complete images of visible surfaces that are rather featureless to the human eye or a video camera can be generated. Intelligent digitizers will be capable of measuring accurately and simultaneously color and 3D.
Remote sensing implies to the collection of data
about an object from a distance. With the use of LiDAR
remote sensing technology, the three dimensional
distribution of plant canopies and vegetation structural
attributes can be accurately estimated. The measure of
difference in reflectance from leaves of plants, due to the
presence of chlorophyll pigments in different ratios, can be
helpful to locate and characterize the plant remote
location through remote sensing technology and
Geographic Information System (GIS). The present study
highlights the importance of remote sensing technology and
GIS in detection of herbs located distantly.
clinical needs, medical devices, medicalAbdulWahab672
clinical needs, medical devices, medical devices vs medical instrumentsclinical needs, medical devices, medical devices vs medical instrumentsclinical needs, medical devices, medical devices vs medical instrumentsclinical needs, medical devices, medical devices vs medical instrumentsclinical needs, medical devices, medical devices vs medical instrumentsclinical needs, medical devices, medical devices vs medical instrumentsclinical needs, medical devices, medical devices vs medical instrumentsclinical needs, medical devices, medical devices vs medical instrumentsclinical needs, medical devices, medical devices vs medical instrumentsclinical needs, medical devices, medical devices vs medical instrumentsclinical needs, medical devices, medical devices vs medical instrumentsclinical needs, medical devices, medical devices vs medical instrumentsclinical needs, medical devices, medical devices vs medical instrumentsclinical needs, medical devices, medical devices vs medical instrumentsclinical needs, medical devices, medical devices vs medical instrumentsclinical needs, medical devices, medical devices vs medical instrumentsclinical needs, medical devices, medical devices vs medical instrumentsclinical needs, medical devices, medical devices vs medical instrumentsclinical needs, medical devices, medical devices vs medical instrumentsclinical needs, medical devices, medical devices vs medical instrumentsclinical needs, medical devices, medical devices vs medical instrumentsclinical needs, medical devices, medical devices vs medical instrumentsclinical needs, medical devices, medical devices vs medical instrumentsclinical needs, medical devices, medical devices vs medical instrumentsclinical needs, medical devices, medical devices vs medical instrumentsclinical needs, medical devices, medical devices vs medical instrumentsclinical needs, medical devices, medical devices vs medical instrumentsclinical needs, medical devices, medical devices vs medical instrumentsclinical needs, medical devices, medical devices vs medical instrumentsclinical needs, medical devices, medical devices vs medical instrumentsclinical needs, medical devices, medical devices vs medical instrumentsclinical needs, medical devices, medical devices vs medical instrumentsclinical needs, medical devices, medical devices vs medical instrumentsclinical needs, medical devices, medical devices vs medical instrumentsclinical needs, medical devices, medical devices vs medical instrumentsclinical needs, medical devices, medical devices vs medical instrumentsclinical needs, medical devices, medical devices vs medical instrumentsclinical needs, medical devices, medical devices vs medical instrumentsclinical needs, medical devices, medical devices vs medical instrumentsclinical needs, medical devices, medical devices vs medical instrumentsclinical needs, medical devices, medical devices vs medical instrumentsclinical needs, medical devices, medical devices vs medical instrumentsclinical needs, me
Hierarchical Digital Twin of a Naval Power SystemKerry Sado
A hierarchical digital twin of a Naval DC power system has been developed and experimentally verified. Similar to other state-of-the-art digital twins, this technology creates a digital replica of the physical system executed in real-time or faster, which can modify hardware controls. However, its advantage stems from distributing computational efforts by utilizing a hierarchical structure composed of lower-level digital twin blocks and a higher-level system digital twin. Each digital twin block is associated with a physical subsystem of the hardware and communicates with a singular system digital twin, which creates a system-level response. By extracting information from each level of the hierarchy, power system controls of the hardware were reconfigured autonomously. This hierarchical digital twin development offers several advantages over other digital twins, particularly in the field of naval power systems. The hierarchical structure allows for greater computational efficiency and scalability while the ability to autonomously reconfigure hardware controls offers increased flexibility and responsiveness. The hierarchical decomposition and models utilized were well aligned with the physical twin, as indicated by the maximum deviations between the developed digital twin hierarchy and the hardware.
Welcome to WIPAC Monthly the magazine brought to you by the LinkedIn Group Water Industry Process Automation & Control.
In this month's edition, along with this month's industry news to celebrate the 13 years since the group was created we have articles including
A case study of the used of Advanced Process Control at the Wastewater Treatment works at Lleida in Spain
A look back on an article on smart wastewater networks in order to see how the industry has measured up in the interim around the adoption of Digital Transformation in the Water Industry.
NUMERICAL SIMULATIONS OF HEAT AND MASS TRANSFER IN CONDENSING HEAT EXCHANGERS...ssuser7dcef0
Power plants release a large amount of water vapor into the
atmosphere through the stack. The flue gas can be a potential
source for obtaining much needed cooling water for a power
plant. If a power plant could recover and reuse a portion of this
moisture, it could reduce its total cooling water intake
requirement. One of the most practical way to recover water
from flue gas is to use a condensing heat exchanger. The power
plant could also recover latent heat due to condensation as well
as sensible heat due to lowering the flue gas exit temperature.
Additionally, harmful acids released from the stack can be
reduced in a condensing heat exchanger by acid condensation. reduced in a condensing heat exchanger by acid condensation.
Condensation of vapors in flue gas is a complicated
phenomenon since heat and mass transfer of water vapor and
various acids simultaneously occur in the presence of noncondensable
gases such as nitrogen and oxygen. Design of a
condenser depends on the knowledge and understanding of the
heat and mass transfer processes. A computer program for
numerical simulations of water (H2O) and sulfuric acid (H2SO4)
condensation in a flue gas condensing heat exchanger was
developed using MATLAB. Governing equations based on
mass and energy balances for the system were derived to
predict variables such as flue gas exit temperature, cooling
water outlet temperature, mole fraction and condensation rates
of water and sulfuric acid vapors. The equations were solved
using an iterative solution technique with calculations of heat
and mass transfer coefficients and physical properties.
6th International Conference on Machine Learning & Applications (CMLA 2024)ClaraZara1
6th International Conference on Machine Learning & Applications (CMLA 2024) will provide an excellent international forum for sharing knowledge and results in theory, methodology and applications of on Machine Learning & Applications.
Using recycled concrete aggregates (RCA) for pavements is crucial to achieving sustainability. Implementing RCA for new pavement can minimize carbon footprint, conserve natural resources, reduce harmful emissions, and lower life cycle costs. Compared to natural aggregate (NA), RCA pavement has fewer comprehensive studies and sustainability assessments.
NO1 Uk best vashikaran specialist in delhi vashikaran baba near me online vas...Amil Baba Dawood bangali
Contact with Dawood Bhai Just call on +92322-6382012 and we'll help you. We'll solve all your problems within 12 to 24 hours and with 101% guarantee and with astrology systematic. If you want to take any personal or professional advice then also you can call us on +92322-6382012 , ONLINE LOVE PROBLEM & Other all types of Daily Life Problem's.Then CALL or WHATSAPP us on +92322-6382012 and Get all these problems solutions here by Amil Baba DAWOOD BANGALI
#vashikaranspecialist #astrologer #palmistry #amliyaat #taweez #manpasandshadi #horoscope #spiritual #lovelife #lovespell #marriagespell#aamilbabainpakistan #amilbabainkarachi #powerfullblackmagicspell #kalajadumantarspecialist #realamilbaba #AmilbabainPakistan #astrologerincanada #astrologerindubai #lovespellsmaster #kalajaduspecialist #lovespellsthatwork #aamilbabainlahore#blackmagicformarriage #aamilbaba #kalajadu #kalailam #taweez #wazifaexpert #jadumantar #vashikaranspecialist #astrologer #palmistry #amliyaat #taweez #manpasandshadi #horoscope #spiritual #lovelife #lovespell #marriagespell#aamilbabainpakistan #amilbabainkarachi #powerfullblackmagicspell #kalajadumantarspecialist #realamilbaba #AmilbabainPakistan #astrologerincanada #astrologerindubai #lovespellsmaster #kalajaduspecialist #lovespellsthatwork #aamilbabainlahore #blackmagicforlove #blackmagicformarriage #aamilbaba #kalajadu #kalailam #taweez #wazifaexpert #jadumantar #vashikaranspecialist #astrologer #palmistry #amliyaat #taweez #manpasandshadi #horoscope #spiritual #lovelife #lovespell #marriagespell#aamilbabainpakistan #amilbabainkarachi #powerfullblackmagicspell #kalajadumantarspecialist #realamilbaba #AmilbabainPakistan #astrologerincanada #astrologerindubai #lovespellsmaster #kalajaduspecialist #lovespellsthatwork #aamilbabainlahore #Amilbabainuk #amilbabainspain #amilbabaindubai #Amilbabainnorway #amilbabainkrachi #amilbabainlahore #amilbabaingujranwalan #amilbabainislamabad
Final project report on grocery store management system..pdfKamal Acharya
In today’s fast-changing business environment, it’s extremely important to be able to respond to client needs in the most effective and timely manner. If your customers wish to see your business online and have instant access to your products or services.
Online Grocery Store is an e-commerce website, which retails various grocery products. This project allows viewing various products available enables registered users to purchase desired products instantly using Paytm, UPI payment processor (Instant Pay) and also can place order by using Cash on Delivery (Pay Later) option. This project provides an easy access to Administrators and Managers to view orders placed using Pay Later and Instant Pay options.
In order to develop an e-commerce website, a number of Technologies must be studied and understood. These include multi-tiered architecture, server and client-side scripting techniques, implementation technologies, programming language (such as PHP, HTML, CSS, JavaScript) and MySQL relational databases. This is a project with the objective to develop a basic website where a consumer is provided with a shopping cart website and also to know about the technologies used to develop such a website.
This document will discuss each of the underlying technologies to create and implement an e- commerce website.
Forklift Classes Overview by Intella PartsIntella Parts
Discover the different forklift classes and their specific applications. Learn how to choose the right forklift for your needs to ensure safety, efficiency, and compliance in your operations.
For more technical information, visit our website https://intellaparts.com
2. In order to take advantage of and make good use of remote sensing
data, we must be able to extract meaningful information from the
imagery.
This brings us to the topic of discussion of interpretation and
analysis.
3. Interpretation and analysis of remote sensing imagery involves
the identification and/or measurement of various targets in an
image in order to extract useful information about them.
Targets in remote sensing images may be any features or
object which can be observed in an image, and have the
following characteristics
4. Targets may be a point, line or area.
This means that they can have any form, from a bus in a parking lot
or plane on a runway, to a bridge or roadway to a large expanse of
water or a field.
The target must be distinguishable; it must contrast with other
features around it in the image.
5. Much interpretation and identification of targets in remote sensing imagery
is performed manually or visually, by a human interpreter.
In many cases this is done using imagery displayed in a pictorial or
photograph-type format, independent of what type of sensor was used to
collect the data and how the data were collected.
In this case we refer to the data as being in analog format.
Remote sensing images can also be represented in a computer as arrays of
pixels, with each pixel corresponding to a digital number representing the
brightness level of that pixel in the image.
Both analogue and digital imagery can be displayed as black and white
images or as color images.
When remote sensing data are available in digital format, digital
processing and analysis may be performed using a computer.
6. Digital processing may be used to enhance data as a prelude to visual
interpretation.
Digital processing and analysis may also be carried out to automatically
identify targets and extract information completely without manual
intervention by a human interpreter.
However, rarely is digital processing and analysis carried out as a complete
replacement for manual interpretation. Often it is done to supplement of
remote sensing for air photo interpretation.
Method Merit Demerit
Human (Image
Interpretation)
• Interpreter’s knowledge are
available
• Excellent in spatial
information extraction
• Time Consuming
• Individual difference
Computer (Image
processing)
• Short processing time
reproductively
• Extraction of physical
quantities or indices is
possible
• Human Knowledge is
unavailable
• Spatial information
extraction is poor.
7. Each pixel is characterized for
a brief time by some single
value of radiation (e.g.,
reflectance) converted by the
photoelectric effect into
electrons and then to a number
(see illustration at right)
The area coverage of the pixel
(that is, the ground cell area it
corresponds to) is determined
by instantaneous field of view
(IFOV) of the sensor system.
8. Resolution is defined as a measure of the ability of an
optical system or other system to distinguish between
signals that are spatially near or spectrally similar.
9. • Spatial - the size of the field-of-view, e.g. 10 x 10 m.
• Spectral - the number and size of spectral regions the sensor
records data in, e.g. blue, green, red, near-infrared, thermal
infrared, microwave (radar).
• Temporal - how often the sensor acquires data, e.g. every
30 days.
• Radiometric - the sensitivity of detectors to small differences in
electromagnetic energy.
• Spatial - the size of the field-of-view, e.g. 10 x 10 m.
• Spectral - the number and size of spectral regions the sensor
records data in, e.g. blue, green, red, near-infrared, thermal
infrared, microwave (radar).
• Temporal - how often the sensor acquires data, e.g. every
30 days.
• Radiometric - the sensitivity of detectors to small differences in
electromagnetic energy.
GG RR NIRNIRBB
10 m10 m
10 m10 m
JanJan
1515
FebFeb
1515
10. The fineness of detail visible in an image.
◦ (course) Low resolution – smallest features not discernable
◦ (fine) High resolution – small objects are discernable
Factors affecting spatial resolution
◦ Atmosphere, haze, smoke, low light, particles or blurred sensor
systems
Spatial resolution is ability to distinguish between two closely
spaced objects on an image.
Spatial resolution depends on the field of view (FOV) , altitude and
viewing angle of a sensor.
The detail discernible in an image is dependent on the spatial
resolution of the sensor and refers to the size of the smallest possible
feature that can be detected.
11. Spatial resolution of passive sensors depends primarily on their
instantaneous field of view (IFOV).
The IFOV is the angular cone of visibility of the sensor and determines
the area on the earth’s surface which is seen from a given altitude at
one particular moment of time.
The IFOV is the angular cone of visibility of the sensor and determines
the area of visibility of the sensor and determines the area on the earth
surface.
The IFOV may also be defined as the area on the ground, which viewed
by a single instrument from a given altitude at any given instant of
time.
This area on the ground is called the resolution cell and determines a
sensor spatial resolution.
12.
13. The term spectral resolution refers to the width of
spectral bands that a satellite imaging system can
detect. Often satellite imaging systems are multi-
spectral meaning that they can detect in several discrete
bands, it is the width of these bands that spectral
resolution refers too. The narrower the bands, the
greater the spectral resolution.
14. Spectral resolution describes the ability of a
sensor with to define fine wavelength intervals.
The finer the spectral resolution , the narrower the
wavelength range for a particular channel or band.
15. Resolution refers to the dimension spectral and number of
wavelength regions (or band) in the EM spectrum to which the
sensor is sensitive.
Based on the spectral resolution the sensors fall into the
following groups: Broad-band, Narrow band, spectral and
hyper spectral sensors.
It uses advanced multichannel sensors.
Detect hundreds of very narrow spectral bands throughout the
visible near infrared and mid-infrared portions of the EM
spectrum.
Their very high spectral resolution facilities fine
discrimination between different targets based on their
spectral response in each of the narrow bands.
17. Temporal resolution is a measure of how often data are
obtained for the same area (i.e. how often an area can
be revisited)
The temporal resolution varies from hours for some
systems to about 20 days to others.
High temporal resolution: Daily or twice daily
18. June 1, 2006June 1, 2006June 1, 2006June 1, 2006 June 17, 2006June 17, 2006June 17, 2006June 17, 2006 July 3, 2006July 3, 2006July 3, 2006July 3, 2006
Remote Sensor Data AcquisitionRemote Sensor Data AcquisitionRemote Sensor Data AcquisitionRemote Sensor Data Acquisition
16 days16 days16 days16 days
19. The radiometric resolution of an imaging system
describes its ability to discriminate very slight
difference in energy.
Radiometric resolution is a measure of the sensitivity
of a sensor to differences in the intensity of the
radiation measured in sensor.
Radiometric resolution is a measure of how many grey
levels are measured between pure black and pure white.
The radiometric resolution measured in bit.
E.g. 1 bit system (2^1=2) only two radiation levels and
2-bit system measures four levels etc.
21. Radiometric resolution, or radiometric sensitivity
refers to the number of digital levels used to express
the data collected by the sensor. In general, the greater
the number of levels, the greater the detail of
information.
22. Suppose you have a digital
image which has a
radiometric resolution of 6
bits. What is the maximum
value of the digital number
which could be represented
in that image?
23. The number of digital values possible in an
image is equal to the number two (2 - for
binary coding in a computer) raised to the
exponent of the number of bits in the image.
The number of values in a 6-bit image
would be equal to 26
= 2 x 2 x 2 x 2 x 2 x 2 =
64. Since the range of values displayed in a
digital image normally starts at zero (0), in
order to have 64 values, the maximum value
possible would be 63.
24. The radiometric
resolution of an
imaging system
describes its ability to
discriminate very slight
differences in energy
The finer the
radiometric resolution
of a sensor, the more
sensitive it is to
detecting small
differences in reflected
or emitted energy.
25. Analysis of remote sensing imagery involves the identification
of various targets in an image and those targets may be
environmental or artificial features which consists of points,
lines and areas.
Targets may be defined in terms of the way they reflect or
emit radiation.
This radiation is measured and recorded by a sensor and
ultimately is depicted as an image product such as an air photo
or a satellite image.
Recognizing targets is the key to interpretation and
information extraction. Basic elements of image interpretation
are:
26. Tone
Shape
Size
Pattern
Texture
Shadow
Site, Situation and Association
27.
28. It refers to the relative brightness or color of objects in
an image.
Generally, tone is the fundamental element for
distinguishing between different targets or features.
Variations in tone also allows the elements of shape,
texture, and pattern of objects to be distinguished.
29. It refers to the general form, structure, outline of
individual objects.
Shape can be very distinctive clue for interpretation
Straight edge shape typically represents urban or
agricultural targets, while natural features such as
forest edge more irregular in shape, except where man
has created a road or clear cuts.
Farm or crop land irrigated systems would appear as
circular shape.
30. Size of objects in an image is a function of scale
It is important to assess the size of a target relative to
other objects in a scene as well as the absolute size, to
aid in the interpretation of that target.
A quick approximation of target size can direct
interpretation to an approximate result more quickly.
For e.g. if an interpreter had to distinguish zones of
land use and had identified an area with a number of
buildings in it, large buildings such as factories or
warehouses would suggest commercial property,
whereas small buildings would indicate residential use.
31. Pattern refers to the spatial arrangement of visibility
discernible (detectable) objects.
Typically an orderly repetition of similar tones and
textures will produce a distinctive and ultimately
recognizable pattern.
Orchards with evenly spaced trees and urban streets
with regularly spaced houses are good examples of
pattern.
32. It refers to the arrangement and frequency of tonal
variations in particular areas of an image.
Rough texture would consists of mottled tone where
gray levels change abruptly in small area, where as
smooth texture would have very little tonal variation.
Smooth texture are most often the result of uniform,
even surfaces, such as field or grass lands.
A target with a rough surface and irregular structure
such as forest canopy, results in a rough textured
appearance.
Texture is one of most important element for
distinguishing features in RADAR imagery.
33. It is also very helpful in interpretation as it may provide
an idea of profile and relative height of target which
may make identification easier.
However, shadows can also reduce or eliminate
interpretation in their area of influence, since target
within shadow are much less detectable from their
surrounding.
Shadow is also helpful for enhancing or identifying
topography and landform, particularly in RADAR
imagery.
34. It takes into account the relationship between other
recognizable objects or features in proximity to the
target of interest.
The identification of features that one would expect to
associate with other features may provide information
to facilitate identification.
For example, commercial properties may be associated
with proximity to the major transportation routes,
where as residential areas would be associated with
schools, playgrounds, sport field. Other example a lake
is associated with boats, a marine and adjacent
recreational land.
35. The criteria of image interpretation is as follows:
Image reading is an element in the form image interpretation.
It corresponds to simple identification of objects using such
elements as shape, size, pattern, tone, texture, color, shadow
and other associated relationship.
Image measurement is the extraction of physical quantities
such as length, height, location, density, temperature and so
on, by using reference data or calibration data.
Image analysis is the understanding of the relationship
between interpreted information and the actual status or
phenomenon and to evaluate the situation.
The image interpretation process is clearly shown in figure
below.