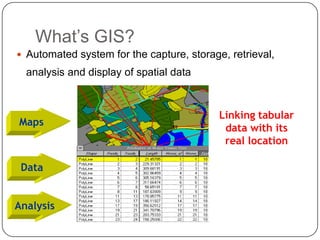
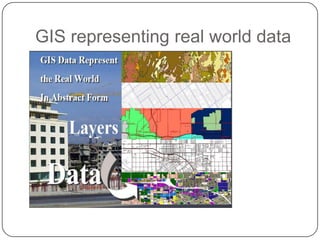
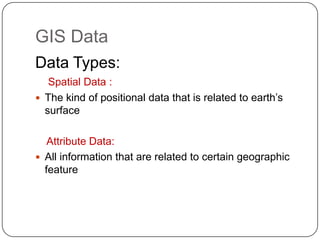
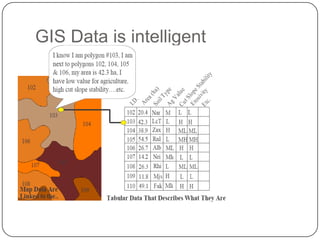
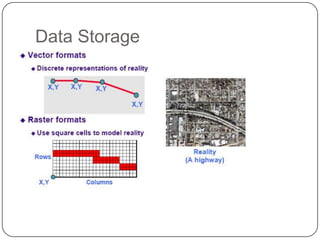
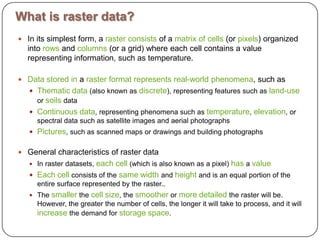
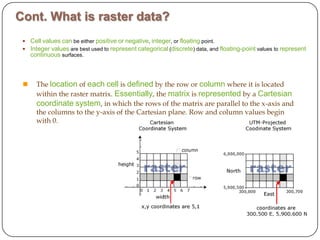
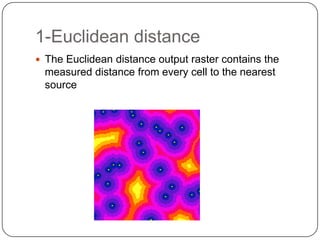
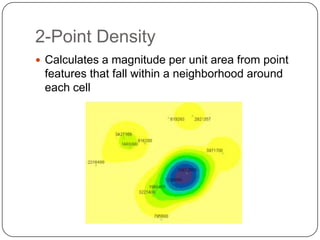
This document provides an overview of GIS, raster data formats, and spatial analysis tools. It defines GIS as an automated system for capturing, storing, analyzing and displaying spatial data linked to tabular data on maps. Raster data represents real-world phenomena through a matrix of cells, with each cell storing a value like elevation or satellite imagery. Spatial analysis tools in GIS like Euclidean distance and point density perform cell-based raster analyses, calculating distances from raster cells to points or densities of points within neighborhoods.
3. What’s GIS? Automated system for the capture, storage, retrieval, analysis and display of spatial data Linking tabular data with its real location Maps Data Analysis
5. Abstracting Real World Objects into Layers Buildings Administrative Boundaries Roads Utilities Land Use Soil
6. GIS Data Data Types: Spatial Data : The kind of positional data that is related to earth’s surface Attribute Data: All information that are related to certain geographic feature
9. What is raster data? In its simplest form, a rasterconsists of a matrixofcells (or pixels) organized into rows and columns (or a grid) where each cell contains a value representing information, such as temperature. Datastoredin a rasterformatrepresentsreal-worldphenomena, such as Thematicdata (also known as discrete), representing features such as land-use or soils data Continuousdata, representing phenomena such as temperature, elevation, or spectral data such as satellite images and aerial photographs Pictures, such as scanned maps or drawings and building photographs General characteristics of raster data In raster datasets, eachcell (which is also known as a pixel) has a value Eachcell consists of the samewidth and height and is an equal portion of the entire surface represented by the raster.. The smaller the cellsize, the smoother or moredetailed the raster will be. However, the greater the number of cells, the longer it will take to process, and it will increase the demand for storagespace.
10.
11. 1-Euclidean distance The Euclidean distance output raster contains the measured distance from every cell to the nearest source
12. 2-Point Density Calculates a magnitude per unit area from point features that fall within a neighborhood around each cell