Raster data consists of grids of cells that store values representing features like elevation or pixel color. Each cell has a single value and raster data can represent images through pixel color values. Raster data is stored in file formats like TIFF or directly in databases.
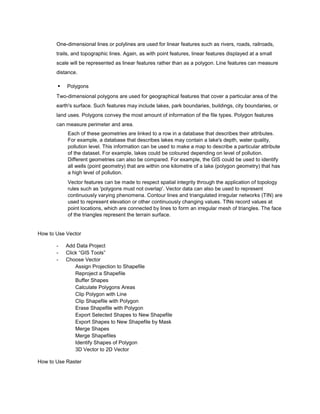
Vector data represents geographic features as points, lines, and polygons linked to attribute data. Points are zero-dimensional, lines are one-dimensional, and polygons are two-dimensional and can measure area. Vector data respects topological rules and can model continuously varying surfaces through techniques like contours and TINs. GIS tools allow users to perform tasks like buffering shapes, merging data, and clipping layers.


![Getting Started with Apache Spark: Big Data Made Simple [Free Meetup]](https://cdn.slidesharecdn.com/ss_thumbnails/apachesparkgettingstarted-260203175547-8361bcc3-thumbnail.jpg?width=640&height=640&fit=bounds)


