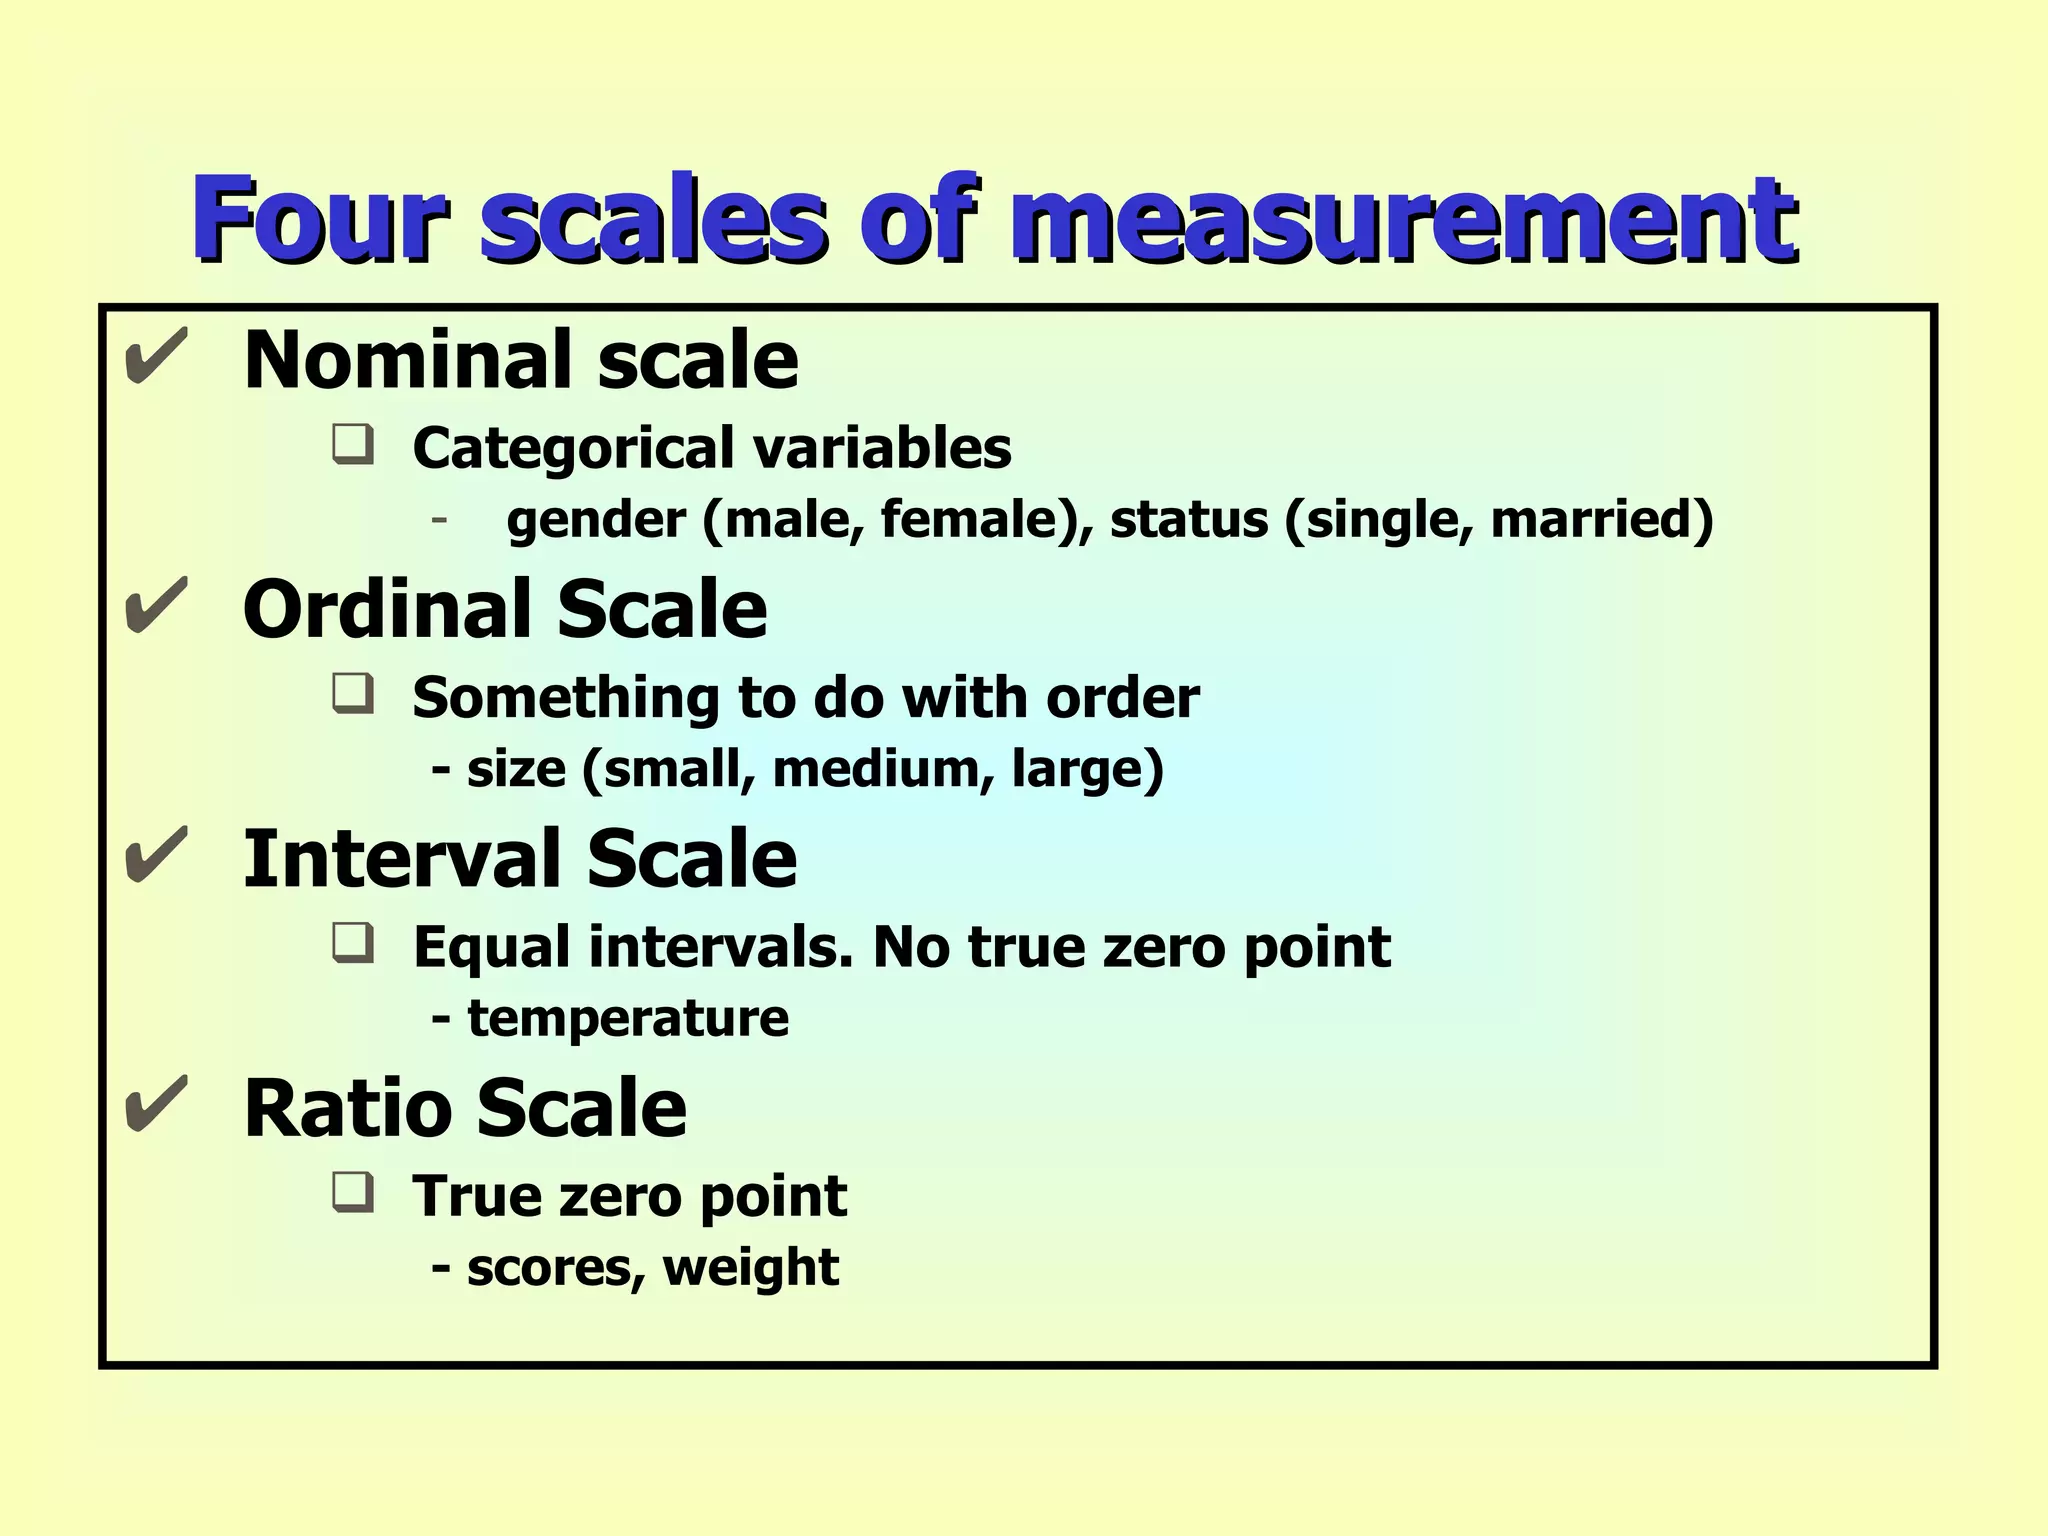
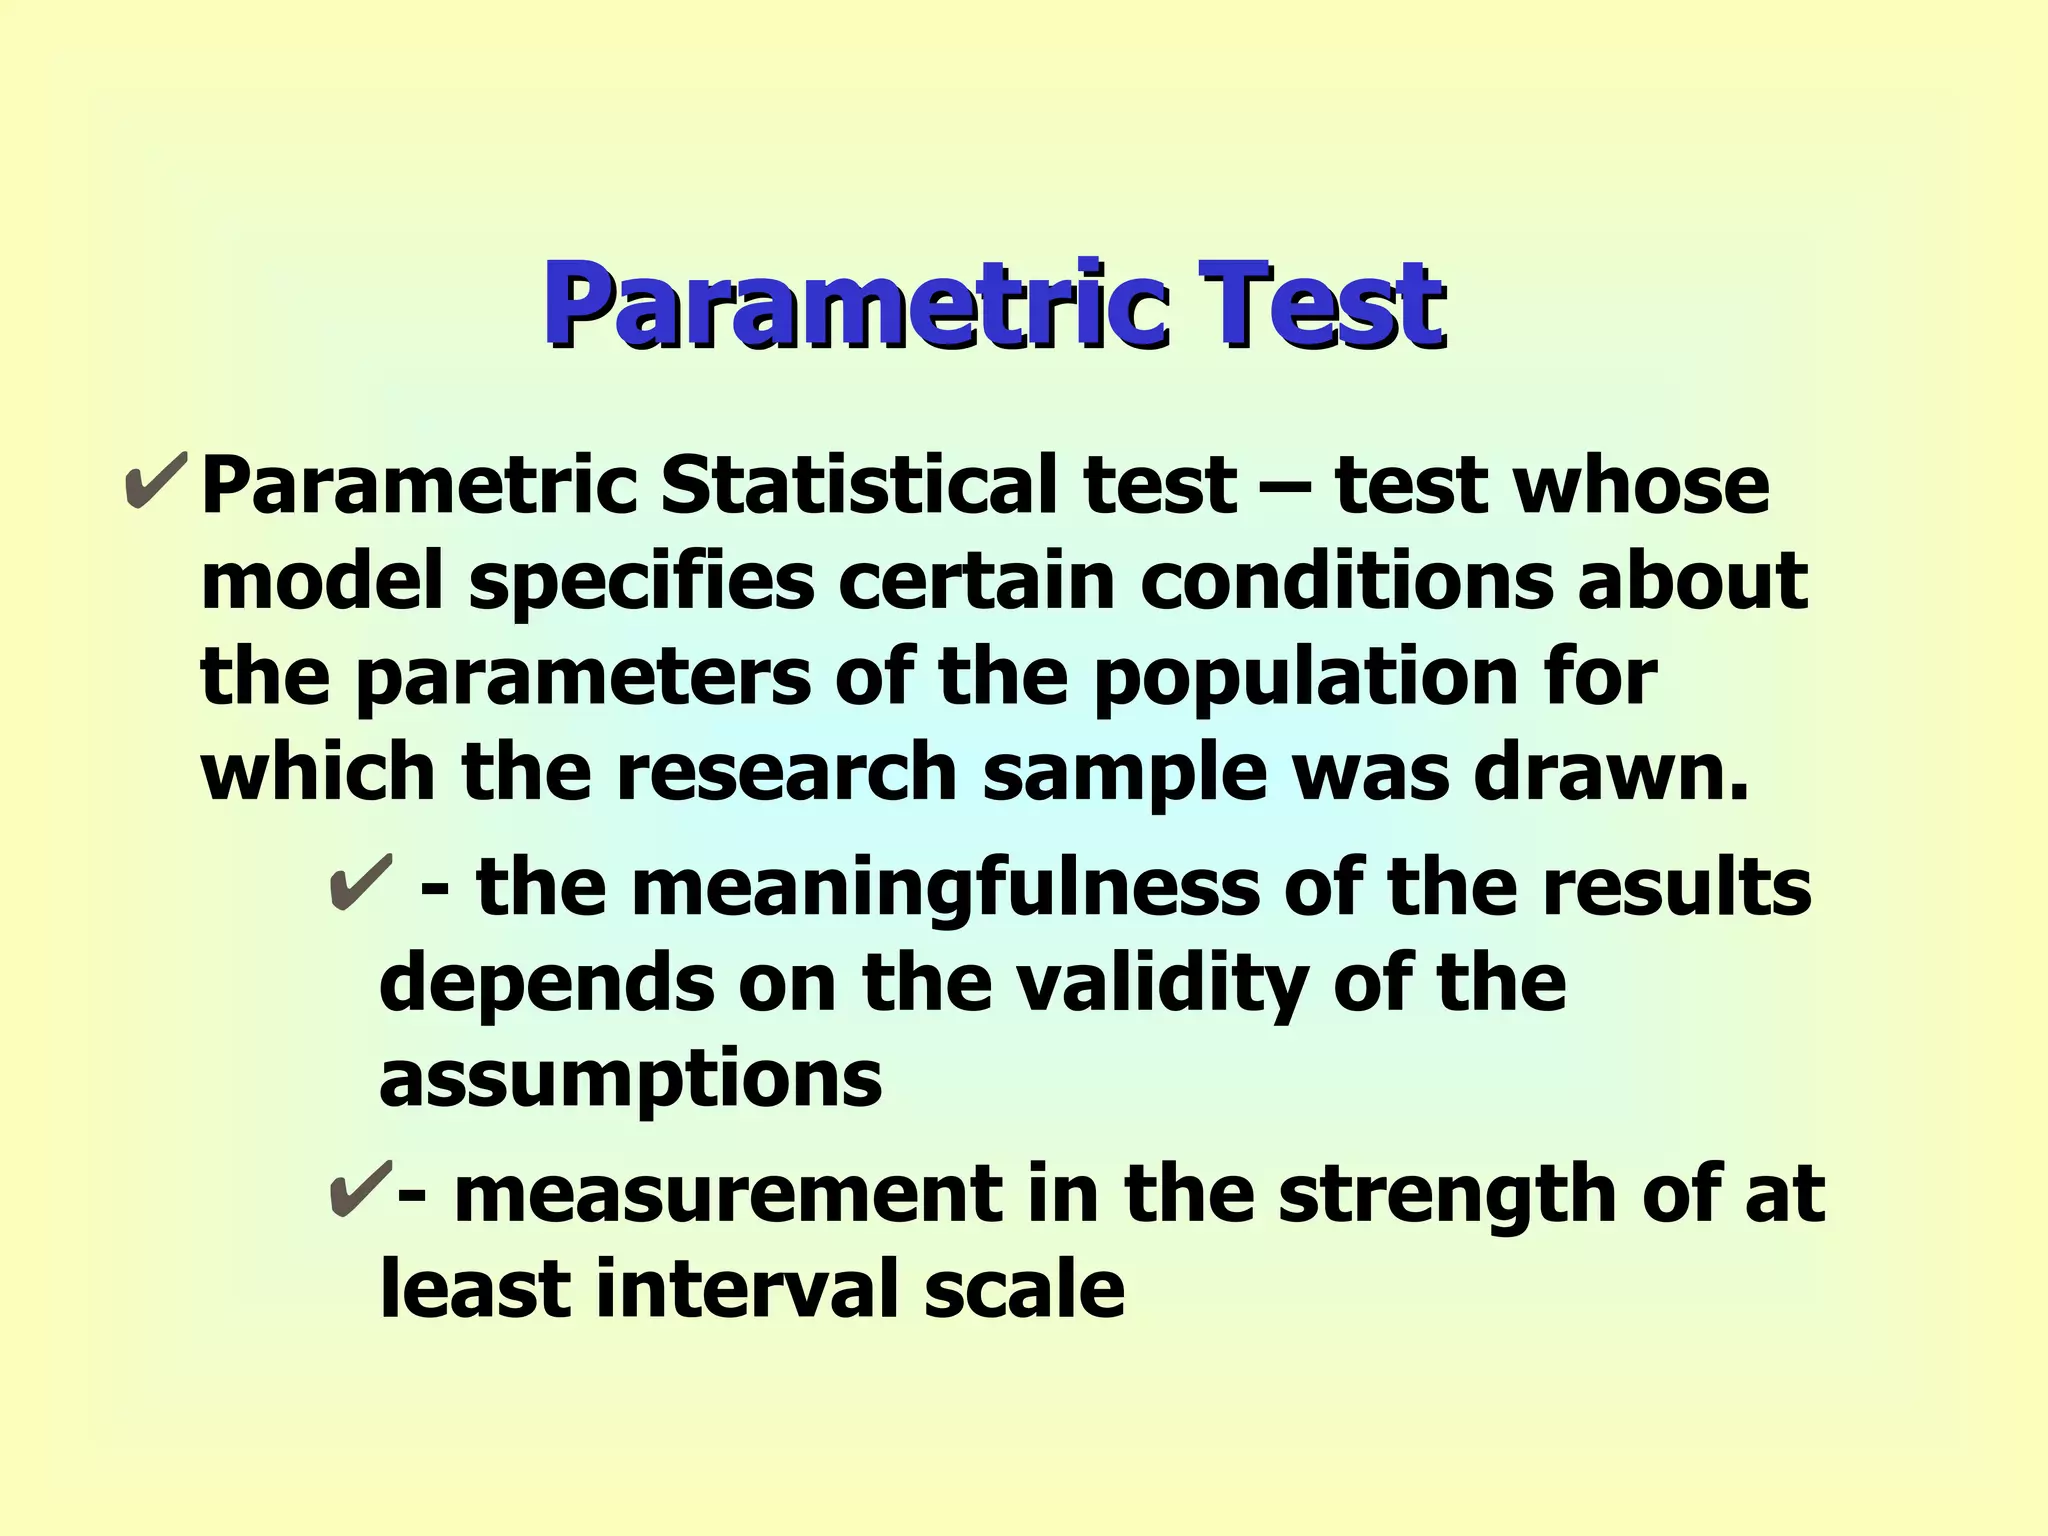
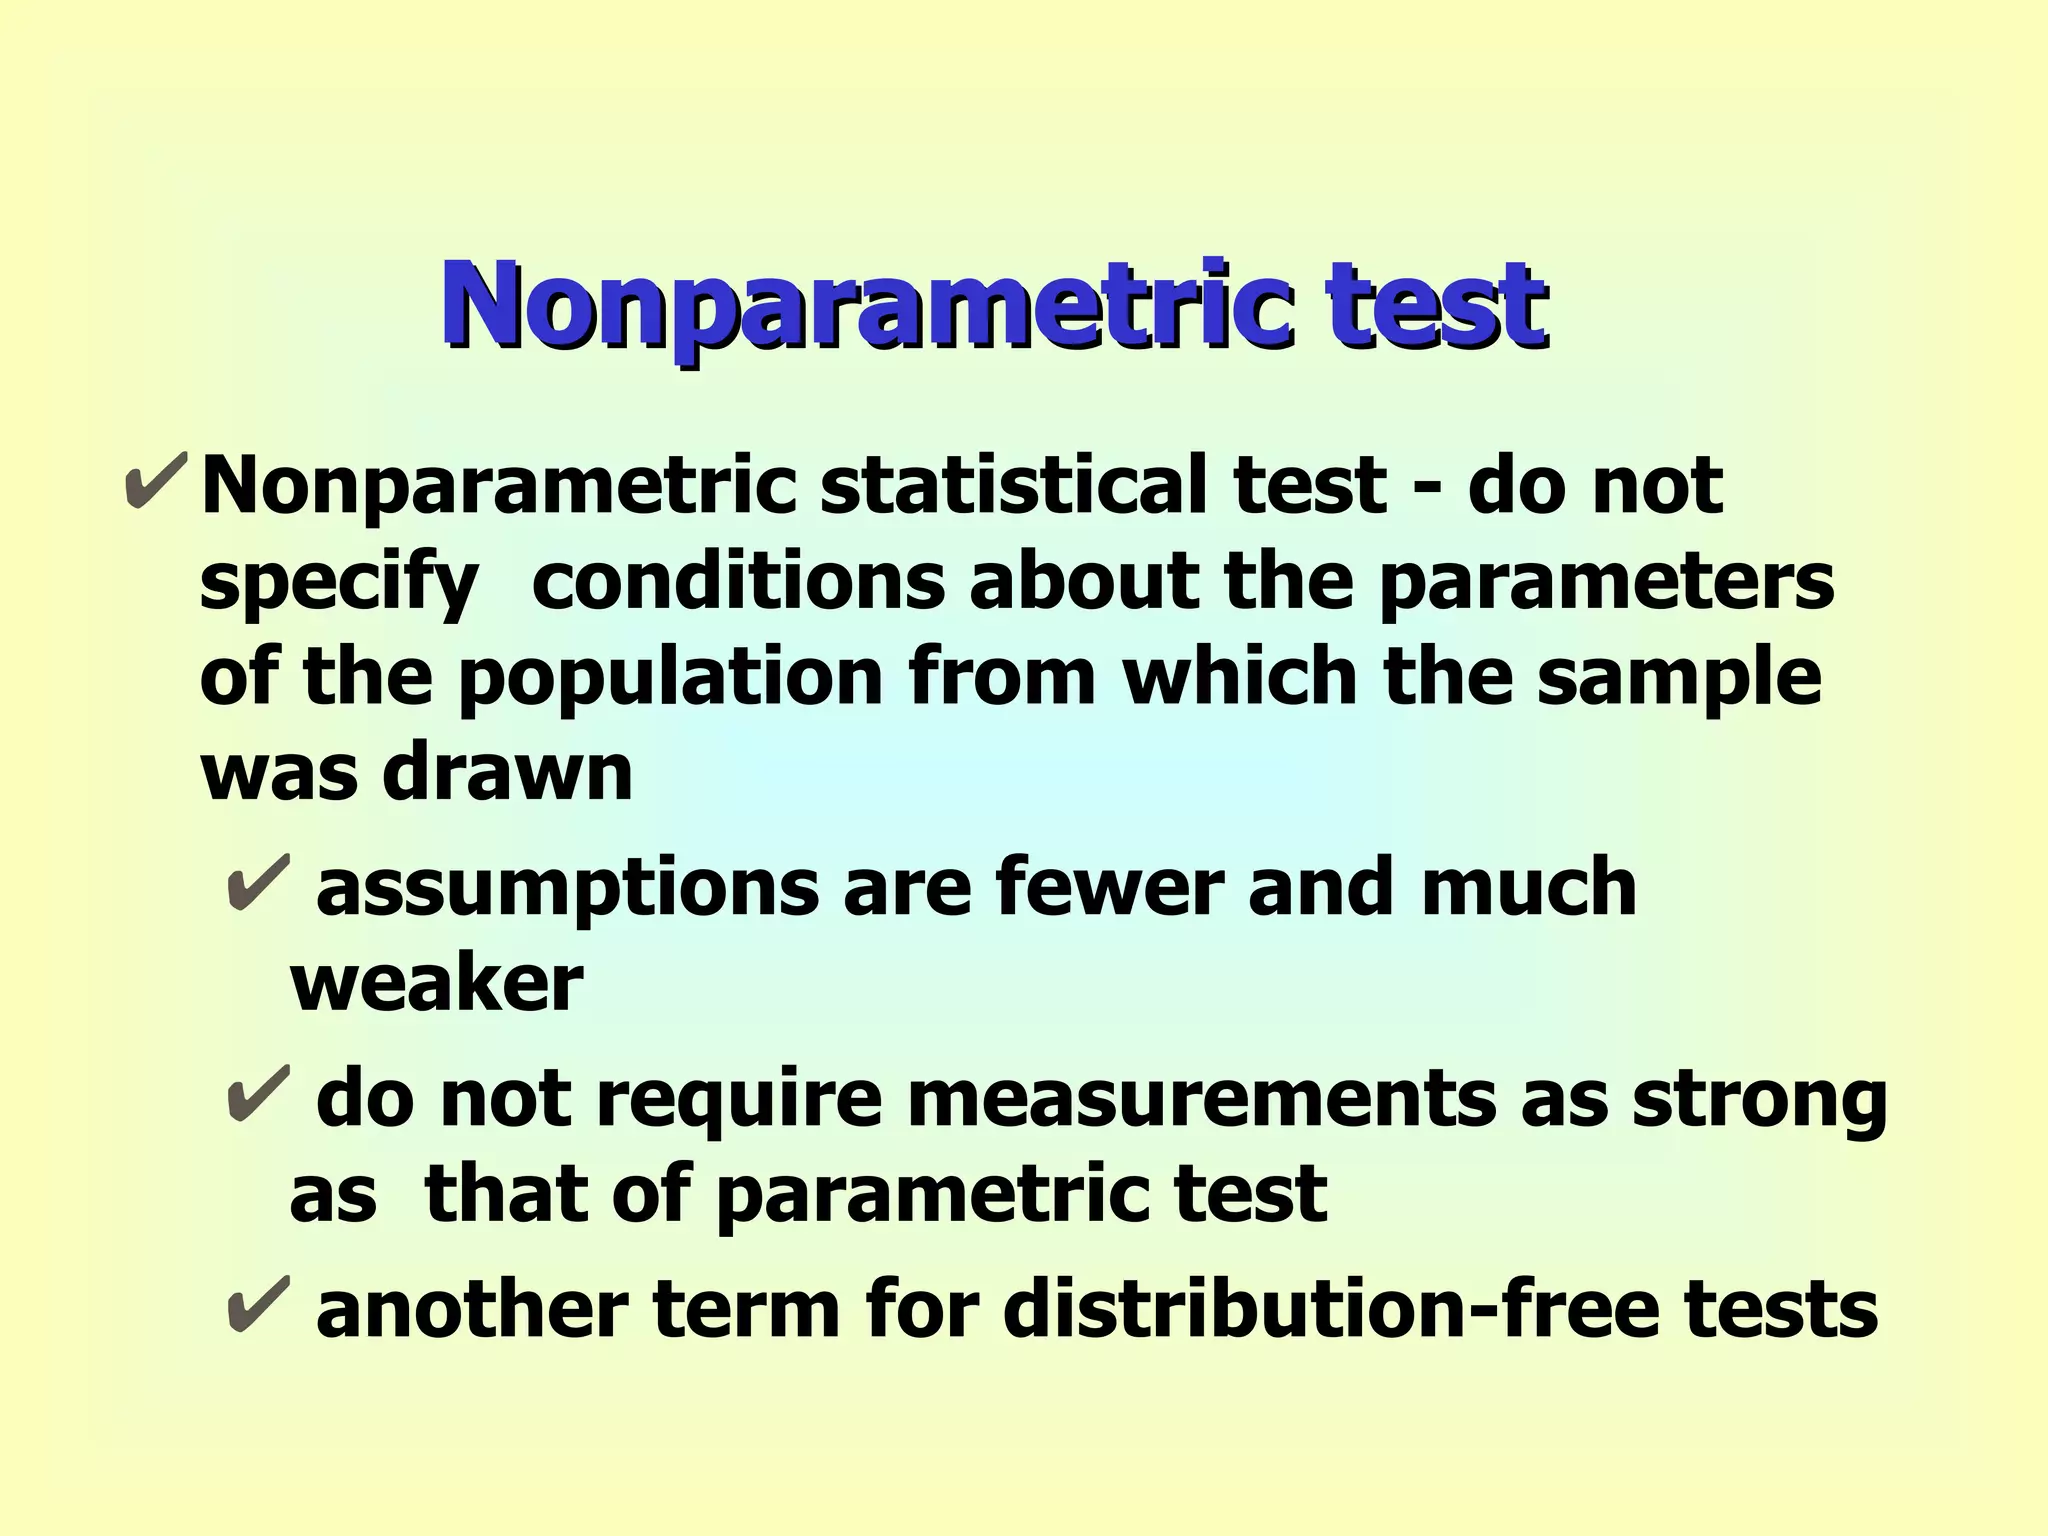
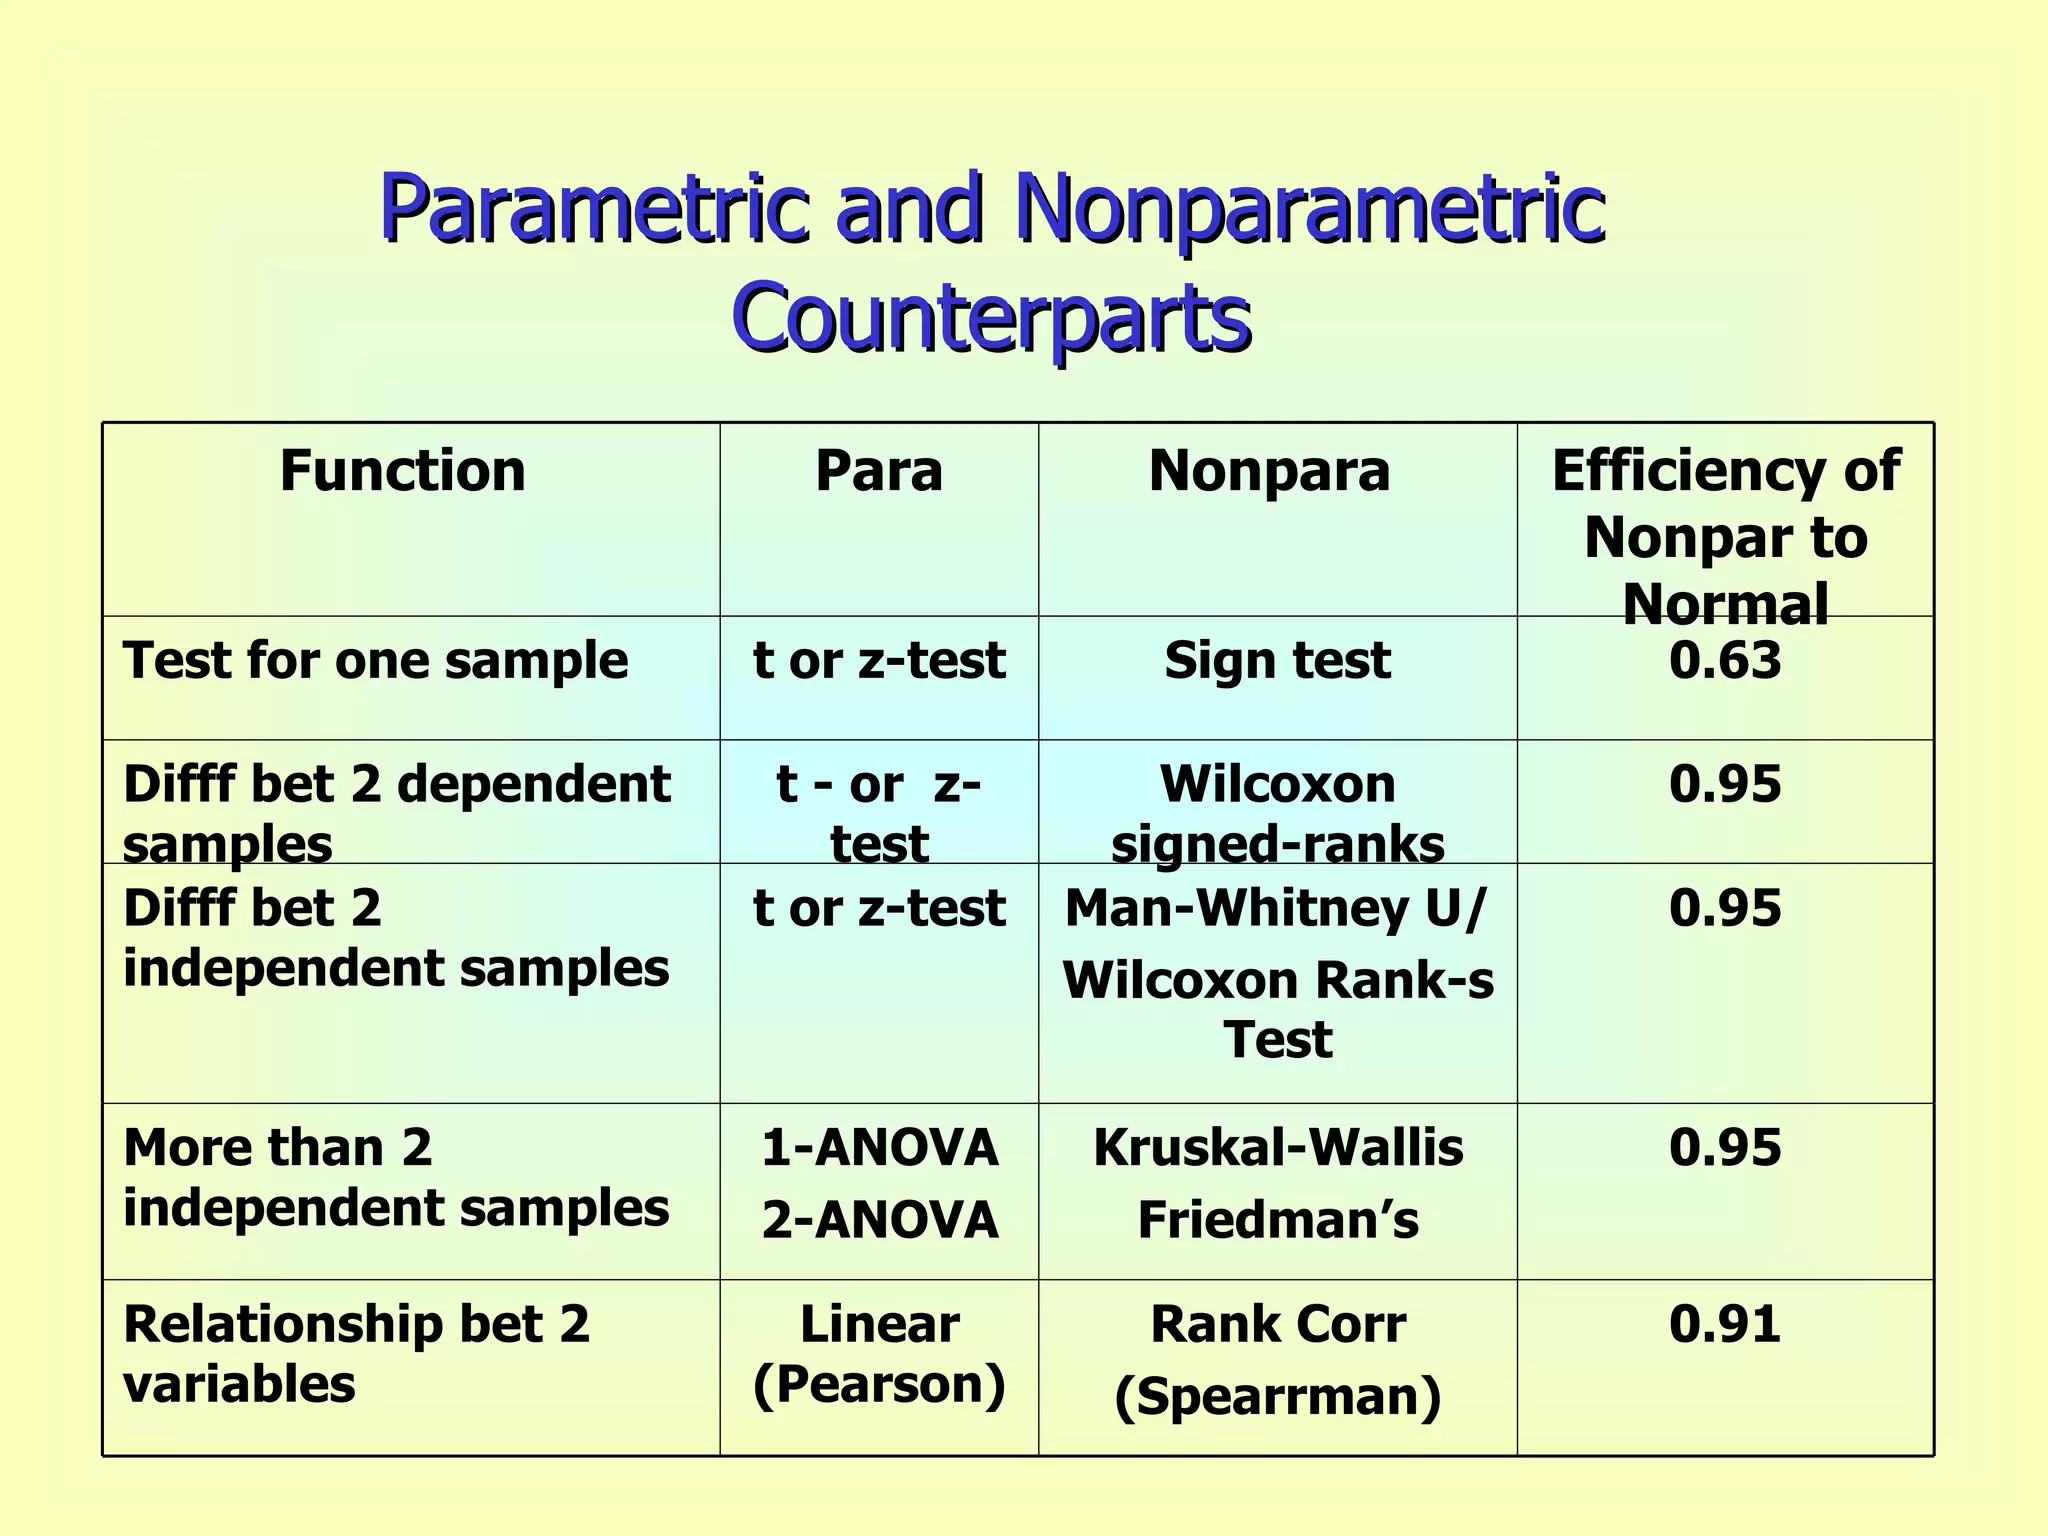
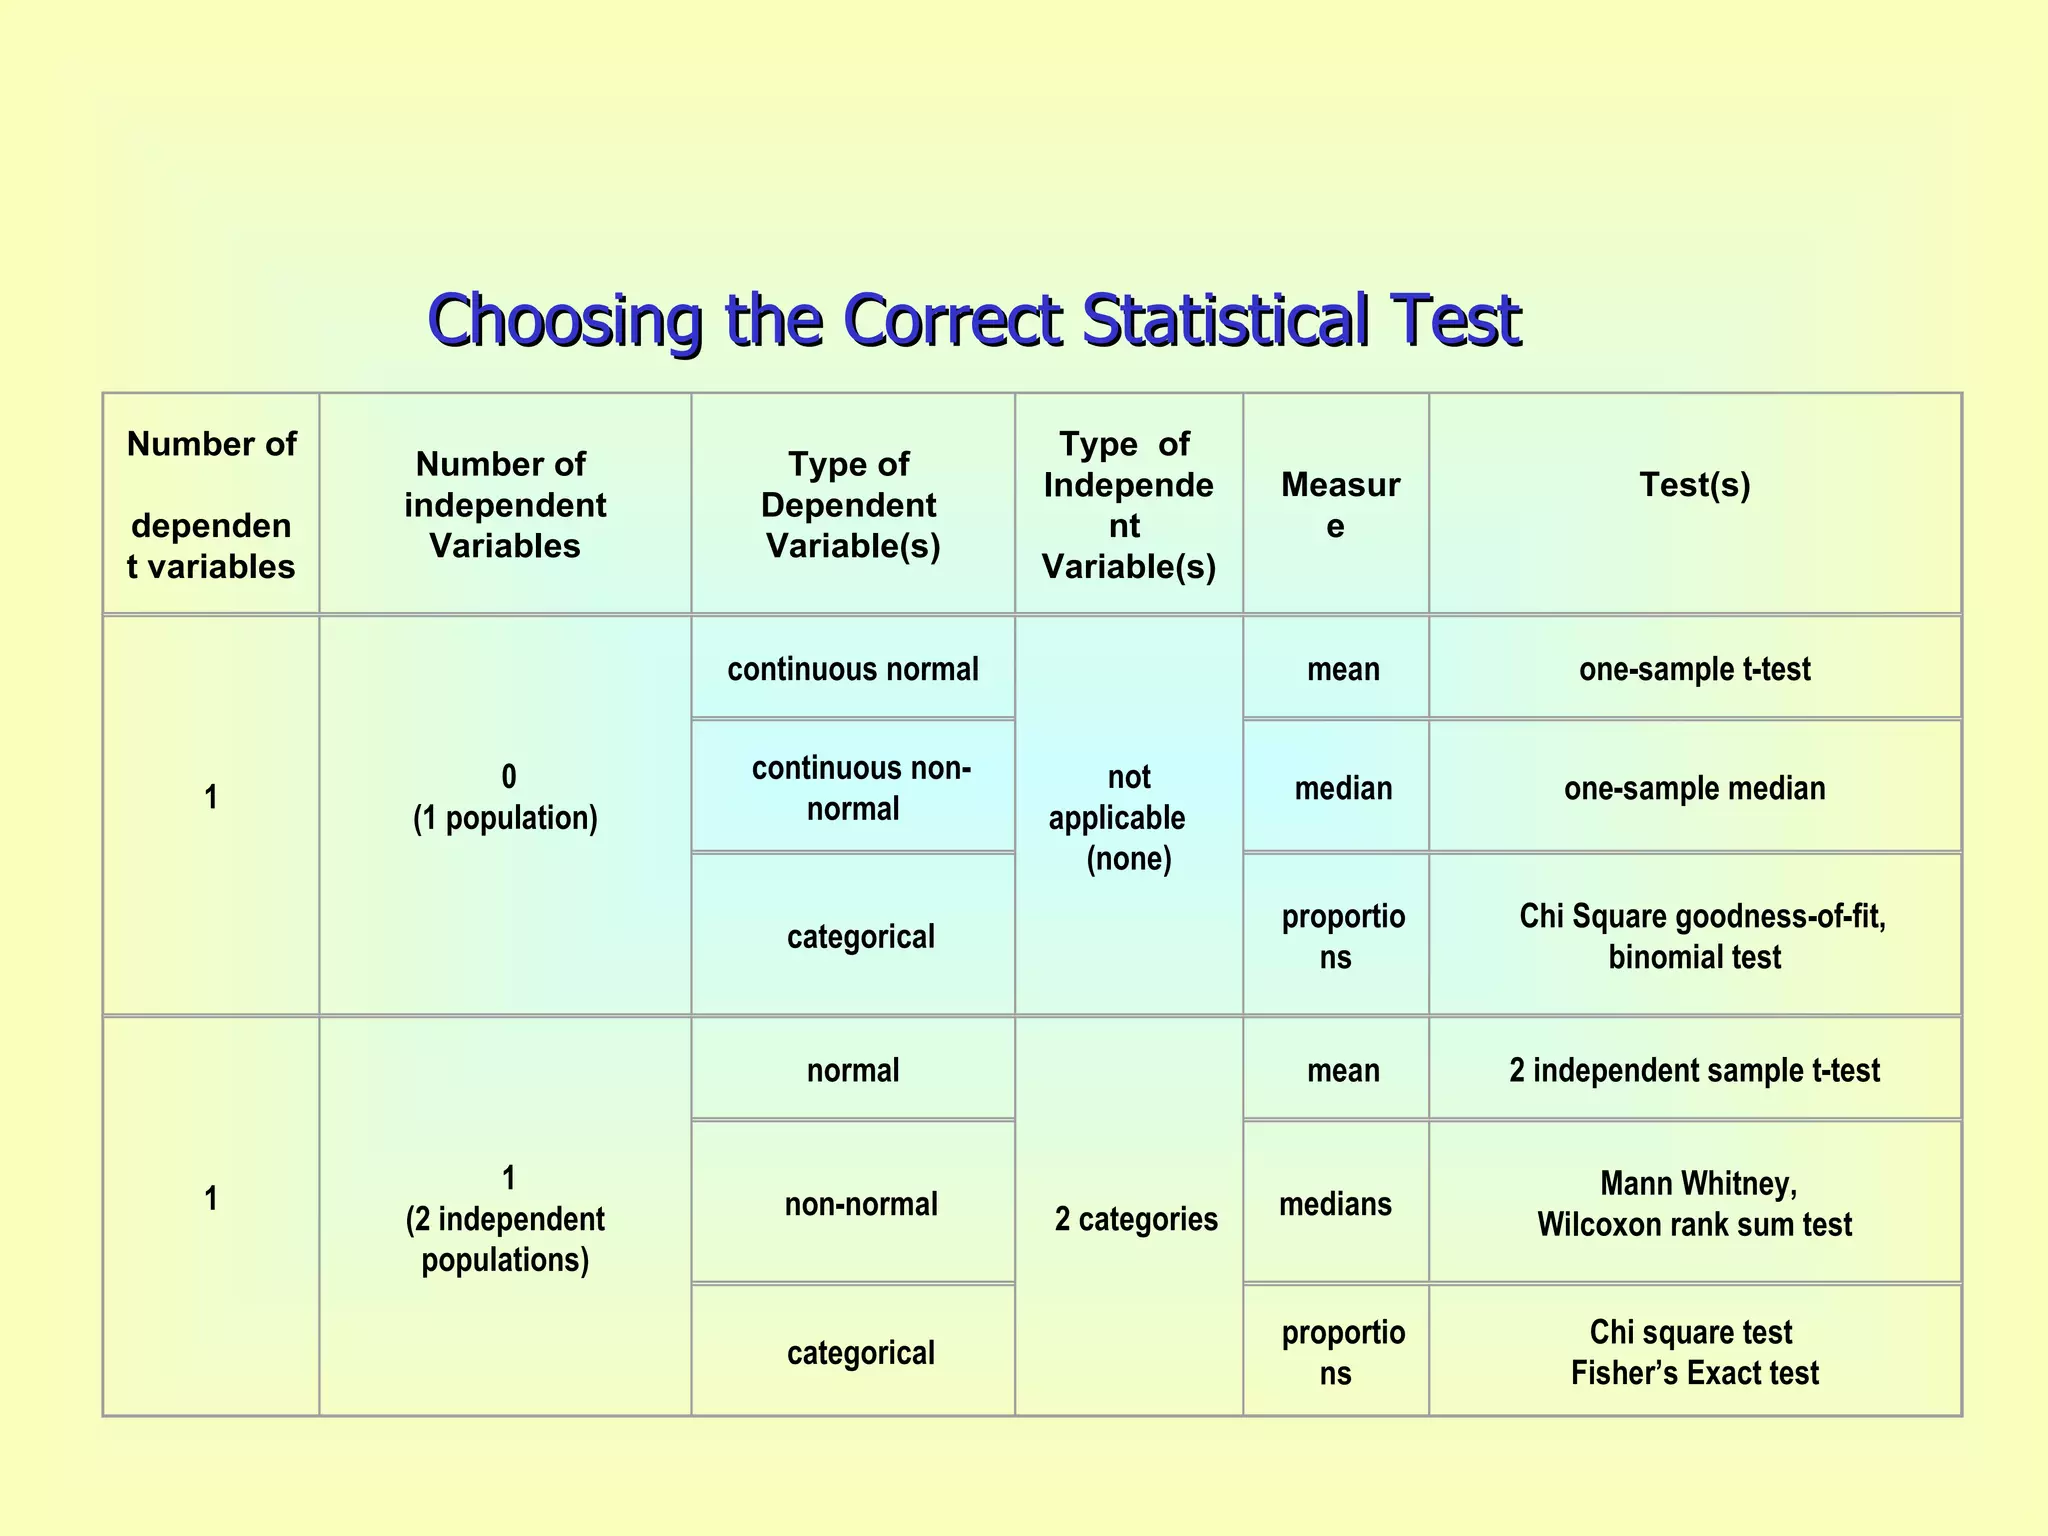
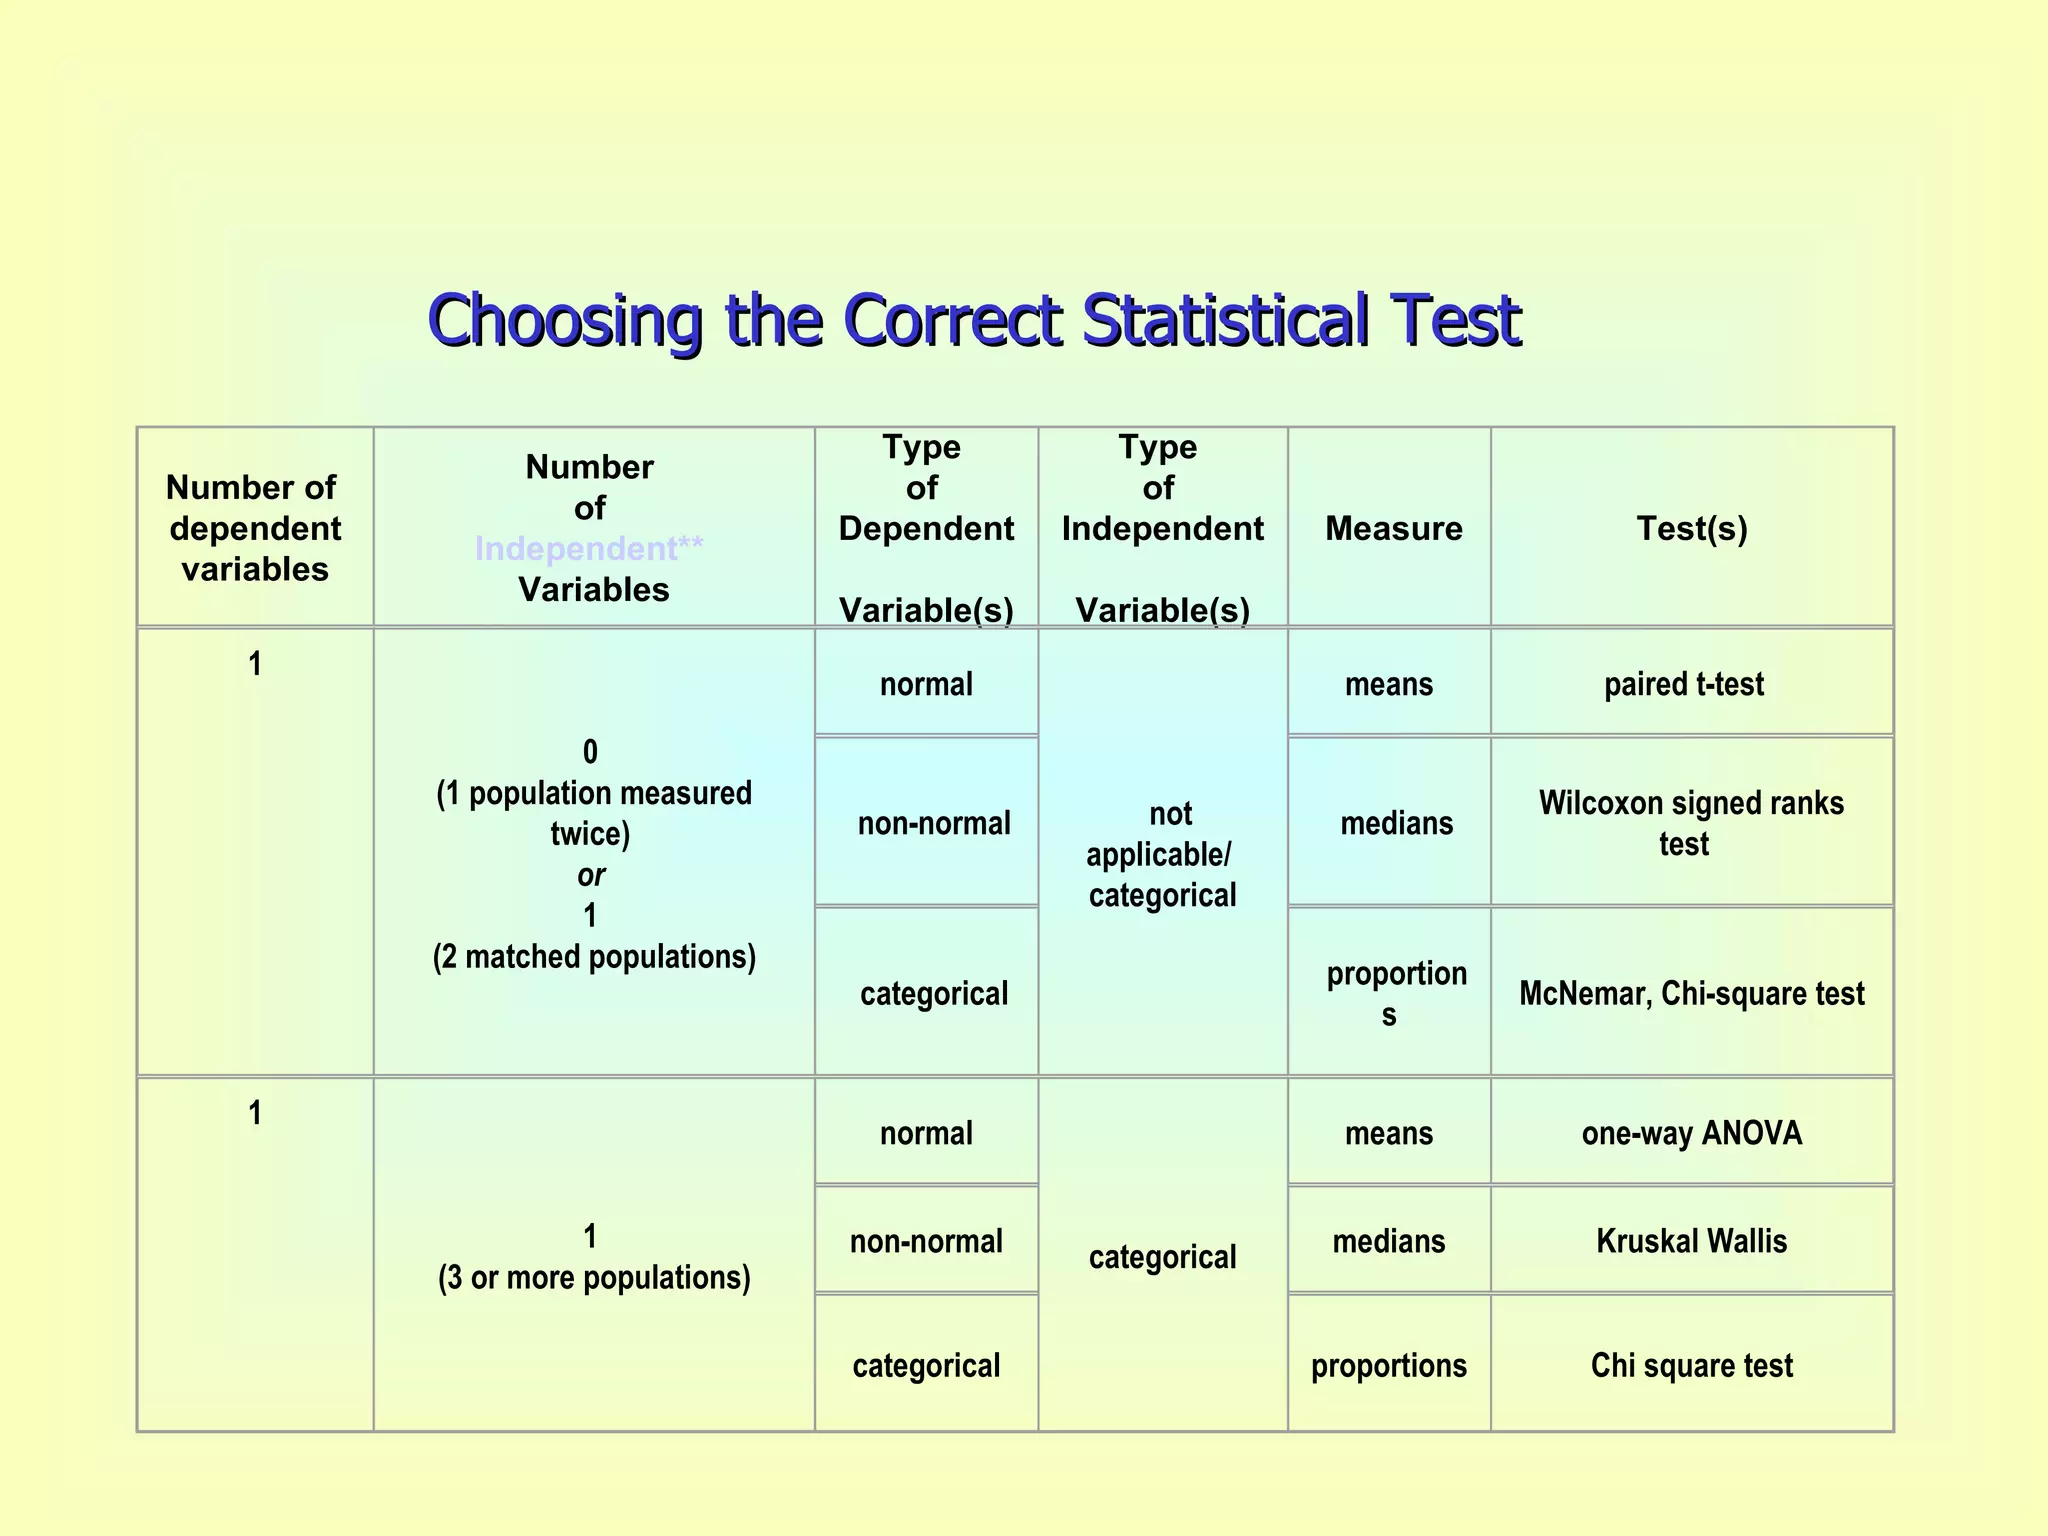
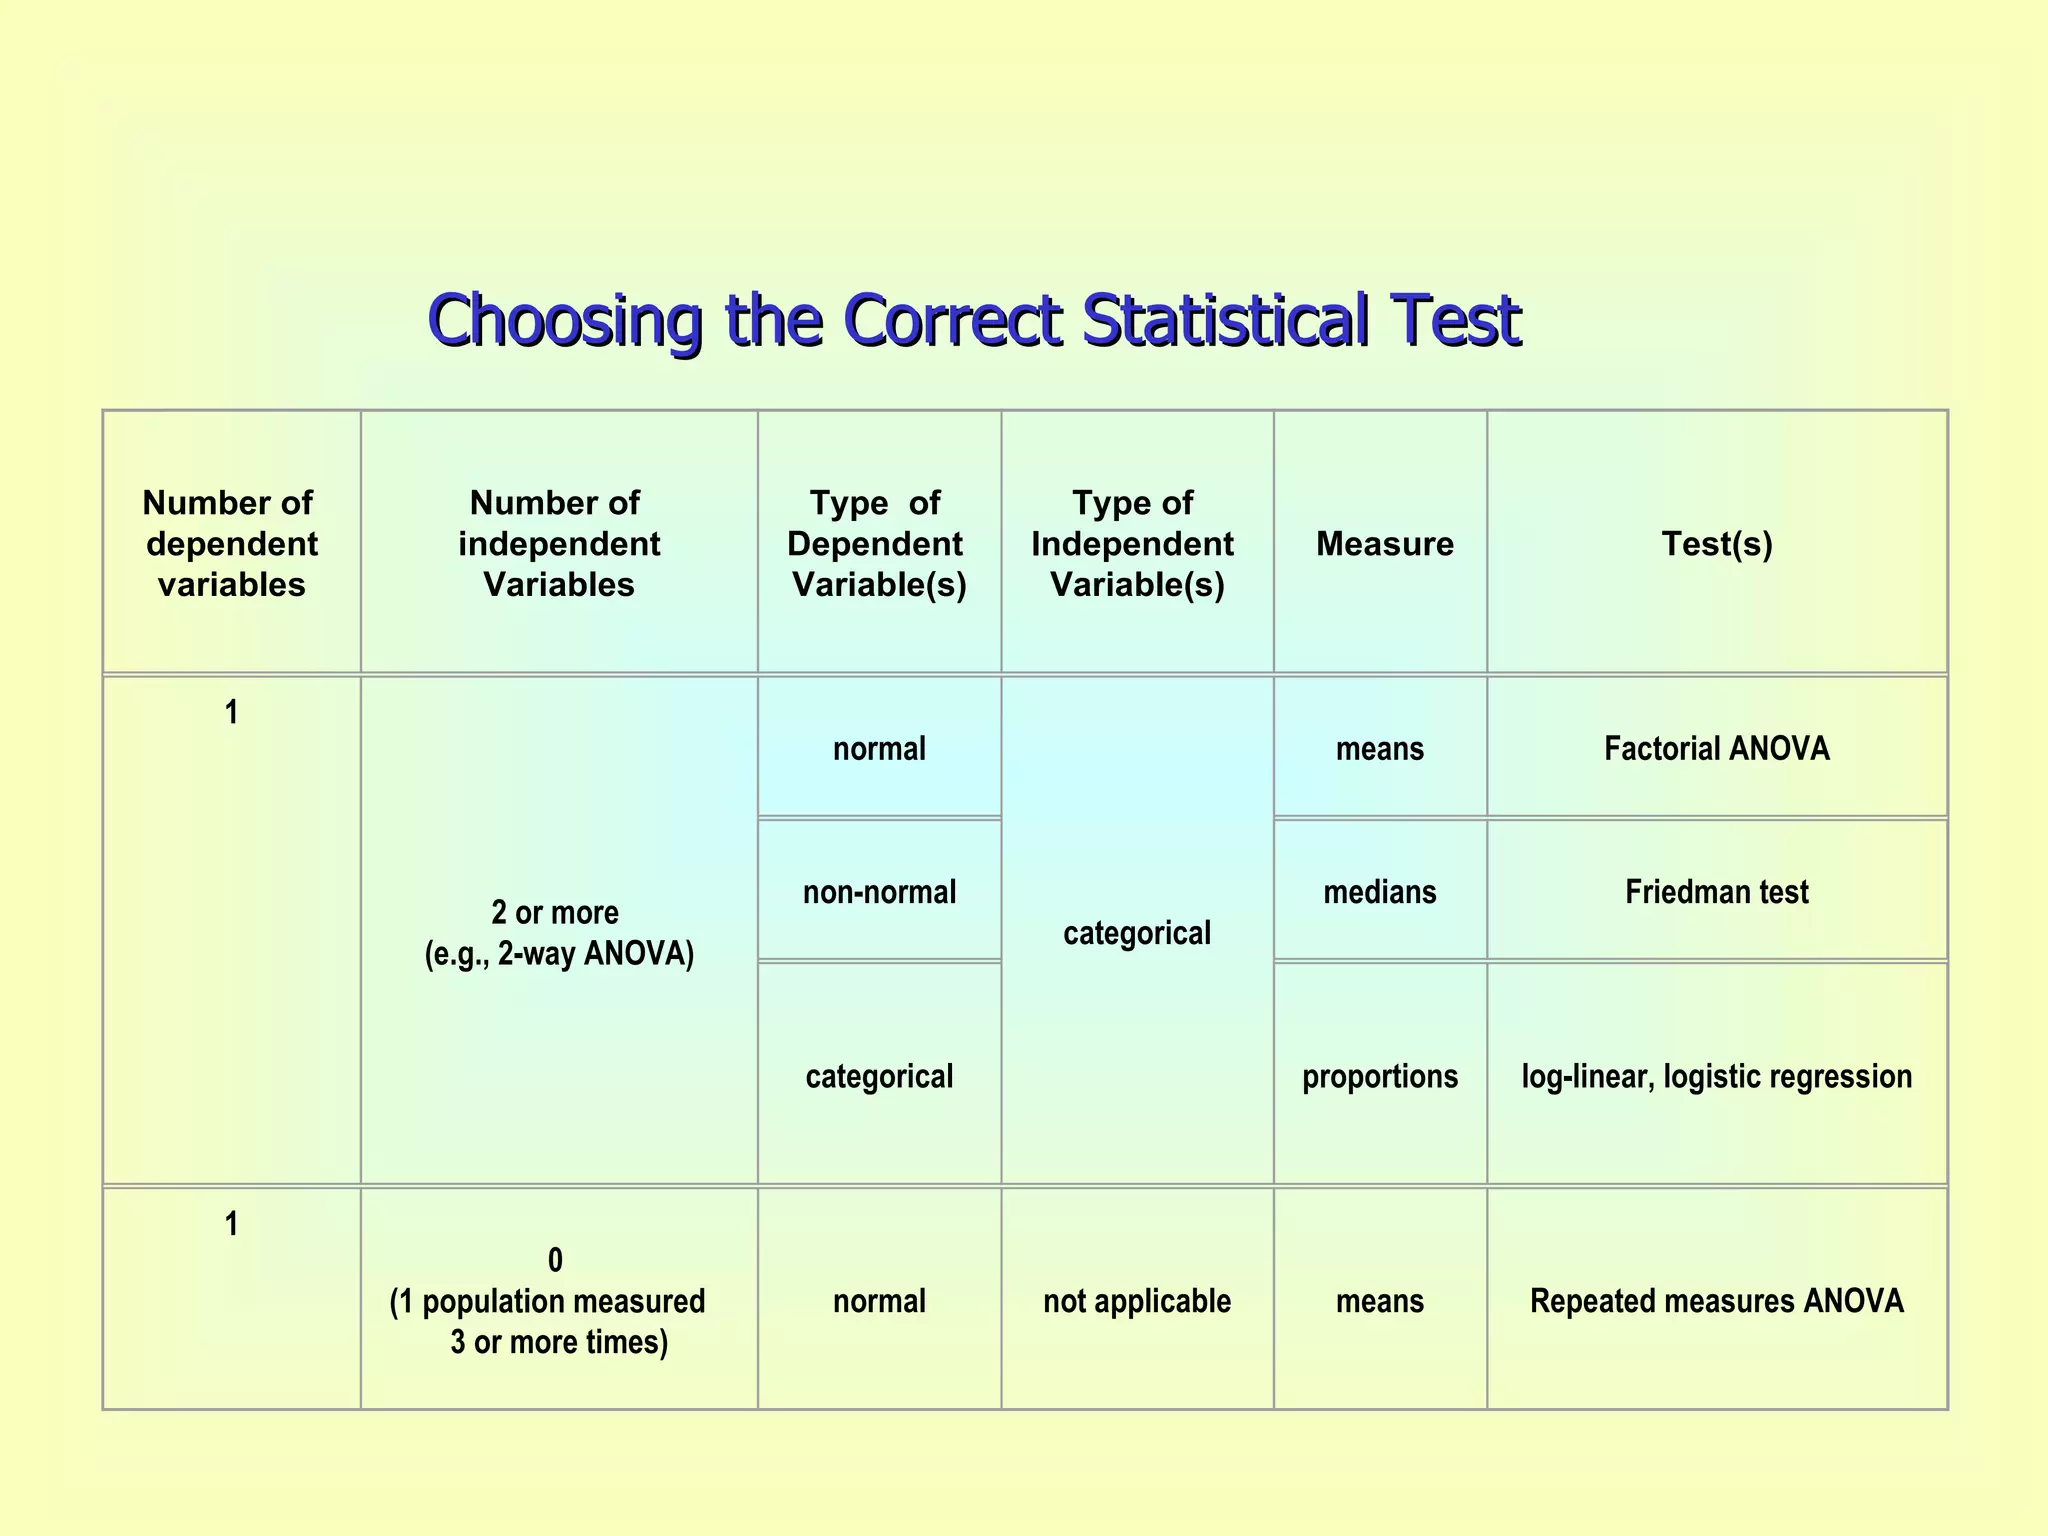
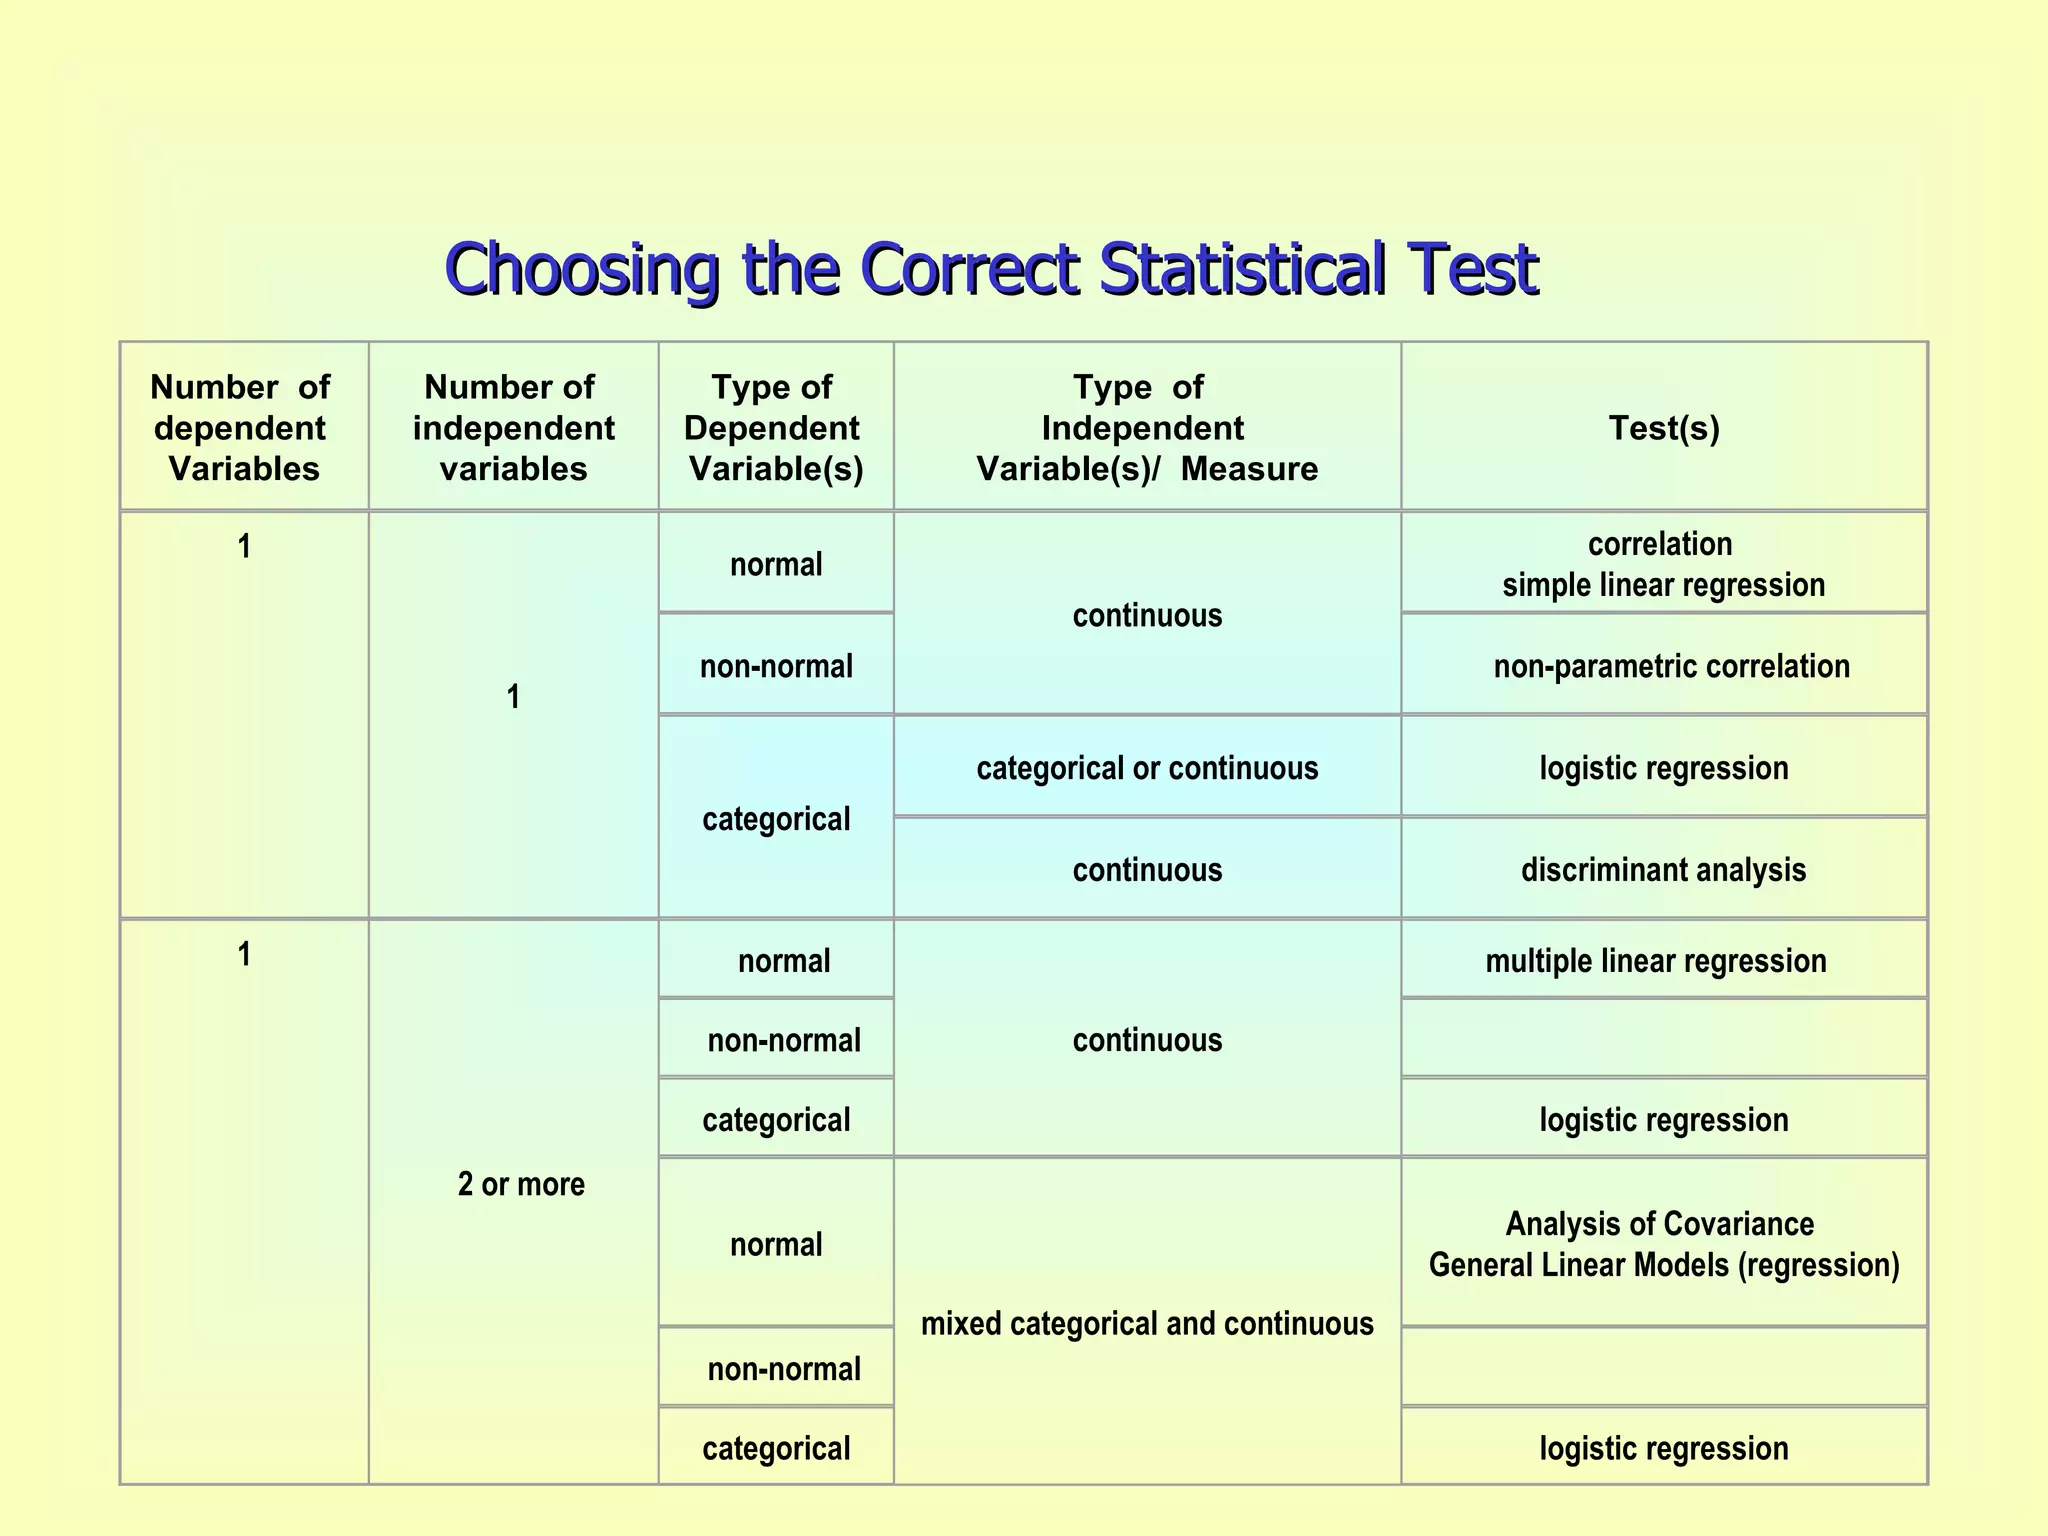
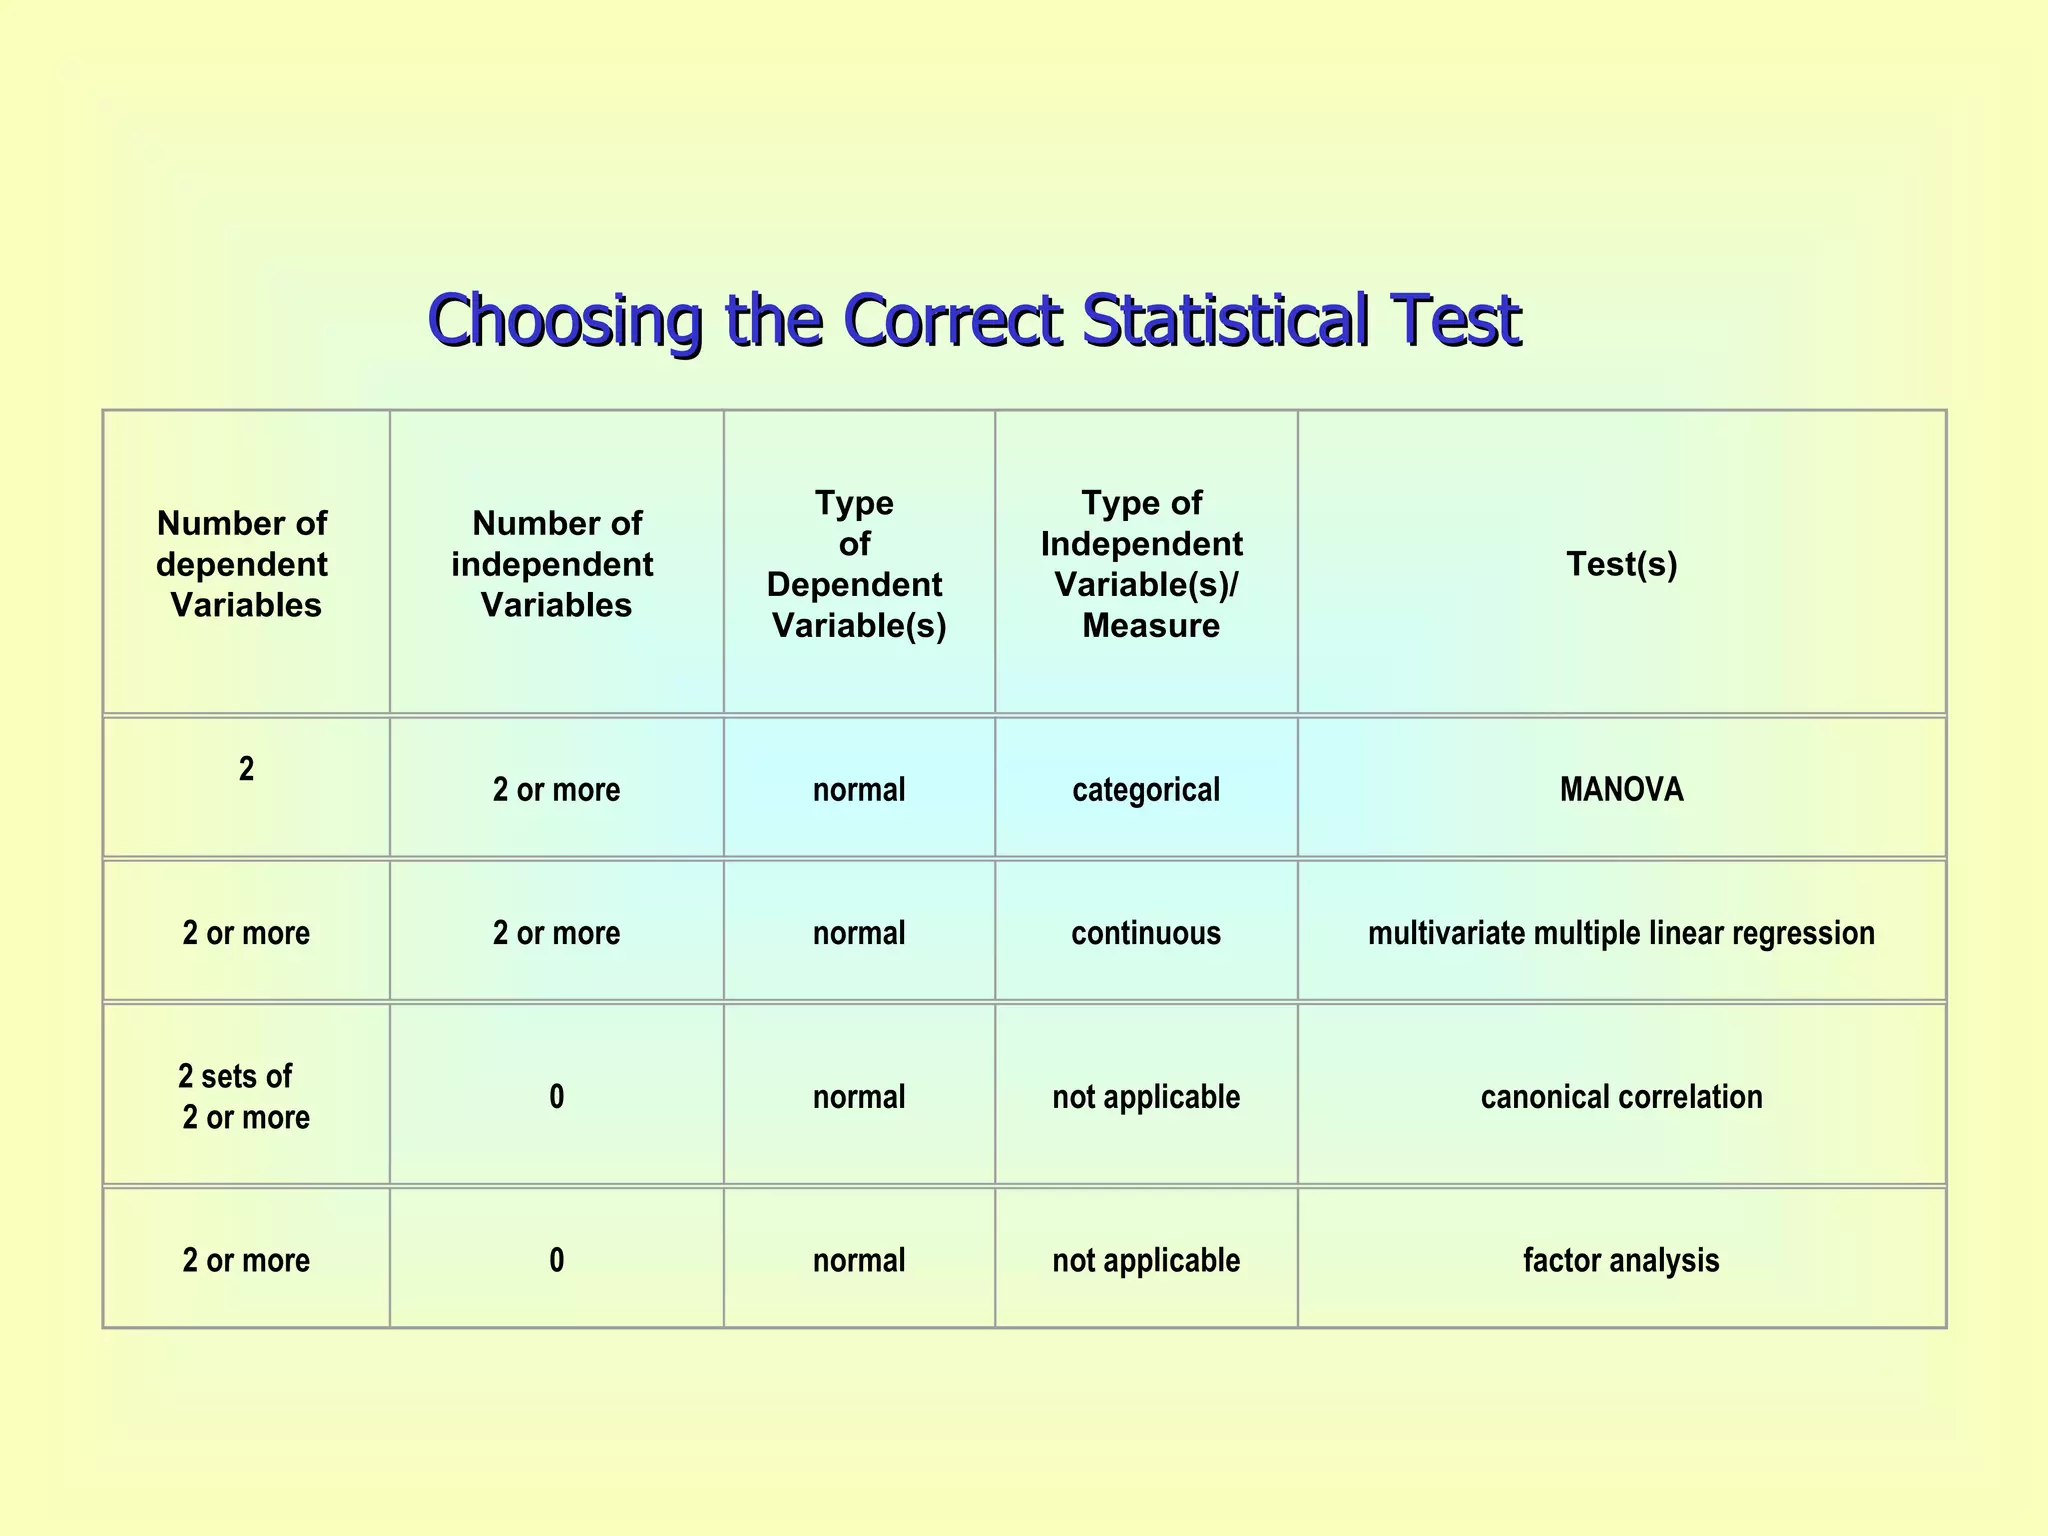
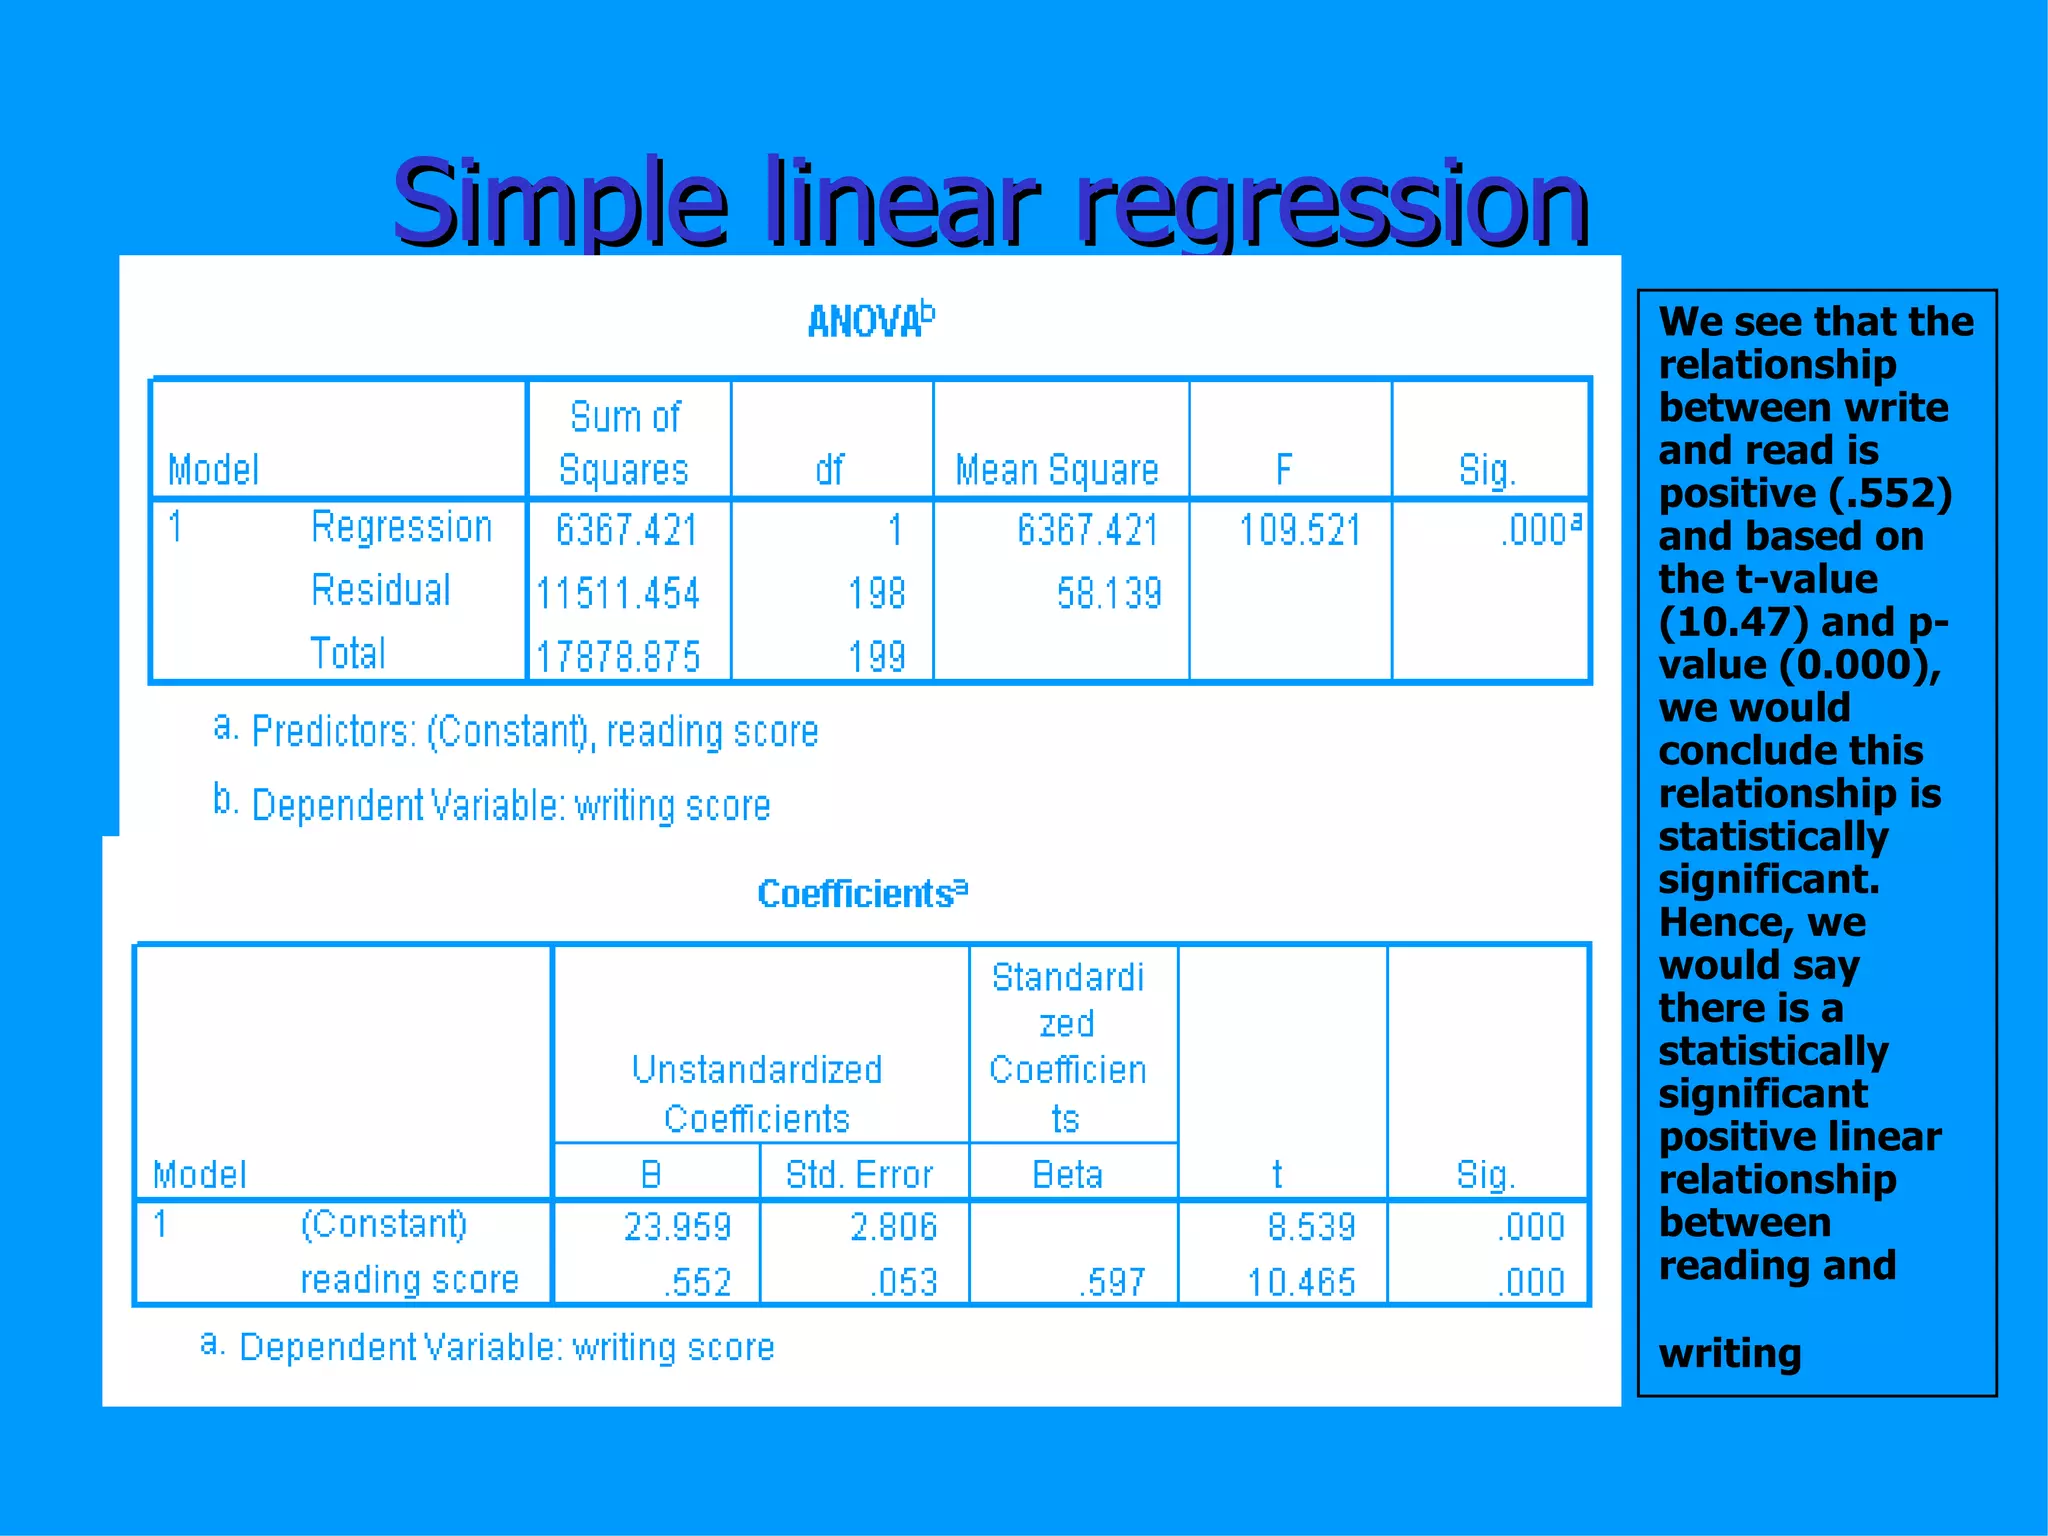
SlideShare a Scribd company logo
1 of 43
Introductory Data Analysis & Interpretation
Four scales of measurement ,[object Object],[object Object],[object Object],[object Object],[object Object],[object Object],[object Object],[object Object],[object Object],[object Object],[object Object],[object Object]
Parametric Test ,[object Object],[object Object],[object Object]
Nonparametric test ,[object Object],[object Object],[object Object],[object Object]
Parametric and Nonparametric Counterparts Function  Para Nonpara  Efficiency of Nonpar to Normal Test for one sample t or z-test Sign test 0.63 Difff bet 2 dependent samples t - or  z-test Wilcoxon signed-ranks 0.95 Difff bet 2 independent samples t or z-test Man-Whitney U/ Wilcoxon Rank-s Test 0.95 More than 2 independent samples 1-ANOVA 2-ANOVA Kruskal-Wallis Friedman’s 0.95 Relationship bet 2 variables Linear (Pearson) Rank Corr (Spearrman) 0.91
Formulating the Hypothesis ,[object Object],[object Object],[object Object],[object Object],[object Object]
Formulating the Hypothesis ,[object Object],[object Object]
Formulating the Hypothesis ,[object Object],[object Object],[object Object],[object Object]
Types of Statistical Errors ,[object Object],[object Object]
Types of Statistical Errors
Establishing the  Decision Rule ,[object Object],[object Object],[object Object]
Establishing the  Decision Rule ,[object Object]
Reject H 0 Do not reject H 0 Sampling Distribution Maximum probability of committing a Type I error =   Establishing the  Decision Rule
Rejection region    = 0.05 0 From the standard normal table Then 0.5 0.4 Establishing the Critical Value as a  z  -Value
Establishing the  Decision Rule ,[object Object]
Rejection region    = 0.05 0 0.5 0.4 Test Statistic in the  Rejection Region
Establishing the  Decision Rule ,[object Object],[object Object],[object Object]
Rejection region    = 0.05 0 0.5 0.4 Relationship Between the p-Value and the Rejection Region p-value  = 0.0036
Using the p-Value to Conduct the Hypothesis Test ,[object Object],[object Object],[object Object],[object Object]
One-Tailed Hypothesis Tests ,[object Object]
Two-Tailed Hypothesis Tests ,[object Object]
0 Two-Tailed Hypothesis Tests
Choosing the Correct Statistical Test   Number of  dependent variables Number of  independent Variables Type of  Dependent  Variable(s) Type  of  Independent  Variable(s)   Measure Test(s) 1   0  (1 population) continuous normal not applicable   (none)   mean one-sample t-test   continuous non-normal   median one-sample median   categorical   proportions   Chi Square goodness-of-fit, binomial test 1   1  (2 independent populations) normal   2 categories   mean 2 independent sample t-test   non-normal medians   Mann Whitney,  Wilcoxon rank sum test   categorical   proportions   Chi square test  Fisher’s Exact test
Choosing the Correct Statistical Test   Number of  dependent variables Number  of  Independent**   Variables Type  of  Dependent  Variable(s) Type  of  Independent  Variable(s)   Measure Test(s) 1 0  (1 population measured twice)  or   1  (2 matched populations) normal   not applicable/  categorical means paired t-test    non-normal   medians Wilcoxon signed ranks test    categorical   proportions McNemar, Chi-square test 1 1  (3 or more populations) normal categorical means one-way ANOVA non-normal medians Kruskal Wallis categorical proportions Chi square test
Choosing the Correct Statistical Test   Number of  dependent variables Number of  independent Variables Type  of  Dependent  Variable(s) Type of  Independent  Variable(s)   Measure Test(s) 1 2 or more  (e.g., 2-way ANOVA) normal categorical means Factorial ANOVA non-normal medians Friedman test categorical proportions log-linear, logistic regression 1 0  (1 population measured   3 or more times) normal not applicable means Repeated measures ANOVA
Choosing the Correct Statistical Test   Number  of  dependent  Variables Number of  independent variables Type of  Dependent  Variable(s) Type  of  Independent  Variable(s)/  Measure Test(s) 1 1 normal continuous correlation  simple linear regression non-normal   non-parametric correlation categorical categorical or continuous logistic regression continuous discriminant analysis 1   2 or more   normal continuous multiple linear regression    non-normal   categorical logistic regression normal mixed categorical and continuous Analysis of Covariance  General Linear Models (regression)   non-normal   categorical logistic regression
Choosing the Correct Statistical Test   Number of  dependent  Variables Number of independent  Variables Type  of  Dependent  Variable(s) Type of  Independent  Variable(s)/   Measure Test(s) 2 2 or more normal categorical MANOVA 2 or more 2 or more normal continuous multivariate multiple linear regression 2 sets of   2 or more 0 normal not applicable canonical correlation 2 or more 0 normal not applicable factor analysis
Some statistical tests ,[object Object],[object Object]
Some statistical tests The mean of the variable write for this particular sample of students is 52.775, which is statistically significantly different from the test value of 50.  We would conclude that this group of students has a significantly higher mean on the writing test than 50.
Some statistical tests ,[object Object],[object Object]
Chi-square goodness of fit These results show that racial composition in our sample does not differ significantly from the hypothesized values that we supplied (chi-square with three degrees of freedom = 5.029, p = .170).
Some statistical tests ,[object Object],[object Object]
Two independent samples t-test ,[object Object]
Some statistical tests ,[object Object],[object Object]
Chi-square test These results indicate that there is no statistically significant relationship between the type of school attended and gender (chi-square with one degree of freedom = 0.047, p = 0.828).
Some statistical tests ,[object Object],[object Object]
One-way ANOVA From this we can see that the students in the academic program have the highest mean writing score, while students in the vocational program have the lowest
Some statistical tests ,[object Object],[object Object]
Simple linear regression We see that the relationship between write and read is positive (.552) and based on the t-value (10.47) and p-value (0.000), we would conclude this relationship is statistically significant.  Hence, we would say there is a statistically significant positive linear relationship between reading and writing
Hypothesis Testing Joke ,[object Object],[object Object],[object Object]
THANK YOU ! Have a statistically significant day!

More Related Content

What's hot

Analysis of variance (ANOVA) everything you need to know
Analysis of variance (ANOVA) everything you need to knowAnalysis of variance (ANOVA) everything you need to know
Analysis of variance (ANOVA) everything you need to knowStat Analytica
 
wilcoxon signed rank test
wilcoxon signed rank testwilcoxon signed rank test
wilcoxon signed rank testraj shekar
 
Introduction to t-tests (statistics)
Introduction to t-tests (statistics)Introduction to t-tests (statistics)
Introduction to t-tests (statistics)Dr Bryan Mills
 
Advance Statistics - Wilcoxon Signed Rank Test
Advance Statistics - Wilcoxon Signed Rank TestAdvance Statistics - Wilcoxon Signed Rank Test
Advance Statistics - Wilcoxon Signed Rank TestJoshua Batalla
 
Introduction to the t Statistic
Introduction to the t StatisticIntroduction to the t Statistic
Introduction to the t Statisticjasondroesch
 
Lecture2 hypothesis testing
Lecture2 hypothesis testingLecture2 hypothesis testing
Lecture2 hypothesis testingo_devinyak
 
Non-parametric Statistical tests for Hypotheses testing
Non-parametric Statistical tests for Hypotheses testingNon-parametric Statistical tests for Hypotheses testing
Non-parametric Statistical tests for Hypotheses testingSundar B N
 
Inferential statistics
Inferential statisticsInferential statistics
Inferential statisticsMaria Theresa
 
Hypothesis testing ppt final
Hypothesis testing ppt finalHypothesis testing ppt final
Hypothesis testing ppt finalpiyushdhaker
 
Analysis of variance ppt @ bec doms
Analysis of variance ppt @ bec domsAnalysis of variance ppt @ bec doms
Analysis of variance ppt @ bec domsBabasab Patil
 
Anova (f test) and mean differentiation
Anova (f test) and mean differentiationAnova (f test) and mean differentiation
Anova (f test) and mean differentiationSubramani Parasuraman
 
Test of hypothesis test of significance
Test of hypothesis test of significanceTest of hypothesis test of significance
Test of hypothesis test of significanceDr. Jayesh Vyas
 
Tests of significance
Tests of significanceTests of significance
Tests of significanceAkhilaNatesan
 
Friedman test Stat
Friedman test Stat Friedman test Stat
Friedman test Stat Kate Malda
 
Chi squared test
Chi squared testChi squared test
Chi squared testDhruv Patel
 

What's hot (20)

Analysis of variance (ANOVA) everything you need to know
Analysis of variance (ANOVA) everything you need to knowAnalysis of variance (ANOVA) everything you need to know
Analysis of variance (ANOVA) everything you need to know
 
wilcoxon signed rank test
wilcoxon signed rank testwilcoxon signed rank test
wilcoxon signed rank test
 
Introduction to t-tests (statistics)
Introduction to t-tests (statistics)Introduction to t-tests (statistics)
Introduction to t-tests (statistics)
 
Advance Statistics - Wilcoxon Signed Rank Test
Advance Statistics - Wilcoxon Signed Rank TestAdvance Statistics - Wilcoxon Signed Rank Test
Advance Statistics - Wilcoxon Signed Rank Test
 
Significance test
Significance testSignificance test
Significance test
 
Binary Logistic Regression
Binary Logistic RegressionBinary Logistic Regression
Binary Logistic Regression
 
Sign Test
Sign TestSign Test
Sign Test
 
Introduction to the t Statistic
Introduction to the t StatisticIntroduction to the t Statistic
Introduction to the t Statistic
 
Lecture2 hypothesis testing
Lecture2 hypothesis testingLecture2 hypothesis testing
Lecture2 hypothesis testing
 
Parametric Test
Parametric TestParametric Test
Parametric Test
 
Testing Hypothesis
Testing HypothesisTesting Hypothesis
Testing Hypothesis
 
Non-parametric Statistical tests for Hypotheses testing
Non-parametric Statistical tests for Hypotheses testingNon-parametric Statistical tests for Hypotheses testing
Non-parametric Statistical tests for Hypotheses testing
 
Inferential statistics
Inferential statisticsInferential statistics
Inferential statistics
 
Hypothesis testing ppt final
Hypothesis testing ppt finalHypothesis testing ppt final
Hypothesis testing ppt final
 
Analysis of variance ppt @ bec doms
Analysis of variance ppt @ bec domsAnalysis of variance ppt @ bec doms
Analysis of variance ppt @ bec doms
 
Anova (f test) and mean differentiation
Anova (f test) and mean differentiationAnova (f test) and mean differentiation
Anova (f test) and mean differentiation
 
Test of hypothesis test of significance
Test of hypothesis test of significanceTest of hypothesis test of significance
Test of hypothesis test of significance
 
Tests of significance
Tests of significanceTests of significance
Tests of significance
 
Friedman test Stat
Friedman test Stat Friedman test Stat
Friedman test Stat
 
Chi squared test
Chi squared testChi squared test
Chi squared test
 

Viewers also liked

Commonly used statistical tests in research
Commonly used statistical tests in researchCommonly used statistical tests in research
Commonly used statistical tests in researchNaqeeb Ullah Khan
 
Analysis of variance (ANOVA)
Analysis of variance (ANOVA)Analysis of variance (ANOVA)
Analysis of variance (ANOVA)Sneh Kumari
 
Chosing the appropriate_statistical_test
Chosing the appropriate_statistical_testChosing the appropriate_statistical_test
Chosing the appropriate_statistical_testBRAJESH KUMAR PARASHAR
 
Statistical inference: Statistical Power, ANOVA, and Post Hoc tests
Statistical inference: Statistical Power, ANOVA, and Post Hoc testsStatistical inference: Statistical Power, ANOVA, and Post Hoc tests
Statistical inference: Statistical Power, ANOVA, and Post Hoc testsEugene Yan Ziyou
 
Statistical tests
Statistical testsStatistical tests
Statistical testsmartyynyyte
 
Choosing appropriate statistical test RSS6 2104
Choosing appropriate statistical test RSS6 2104Choosing appropriate statistical test RSS6 2104
Choosing appropriate statistical test RSS6 2104RSS6
 
Methodologie mesurer tester_des_hypotheses
Methodologie mesurer tester_des_hypothesesMethodologie mesurer tester_des_hypotheses
Methodologie mesurer tester_des_hypothesesRémi Bachelet
 
Research methods module 2
Research methods module 2Research methods module 2
Research methods module 2Independent
 
Overview spss instructor
Overview spss instructorOverview spss instructor
Overview spss instructoraswhite
 
Estimating population values ppt @ bec doms
Estimating population values ppt @ bec domsEstimating population values ppt @ bec doms
Estimating population values ppt @ bec domsBabasab Patil
 
PS CH 10 matter properties and changes edited
PS CH 10 matter properties and changes editedPS CH 10 matter properties and changes edited
PS CH 10 matter properties and changes editedEsther Herrera
 
Chapter36a
Chapter36aChapter36a
Chapter36aYing Liu
 
RESEARCH METHODOLOGY - 2nd year ppt
RESEARCH METHODOLOGY - 2nd year pptRESEARCH METHODOLOGY - 2nd year ppt
RESEARCH METHODOLOGY - 2nd year pptAayushi Chhabra
 
Displaying and describing categorical data
Displaying and describing categorical dataDisplaying and describing categorical data
Displaying and describing categorical dataOlivia Dombrowski
 

Viewers also liked (20)

Commonly used statistical tests in research
Commonly used statistical tests in researchCommonly used statistical tests in research
Commonly used statistical tests in research
 
Analysis of variance (ANOVA)
Analysis of variance (ANOVA)Analysis of variance (ANOVA)
Analysis of variance (ANOVA)
 
Chosing the appropriate_statistical_test
Chosing the appropriate_statistical_testChosing the appropriate_statistical_test
Chosing the appropriate_statistical_test
 
Statistical inference: Statistical Power, ANOVA, and Post Hoc tests
Statistical inference: Statistical Power, ANOVA, and Post Hoc testsStatistical inference: Statistical Power, ANOVA, and Post Hoc tests
Statistical inference: Statistical Power, ANOVA, and Post Hoc tests
 
Statistical tests
Statistical testsStatistical tests
Statistical tests
 
Choosing appropriate statistical test RSS6 2104
Choosing appropriate statistical test RSS6 2104Choosing appropriate statistical test RSS6 2104
Choosing appropriate statistical test RSS6 2104
 
P value
P valueP value
P value
 
Tests of significance
Tests of significanceTests of significance
Tests of significance
 
Methodologie mesurer tester_des_hypotheses
Methodologie mesurer tester_des_hypothesesMethodologie mesurer tester_des_hypotheses
Methodologie mesurer tester_des_hypotheses
 
Research methods module 2
Research methods module 2Research methods module 2
Research methods module 2
 
Overview spss instructor
Overview spss instructorOverview spss instructor
Overview spss instructor
 
Estimating population values ppt @ bec doms
Estimating population values ppt @ bec domsEstimating population values ppt @ bec doms
Estimating population values ppt @ bec doms
 
Ch 2 data analysis
Ch 2 data analysisCh 2 data analysis
Ch 2 data analysis
 
HTML for Education
HTML for EducationHTML for Education
HTML for Education
 
PS CH 10 matter properties and changes edited
PS CH 10 matter properties and changes editedPS CH 10 matter properties and changes edited
PS CH 10 matter properties and changes edited
 
Section 07 manova
Section 07 manovaSection 07 manova
Section 07 manova
 
Chap017
Chap017Chap017
Chap017
 
Chapter36a
Chapter36aChapter36a
Chapter36a
 
RESEARCH METHODOLOGY - 2nd year ppt
RESEARCH METHODOLOGY - 2nd year pptRESEARCH METHODOLOGY - 2nd year ppt
RESEARCH METHODOLOGY - 2nd year ppt
 
Displaying and describing categorical data
Displaying and describing categorical dataDisplaying and describing categorical data
Displaying and describing categorical data
 

Similar to Stat topics

Presentation chi-square test & Anova
Presentation   chi-square test & AnovaPresentation   chi-square test & Anova
Presentation chi-square test & AnovaSonnappan Sridhar
 
Parametric vs non parametric test
Parametric vs non parametric testParametric vs non parametric test
Parametric vs non parametric testar9530
 
Quantitative_analysis.ppt
Quantitative_analysis.pptQuantitative_analysis.ppt
Quantitative_analysis.pptmousaderhem1
 
Statistical test
Statistical test Statistical test
Statistical test As Siyam
 
What So Funny About Proportion Testv3
What So Funny About Proportion Testv3What So Funny About Proportion Testv3
What So Funny About Proportion Testv3ChrisConnors
 
bio statistics for clinical research
bio statistics for clinical researchbio statistics for clinical research
bio statistics for clinical researchRanjith Paravannoor
 
Parametric tests seminar
Parametric tests seminarParametric tests seminar
Parametric tests seminardrdeepika87
 
Chi square test social research refer.ppt
Chi square test social research refer.pptChi square test social research refer.ppt
Chi square test social research refer.pptSnehamurali18
 
Hypothesis Testing in Six Sigma
Hypothesis Testing in Six SigmaHypothesis Testing in Six Sigma
Hypothesis Testing in Six SigmaBody of Knowledge
 
Basic of Statistical Inference Part-V: Types of Hypothesis Test (Parametric)
Basic of Statistical Inference Part-V: Types of Hypothesis Test (Parametric) Basic of Statistical Inference Part-V: Types of Hypothesis Test (Parametric)
Basic of Statistical Inference Part-V: Types of Hypothesis Test (Parametric) Dexlab Analytics
 
Sampling, measurement, and stats(2013)
Sampling, measurement, and stats(2013)Sampling, measurement, and stats(2013)
Sampling, measurement, and stats(2013)BarryCRNA
 
Sampling of Blood
Sampling of BloodSampling of Blood
Sampling of Blooddrantopa
 
TEST OF SIGNIFICANCE.pptx
TEST OF SIGNIFICANCE.pptxTEST OF SIGNIFICANCE.pptx
TEST OF SIGNIFICANCE.pptxJoicePjiji
 
Week 7 spss 2 2013
Week 7 spss 2 2013Week 7 spss 2 2013
Week 7 spss 2 2013wawaaa789
 

Similar to Stat topics (20)

Presentation chi-square test & Anova
Presentation   chi-square test & AnovaPresentation   chi-square test & Anova
Presentation chi-square test & Anova
 
Parametric vs non parametric test
Parametric vs non parametric testParametric vs non parametric test
Parametric vs non parametric test
 
Hypo
HypoHypo
Hypo
 
Bgy5901
Bgy5901Bgy5901
Bgy5901
 
Quantitative_analysis.ppt
Quantitative_analysis.pptQuantitative_analysis.ppt
Quantitative_analysis.ppt
 
Statistical test
Statistical test Statistical test
Statistical test
 
What So Funny About Proportion Testv3
What So Funny About Proportion Testv3What So Funny About Proportion Testv3
What So Funny About Proportion Testv3
 
bio statistics for clinical research
bio statistics for clinical researchbio statistics for clinical research
bio statistics for clinical research
 
Parametric tests seminar
Parametric tests seminarParametric tests seminar
Parametric tests seminar
 
312320.pptx
312320.pptx312320.pptx
312320.pptx
 
Chi square test social research refer.ppt
Chi square test social research refer.pptChi square test social research refer.ppt
Chi square test social research refer.ppt
 
Testing of hypothesis
Testing of hypothesisTesting of hypothesis
Testing of hypothesis
 
Hypothesis Testing in Six Sigma
Hypothesis Testing in Six SigmaHypothesis Testing in Six Sigma
Hypothesis Testing in Six Sigma
 
Basic of Statistical Inference Part-V: Types of Hypothesis Test (Parametric)
Basic of Statistical Inference Part-V: Types of Hypothesis Test (Parametric) Basic of Statistical Inference Part-V: Types of Hypothesis Test (Parametric)
Basic of Statistical Inference Part-V: Types of Hypothesis Test (Parametric)
 
T test
T test T test
T test
 
Sampling, measurement, and stats(2013)
Sampling, measurement, and stats(2013)Sampling, measurement, and stats(2013)
Sampling, measurement, and stats(2013)
 
Hypothesis testing
Hypothesis testingHypothesis testing
Hypothesis testing
 
Sampling of Blood
Sampling of BloodSampling of Blood
Sampling of Blood
 
TEST OF SIGNIFICANCE.pptx
TEST OF SIGNIFICANCE.pptxTEST OF SIGNIFICANCE.pptx
TEST OF SIGNIFICANCE.pptx
 
Week 7 spss 2 2013
Week 7 spss 2 2013Week 7 spss 2 2013
Week 7 spss 2 2013
 

More from Notre Dame of Midsayap College (14)

Understanding Subroutines and Functions in VB6
Understanding Subroutines and Functions in VB6Understanding Subroutines and Functions in VB6
Understanding Subroutines and Functions in VB6
 
Creating Reports in VB6 using MS Access
Creating Reports in VB6 using MS AccessCreating Reports in VB6 using MS Access
Creating Reports in VB6 using MS Access
 
Is 21 -_databases
Is 21 -_databasesIs 21 -_databases
Is 21 -_databases
 
Arrays
ArraysArrays
Arrays
 
Educational technology final
Educational technology finalEducational technology final
Educational technology final
 
Systems Analysis and Design for BSA
Systems Analysis and Design for BSASystems Analysis and Design for BSA
Systems Analysis and Design for BSA
 
Learning session on research
Learning session on researchLearning session on research
Learning session on research
 
CSE 312 web programming
CSE 312 web programmingCSE 312 web programming
CSE 312 web programming
 
Email Gmail
Email GmailEmail Gmail
Email Gmail
 
Introduction to Computer
Introduction to ComputerIntroduction to Computer
Introduction to Computer
 
What is Internet
What is InternetWhat is Internet
What is Internet
 
Cont ADO Data Control
Cont ADO Data ControlCont ADO Data Control
Cont ADO Data Control
 
Using ADO Data Control
Using ADO Data ControlUsing ADO Data Control
Using ADO Data Control
 
VB6 Using ADO Data Control
VB6 Using ADO Data ControlVB6 Using ADO Data Control
VB6 Using ADO Data Control
 

Recently uploaded

Next-generation AAM aircraft unveiled by Supernal, S-A2
Next-generation AAM aircraft unveiled by Supernal, S-A2Next-generation AAM aircraft unveiled by Supernal, S-A2
Next-generation AAM aircraft unveiled by Supernal, S-A2Hyundai Motor Group
 
Artificial intelligence in the post-deep learning era
Artificial intelligence in the post-deep learning eraArtificial intelligence in the post-deep learning era
Artificial intelligence in the post-deep learning eraDeakin University
 
Azure Monitor & Application Insight to monitor Infrastructure & Application
Azure Monitor & Application Insight to monitor Infrastructure & ApplicationAzure Monitor & Application Insight to monitor Infrastructure & Application
Azure Monitor & Application Insight to monitor Infrastructure & ApplicationAndikSusilo4
 
Making_way_through_DLL_hollowing_inspite_of_CFG_by_Debjeet Banerjee.pptx
Making_way_through_DLL_hollowing_inspite_of_CFG_by_Debjeet Banerjee.pptxMaking_way_through_DLL_hollowing_inspite_of_CFG_by_Debjeet Banerjee.pptx
Making_way_through_DLL_hollowing_inspite_of_CFG_by_Debjeet Banerjee.pptxnull - The Open Security Community
 
CloudStudio User manual (basic edition):
CloudStudio User manual (basic edition):CloudStudio User manual (basic edition):
CloudStudio User manual (basic edition):comworks
 
Presentation on how to chat with PDF using ChatGPT code interpreter
Presentation on how to chat with PDF using ChatGPT code interpreterPresentation on how to chat with PDF using ChatGPT code interpreter
Presentation on how to chat with PDF using ChatGPT code interpreternaman860154
 
How to Remove Document Management Hurdles with X-Docs?
How to Remove Document Management Hurdles with X-Docs?How to Remove Document Management Hurdles with X-Docs?
How to Remove Document Management Hurdles with X-Docs?XfilesPro
 
Tech-Forward - Achieving Business Readiness For Copilot in Microsoft 365
Tech-Forward - Achieving Business Readiness For Copilot in Microsoft 365Tech-Forward - Achieving Business Readiness For Copilot in Microsoft 365
Tech-Forward - Achieving Business Readiness For Copilot in Microsoft 3652toLead Limited
 
My Hashitalk Indonesia April 2024 Presentation
My Hashitalk Indonesia April 2024 PresentationMy Hashitalk Indonesia April 2024 Presentation
My Hashitalk Indonesia April 2024 PresentationRidwan Fadjar
 
Integration and Automation in Practice: CI/CD in Mule Integration and Automat...
Integration and Automation in Practice: CI/CD in Mule Integration and Automat...Integration and Automation in Practice: CI/CD in Mule Integration and Automat...
Integration and Automation in Practice: CI/CD in Mule Integration and Automat...Patryk Bandurski
 
08448380779 Call Girls In Civil Lines Women Seeking Men
08448380779 Call Girls In Civil Lines Women Seeking Men08448380779 Call Girls In Civil Lines Women Seeking Men
08448380779 Call Girls In Civil Lines Women Seeking MenDelhi Call girls
 
Key Features Of Token Development (1).pptx
Key  Features Of Token  Development (1).pptxKey  Features Of Token  Development (1).pptx
Key Features Of Token Development (1).pptxLBM Solutions
 
IAC 2024 - IA Fast Track to Search Focused AI Solutions
IAC 2024 - IA Fast Track to Search Focused AI SolutionsIAC 2024 - IA Fast Track to Search Focused AI Solutions
IAC 2024 - IA Fast Track to Search Focused AI SolutionsEnterprise Knowledge
 
08448380779 Call Girls In Diplomatic Enclave Women Seeking Men
08448380779 Call Girls In Diplomatic Enclave Women Seeking Men08448380779 Call Girls In Diplomatic Enclave Women Seeking Men
08448380779 Call Girls In Diplomatic Enclave Women Seeking MenDelhi Call girls
 
Install Stable Diffusion in windows machine
Install Stable Diffusion in windows machineInstall Stable Diffusion in windows machine
Install Stable Diffusion in windows machinePadma Pradeep
 
How to convert PDF to text with Nanonets
How to convert PDF to text with NanonetsHow to convert PDF to text with Nanonets
How to convert PDF to text with Nanonetsnaman860154
 
#StandardsGoals for 2024: What’s new for BISAC - Tech Forum 2024
#StandardsGoals for 2024: What’s new for BISAC - Tech Forum 2024#StandardsGoals for 2024: What’s new for BISAC - Tech Forum 2024
#StandardsGoals for 2024: What’s new for BISAC - Tech Forum 2024BookNet Canada
 
Enhancing Worker Digital Experience: A Hands-on Workshop for Partners
Enhancing Worker Digital Experience: A Hands-on Workshop for PartnersEnhancing Worker Digital Experience: A Hands-on Workshop for Partners
Enhancing Worker Digital Experience: A Hands-on Workshop for PartnersThousandEyes
 
Advanced Test Driven-Development @ php[tek] 2024
Advanced Test Driven-Development @ php[tek] 2024Advanced Test Driven-Development @ php[tek] 2024
Advanced Test Driven-Development @ php[tek] 2024Scott Keck-Warren
 

Recently uploaded (20)

E-Vehicle_Hacking_by_Parul Sharma_null_owasp.pptx
E-Vehicle_Hacking_by_Parul Sharma_null_owasp.pptxE-Vehicle_Hacking_by_Parul Sharma_null_owasp.pptx
E-Vehicle_Hacking_by_Parul Sharma_null_owasp.pptx
 
Next-generation AAM aircraft unveiled by Supernal, S-A2
Next-generation AAM aircraft unveiled by Supernal, S-A2Next-generation AAM aircraft unveiled by Supernal, S-A2
Next-generation AAM aircraft unveiled by Supernal, S-A2
 
Artificial intelligence in the post-deep learning era
Artificial intelligence in the post-deep learning eraArtificial intelligence in the post-deep learning era
Artificial intelligence in the post-deep learning era
 
Azure Monitor & Application Insight to monitor Infrastructure & Application
Azure Monitor & Application Insight to monitor Infrastructure & ApplicationAzure Monitor & Application Insight to monitor Infrastructure & Application
Azure Monitor & Application Insight to monitor Infrastructure & Application
 
Making_way_through_DLL_hollowing_inspite_of_CFG_by_Debjeet Banerjee.pptx
Making_way_through_DLL_hollowing_inspite_of_CFG_by_Debjeet Banerjee.pptxMaking_way_through_DLL_hollowing_inspite_of_CFG_by_Debjeet Banerjee.pptx
Making_way_through_DLL_hollowing_inspite_of_CFG_by_Debjeet Banerjee.pptx
 
CloudStudio User manual (basic edition):
CloudStudio User manual (basic edition):CloudStudio User manual (basic edition):
CloudStudio User manual (basic edition):
 
Presentation on how to chat with PDF using ChatGPT code interpreter
Presentation on how to chat with PDF using ChatGPT code interpreterPresentation on how to chat with PDF using ChatGPT code interpreter
Presentation on how to chat with PDF using ChatGPT code interpreter
 
How to Remove Document Management Hurdles with X-Docs?
How to Remove Document Management Hurdles with X-Docs?How to Remove Document Management Hurdles with X-Docs?
How to Remove Document Management Hurdles with X-Docs?
 
Tech-Forward - Achieving Business Readiness For Copilot in Microsoft 365
Tech-Forward - Achieving Business Readiness For Copilot in Microsoft 365Tech-Forward - Achieving Business Readiness For Copilot in Microsoft 365
Tech-Forward - Achieving Business Readiness For Copilot in Microsoft 365
 
My Hashitalk Indonesia April 2024 Presentation
My Hashitalk Indonesia April 2024 PresentationMy Hashitalk Indonesia April 2024 Presentation
My Hashitalk Indonesia April 2024 Presentation
 
Integration and Automation in Practice: CI/CD in Mule Integration and Automat...
Integration and Automation in Practice: CI/CD in Mule Integration and Automat...Integration and Automation in Practice: CI/CD in Mule Integration and Automat...
Integration and Automation in Practice: CI/CD in Mule Integration and Automat...
 
08448380779 Call Girls In Civil Lines Women Seeking Men
08448380779 Call Girls In Civil Lines Women Seeking Men08448380779 Call Girls In Civil Lines Women Seeking Men
08448380779 Call Girls In Civil Lines Women Seeking Men
 
Key Features Of Token Development (1).pptx
Key  Features Of Token  Development (1).pptxKey  Features Of Token  Development (1).pptx
Key Features Of Token Development (1).pptx
 
IAC 2024 - IA Fast Track to Search Focused AI Solutions
IAC 2024 - IA Fast Track to Search Focused AI SolutionsIAC 2024 - IA Fast Track to Search Focused AI Solutions
IAC 2024 - IA Fast Track to Search Focused AI Solutions
 
08448380779 Call Girls In Diplomatic Enclave Women Seeking Men
08448380779 Call Girls In Diplomatic Enclave Women Seeking Men08448380779 Call Girls In Diplomatic Enclave Women Seeking Men
08448380779 Call Girls In Diplomatic Enclave Women Seeking Men
 
Install Stable Diffusion in windows machine
Install Stable Diffusion in windows machineInstall Stable Diffusion in windows machine
Install Stable Diffusion in windows machine
 
How to convert PDF to text with Nanonets
How to convert PDF to text with NanonetsHow to convert PDF to text with Nanonets
How to convert PDF to text with Nanonets
 
#StandardsGoals for 2024: What’s new for BISAC - Tech Forum 2024
#StandardsGoals for 2024: What’s new for BISAC - Tech Forum 2024#StandardsGoals for 2024: What’s new for BISAC - Tech Forum 2024
#StandardsGoals for 2024: What’s new for BISAC - Tech Forum 2024
 
Enhancing Worker Digital Experience: A Hands-on Workshop for Partners
Enhancing Worker Digital Experience: A Hands-on Workshop for PartnersEnhancing Worker Digital Experience: A Hands-on Workshop for Partners
Enhancing Worker Digital Experience: A Hands-on Workshop for Partners
 
Advanced Test Driven-Development @ php[tek] 2024
Advanced Test Driven-Development @ php[tek] 2024Advanced Test Driven-Development @ php[tek] 2024
Advanced Test Driven-Development @ php[tek] 2024
 

Stat topics

  • 1. Introductory Data Analysis & Interpretation
  • 2.
  • 3.
  • 4.
  • 5. Parametric and Nonparametric Counterparts Function Para Nonpara Efficiency of Nonpar to Normal Test for one sample t or z-test Sign test 0.63 Difff bet 2 dependent samples t - or z-test Wilcoxon signed-ranks 0.95 Difff bet 2 independent samples t or z-test Man-Whitney U/ Wilcoxon Rank-s Test 0.95 More than 2 independent samples 1-ANOVA 2-ANOVA Kruskal-Wallis Friedman’s 0.95 Relationship bet 2 variables Linear (Pearson) Rank Corr (Spearrman) 0.91
  • 6.
  • 7.
  • 8.
  • 9.
  • 10.
  • 12.
  • 13.
  • 14. Reject H 0 Do not reject H 0 Sampling Distribution Maximum probability of committing a Type I error =  Establishing the Decision Rule
  • 15. Rejection region  = 0.05 0 From the standard normal table Then 0.5 0.4 Establishing the Critical Value as a z -Value
  • 16.
  • 17. Rejection region  = 0.05 0 0.5 0.4 Test Statistic in the Rejection Region
  • 18.
  • 19. Rejection region  = 0.05 0 0.5 0.4 Relationship Between the p-Value and the Rejection Region p-value = 0.0036
  • 20.
  • 21.
  • 22.
  • 24. Choosing the Correct Statistical Test Number of dependent variables Number of independent Variables Type of Dependent Variable(s) Type of Independent Variable(s)   Measure Test(s) 1   0 (1 population) continuous normal not applicable  (none)   mean one-sample t-test   continuous non-normal   median one-sample median   categorical   proportions   Chi Square goodness-of-fit, binomial test 1   1 (2 independent populations) normal   2 categories   mean 2 independent sample t-test   non-normal medians   Mann Whitney, Wilcoxon rank sum test   categorical   proportions   Chi square test Fisher’s Exact test
  • 25. Choosing the Correct Statistical Test Number of dependent variables Number of Independent** Variables Type of Dependent Variable(s) Type of Independent Variable(s)   Measure Test(s) 1 0 (1 population measured twice) or 1 (2 matched populations) normal   not applicable/ categorical means paired t-test    non-normal   medians Wilcoxon signed ranks test    categorical   proportions McNemar, Chi-square test 1 1 (3 or more populations) normal categorical means one-way ANOVA non-normal medians Kruskal Wallis categorical proportions Chi square test
  • 26. Choosing the Correct Statistical Test Number of dependent variables Number of independent Variables Type of Dependent Variable(s) Type of Independent Variable(s)   Measure Test(s) 1 2 or more (e.g., 2-way ANOVA) normal categorical means Factorial ANOVA non-normal medians Friedman test categorical proportions log-linear, logistic regression 1 0 (1 population measured  3 or more times) normal not applicable means Repeated measures ANOVA
  • 27. Choosing the Correct Statistical Test Number of dependent Variables Number of independent variables Type of Dependent Variable(s) Type of Independent Variable(s)/  Measure Test(s) 1 1 normal continuous correlation simple linear regression non-normal   non-parametric correlation categorical categorical or continuous logistic regression continuous discriminant analysis 1   2 or more   normal continuous multiple linear regression    non-normal   categorical logistic regression normal mixed categorical and continuous Analysis of Covariance General Linear Models (regression)   non-normal   categorical logistic regression
  • 28. Choosing the Correct Statistical Test Number of dependent Variables Number of independent Variables Type of Dependent Variable(s) Type of Independent Variable(s)/   Measure Test(s) 2 2 or more normal categorical MANOVA 2 or more 2 or more normal continuous multivariate multiple linear regression 2 sets of  2 or more 0 normal not applicable canonical correlation 2 or more 0 normal not applicable factor analysis
  • 29.
  • 30. Some statistical tests The mean of the variable write for this particular sample of students is 52.775, which is statistically significantly different from the test value of 50.  We would conclude that this group of students has a significantly higher mean on the writing test than 50.
  • 31.
  • 32. Chi-square goodness of fit These results show that racial composition in our sample does not differ significantly from the hypothesized values that we supplied (chi-square with three degrees of freedom = 5.029, p = .170).
  • 33.
  • 34.
  • 35.
  • 36. Chi-square test These results indicate that there is no statistically significant relationship between the type of school attended and gender (chi-square with one degree of freedom = 0.047, p = 0.828).
  • 37.
  • 38. One-way ANOVA From this we can see that the students in the academic program have the highest mean writing score, while students in the vocational program have the lowest
  • 39.
  • 40.
  • 41. Simple linear regression We see that the relationship between write and read is positive (.552) and based on the t-value (10.47) and p-value (0.000), we would conclude this relationship is statistically significant.  Hence, we would say there is a statistically significant positive linear relationship between reading and writing
  • 42.
  • 43. THANK YOU ! Have a statistically significant day!