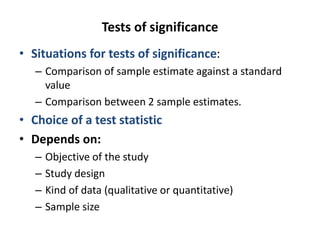
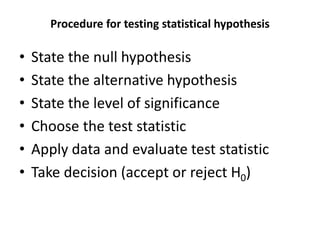
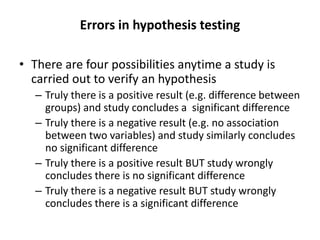
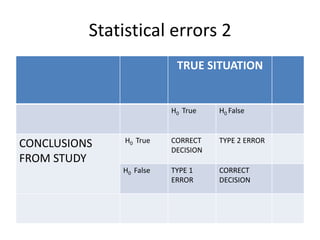
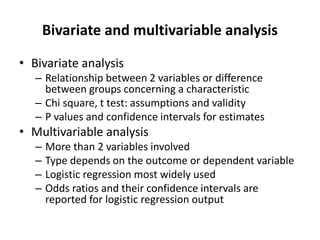
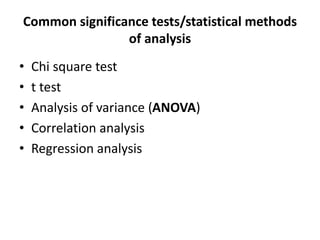
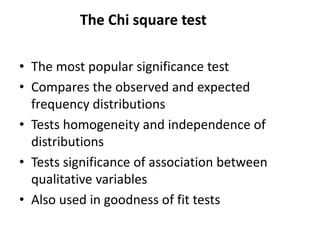
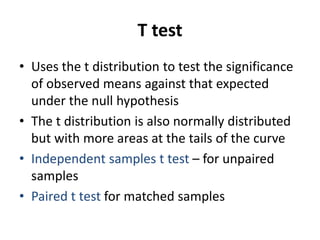
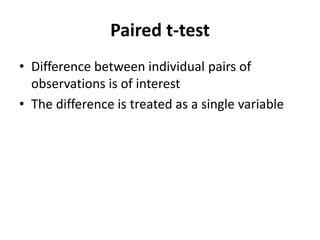
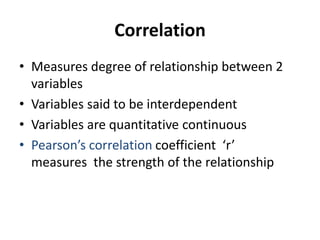
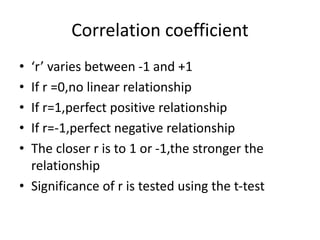
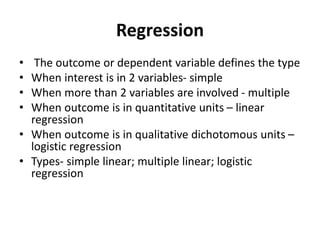
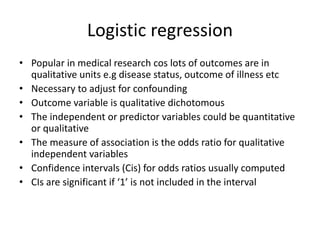
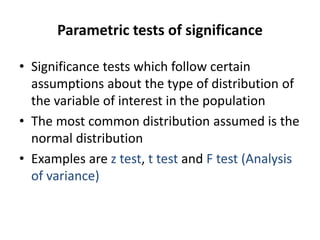
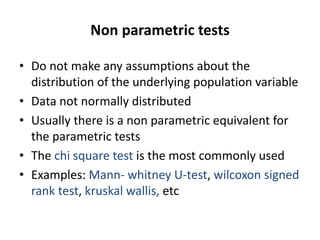
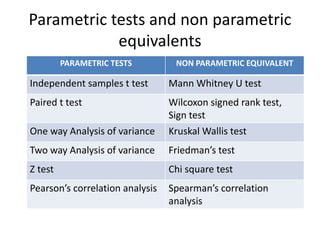
Inferential Statistics
BY
Dr. Akinwumi A.F.
September 2022
Inferential statistics
• Concerns with decision making on the general
population based on data collected from a
part of it
• Generalizing findings from a sample to the
larger population
• Methods
– Hypothesis testing
– Estimation (point and interval estimation)
Hypothesis testing
• Hypothesis: this is a statement or conjecture about a
phenomenon of a population that has not been verified.
• When an hypothesis is formulated in the language of
statistics, it becomes a statistical hypothesis.
• Hypothesis testing: this is the process or procedure of
investigating the truth of an hypothesis.
• Null Hypothesis (H0): this is the hypothesis of no difference or
no association. It is the one under test. It’s either accepted
(i.e. fail to reject, a preferred terminology in statistics) or
rejected.
• Alternative hypothesis (H1): stated in the affirmative
language. It’s usually the research question
Common Terms
• Level of statistical significance:
– this is the probability of a difference arising purely by
chance
– Popularly set at 5%
– During test of stat. significance, it is assessed by the p-
value
– when the p-value is below the sig level, the observed
result is considered unlikely to have arose from
chance. i.e. the result cannot be attributed to
sampling error. The null hypothesis is rejected and
the result it is said to be statistically significant.
The P-value
• P value is defined as the probability of
obtaining the observed result and more
extreme results by chance alone given that the
null hypothesis is true
– The probability of getting something more
extreme than your result, when there is no effect
in the population
5/27/2024 OMOTOSHO O.S. 5
The p value (contd.)
• It is a measure of the chance of incorrectly
concluding that there is a significant result
when it does not exist (type 1 error)
• Level of sig. usually set at 5%
– P values less than 5% are statistically significant
– P values greater than 5% are not significant
P-value (contd.)
• Facts
– Its associated with the test statistic
• That’s why it’s the probability of the value of
the test statistic gotten
– It ranges from 0 – 1
– Its used in testing hypothesis
• H₀: µ₁ = µ₀
• H₁: µ₁ > µ₀
5/27/2024 OMOTOSHO O.S. 7
P-value (contd.)
• The p-value is calculated after the statistical
test has been performed and therefore based
on the study.
• We reject the null hypothesis when the p-
value is smaller than the pre-established alpha
value.
5/27/2024 OMOTOSHO O.S. 8
Tests of significance
• Situations for tests of significance:
– Comparison of sample estimate against a standard
value
– Comparison between 2 sample estimates.
• Choice of a test statistic
• Depends on:
– Objective of the study
– Study design
– Kind of data (qualitative or quantitative)
– Sample size
Procedure for testing statistical hypothesis
• State the null hypothesis
• State the alternative hypothesis
• State the level of significance
• Choose the test statistic
• Apply data and evaluate test statistic
• Take decision (accept or reject H0)
Errors in hypothesis testing
• There are four possibilities anytime a study is
carried out to verify an hypothesis
– Truly there is a positive result (e.g. difference between
groups) and study concludes a significant difference
– Truly there is a negative result (e.g. no association
between two variables) and study similarly concludes
no significant difference
– Truly there is a positive result BUT study wrongly
concludes there is no significant difference
– Truly there is a negative result BUT study wrongly
concludes there is a significant difference
Statistical errors 2
TRUE SITUATION
H0 True H0 False
CONCLUSIONS
FROM STUDY
H0 True CORRECT
DECISION
TYPE 2 ERROR
H0 False TYPE 1
ERROR
CORRECT
DECISION
Errors in hypothesis testing
• Type 1 error (α) - rejecting the null when it’s
true; also called level of significance
• Type 2 error (β)- failing to reject a false null
hypothesis; real difference exists but study
fails to detect it; 1- power of the test
Errors (contd.)
• Type 1 error also called level of significance,
usually set at 5%
• Type 2 error has a complement – called power
• Power = (1 – type 2 error)
– Typical values of power are 80% and 90%
– Values of beta error are 10% and 20%
• The higher the power the more the chance that
the test will detect a real difference if it exists
Confidence Interval
Definition
• Confidence Interval is an ESTIMATED RANGE
of values which is likely to include an unknown
population parameter
– A range of values that would contain a true
estimate of a population parameter with a degree
of confidence.
• Confidence interval is A FORMULA that tells us
how to use sample data TO CALCULATE an
interval that estimates a population
parameter.
5/27/2024 OMOTOSHO O.S. 15
CI- Definition (Contd.)
• In Calculating the CI, there are 3 basic things
needed:
i) Statistic
ii) Confidence level
iii) Margin of error
• CIs are significant if the null value of the test
statistic is not included in the interval.
5/27/2024 OMOTOSHO O.S. 16
CI for a population mean
• CI = statistic ± critical value * s.e.
• Statistic – sample mean (ẍ)
• Critical value
– Large sample: Z- score for 95% CI: 1.96 or 2
– Small sample: t score – which depends on the degree
of freedom
• s.e.
– Calculated from standard deviation (s)
– s.e. = s/√n
• Where n = sample size
• CI = ẍ ± z * s/√n (large sample size)
• CI = ẍ ± t * s/√n (small sample size)
5/27/2024 OMOTOSHO O.S. 17
Comparing P-value and Confidence Interval
P-value Confidence Interval
Indicates if test is statistically
significant or not only
Also gives the magnitude of
difference apart from
ascertaining significance or
not.
Gives a single value
estimate
Gives a range of plausible
estimate
Effect of sample size cannot
be ascertained
The effect of the sample size
can be ascertained
5/27/2024 OMOTOSHO O.S. 18
What test statistic should I use?
• Study design: independent/dependent samples
• What variables are involved:
quantitative/qualitative?
• Is data normally distributed (parametric/non
parametric)?
• What is the sample size? Large/small sample size
• What are the assumptions underlying the test
chosen?
Selecting the appropriate significance test involving 2
or more samples
• Relationship between two quantitative variables
– Correlation analysis (strength of relationship)
– Linear regression analysis (prediction of one variable from the
other
• Relationship between two qualitative variables
– Chi square test
• Relationship between one qualitative and one quantitative
variable:
Can be reduced to mean difference between two or more groups
– if two groups (t test)
– If more than two groups Analysis of variance (ANOVA or F test)
Other considerations
• Assumptions in the use of significance tests
• Variable type determines way variables are
handled
• The normal distribution
• Sample size considerations – for numeric
versus qualitative variables; for multivariable
analysis
What statistical tests are appropriate
for the following?
• To identify differences in intelligence
quotients between children exclusively
breastfed and those not. (Ind. Student t test)
• To determine if suicidal ideations among in-
school adolescents depend on person
responsible for upbringing of adolescent (both
parents, single parent, grandparent, other
relative) (Chi Square)
Degrees of freedom for selected
significance tests
• Degree of freedom is required in hypothesis
testing in determining the tabulated/expected
value of the test statistic computed from the
sample
• It is usually related to the number of
parameters estimated independently from the
sample
Degree of freedom for selected
significance tests
Significance test Degree of
freedom
Parameters for calculation
Independent
samples t test
n1 + n2 - 2 n1 = Sample size in group 1
n2 = Sample size in group 2
Paired t test n - 1 n is the number of pairs
Chi square test (r – 1)(c – 1) r = number of rows
c = number of columns
Bivariate and multivariable analysis
• Bivariate analysis
– Relationship between 2 variables or difference
between groups concerning a characteristic
– Chi square, t test: assumptions and validity
– P values and confidence intervals for estimates
• Multivariable analysis
– More than 2 variables involved
– Type depends on the outcome or dependent variable
– Logistic regression most widely used
– Odds ratios and their confidence intervals are
reported for logistic regression output
Paired designs: 2 dependent groups
• Extraneous variations are controlled by pairing or
matching e .g each subject in one group has a twin in
the other group
• ‘Before and after’ measurements
• Matching
• The statistical test is the paired t –test when variable
of interest (which is being compared between
dependent samples) is quantitative and McNemar’s
chi square test when qualitative
Common significance tests/statistical methods
of analysis
• Chi square test
• t test
• Analysis of variance (ANOVA)
• Correlation analysis
• Regression analysis
The Chi square test
• The most popular significance test
• Compares the observed and expected
frequency distributions
• Tests homogeneity and independence of
distributions
• Tests significance of association between
qualitative variables
• Also used in goodness of fit tests
T test
• Uses the t distribution to test the significance
of observed means against that expected
under the null hypothesis
• The t distribution is also normally distributed
but with more areas at the tails of the curve
• Independent samples t test – for unpaired
samples
• Paired t test for matched samples
Paired t-test
• Difference between individual pairs of
observations is of interest
• The difference is treated as a single variable
Correlation
• Measures degree of relationship between 2
variables
• Variables said to be interdependent
• Variables are quantitative continuous
• Pearson’s correlation coefficient ‘r’
measures the strength of the relationship
Correlation coefficient
• ‘r’ varies between -1 and +1
• If r =0,no linear relationship
• If r=1,perfect positive relationship
• If r=-1,perfect negative relationship
• The closer r is to 1 or -1,the stronger the
relationship
• Significance of r is tested using the t-test
Regression
• The outcome or dependent variable defines the type
• When interest is in 2 variables- simple
• When more than 2 variables are involved - multiple
• When outcome is in quantitative units – linear
regression
• When outcome is in qualitative dichotomous units –
logistic regression
• Types- simple linear; multiple linear; logistic
regression
Types of Regression
• Linear and Multiple - uses continuous data to
predict continuous data outcome
• Logistic- uses continuous data to predict
probability of a dichotomous outcome
• Poisson regression- time between rare events.
• Cox proportional hazards regression- survival
analysis.
34
Assumptions in Regression Analysis
• Observations are normally distributed about
their mean values.
• Errors are independent and normally
distributed with zero mean and common
variance.
• Homogeneity of variance throughout the
group (homoscedasticity).
35
Simple linear regression
• Variables are quantitative continuous
• Ther’s a dependent variable y and an
independent variable x
• e. g height and vital capacity ;age and systolic
bp
• The equation y=a+ bx relates y and x
• The regression constant and coefficient are ‘a’
and ‘b’ respectively
• Possile to predict y given values of x
Multivariable analysis
• Involves >2 variables
• Named according to outcome variable
• Dichotomous outcome – logistic regression
• Numeric outcome (Quantitative continuous
normally distributed) – multiple linear
regression
• Time to an event as outcome – Cox regression
Logistic regression
• Popular in medical research cos lots of outcomes are in
qualitative units e.g disease status, outcome of illness etc
• Necessary to adjust for confounding
• Outcome variable is qualitative dichotomous
• The independent or predictor variables could be quantitative
or qualitative
• The measure of association is the odds ratio for qualitative
independent variables
• Confidence intervals (Cis) for odds ratios usually computed
• CIs are significant if ‘1’ is not included in the interval
Parametric tests of significance
• Significance tests which follow certain
assumptions about the type of distribution of
the variable of interest in the population
• The most common distribution assumed is the
normal distribution
• Examples are z test, t test and F test (Analysis
of variance)
Non parametric tests
• Do not make any assumptions about the
distribution of the underlying population variable
• Data not normally distributed
• Usually there is a non parametric equivalent for
the parametric tests
• The chi square test is the most commonly used
• Examples: Mann- whitney U-test, wilcoxon signed
rank test, kruskal wallis, etc
Parametric tests and non parametric
equivalents
PARAMETRIC TESTS NON PARAMETRIC EQUIVALENT
Independent samples t test Mann Whitney U test
Paired t test Wilcoxon signed rank test,
Sign test
One way Analysis of variance Kruskal Wallis test
Two way Analysis of variance Friedman’s test
Z test Chi square test
Pearson’s correlation analysis Spearman’s correlation
analysis
Interpreting odds ratios and confidence
intervals
• Odds ratios measure association between 2 categorical
variables
• It is greater than 1 when the association is positive
• It is less than 1(a decimal) when the association is
negative
• It is 1 when there is no association
• Confidence intervals (Cis) for odds ratios usually
computed
• CIs are significant if ‘1’ is not included in the interval
Comparing means of more than two
groups
• Analysis of variance (ANOVA) is the technique
used
• Also called the F –test
• Total variation is partitioned into between and
within groups or treatment and error
• Results are set up in an ANOVA table
Examples
• Suggest the Significance tests:
• Investigation of relationship between age and
quality of life scores among adults aged 65
years?
• Investigation of the relationship between
baldness and stress ?
• A comparison of efficacy (using reduction in
blood pressure levels) of a new antihypertensive
with a standard treatment?
• THANKS FOR LISTENING

Inferential statistics_AAF 500L 2021.ppt

  • 1.
  • 2.
    Inferential statistics • Concernswith decision making on the general population based on data collected from a part of it • Generalizing findings from a sample to the larger population • Methods – Hypothesis testing – Estimation (point and interval estimation)
  • 3.
    Hypothesis testing • Hypothesis:this is a statement or conjecture about a phenomenon of a population that has not been verified. • When an hypothesis is formulated in the language of statistics, it becomes a statistical hypothesis. • Hypothesis testing: this is the process or procedure of investigating the truth of an hypothesis. • Null Hypothesis (H0): this is the hypothesis of no difference or no association. It is the one under test. It’s either accepted (i.e. fail to reject, a preferred terminology in statistics) or rejected. • Alternative hypothesis (H1): stated in the affirmative language. It’s usually the research question
  • 4.
    Common Terms • Levelof statistical significance: – this is the probability of a difference arising purely by chance – Popularly set at 5% – During test of stat. significance, it is assessed by the p- value – when the p-value is below the sig level, the observed result is considered unlikely to have arose from chance. i.e. the result cannot be attributed to sampling error. The null hypothesis is rejected and the result it is said to be statistically significant.
  • 5.
    The P-value • Pvalue is defined as the probability of obtaining the observed result and more extreme results by chance alone given that the null hypothesis is true – The probability of getting something more extreme than your result, when there is no effect in the population 5/27/2024 OMOTOSHO O.S. 5
  • 6.
    The p value(contd.) • It is a measure of the chance of incorrectly concluding that there is a significant result when it does not exist (type 1 error) • Level of sig. usually set at 5% – P values less than 5% are statistically significant – P values greater than 5% are not significant
  • 7.
    P-value (contd.) • Facts –Its associated with the test statistic • That’s why it’s the probability of the value of the test statistic gotten – It ranges from 0 – 1 – Its used in testing hypothesis • H₀: µ₁ = µ₀ • H₁: µ₁ > µ₀ 5/27/2024 OMOTOSHO O.S. 7
  • 8.
    P-value (contd.) • Thep-value is calculated after the statistical test has been performed and therefore based on the study. • We reject the null hypothesis when the p- value is smaller than the pre-established alpha value. 5/27/2024 OMOTOSHO O.S. 8
  • 9.
    Tests of significance •Situations for tests of significance: – Comparison of sample estimate against a standard value – Comparison between 2 sample estimates. • Choice of a test statistic • Depends on: – Objective of the study – Study design – Kind of data (qualitative or quantitative) – Sample size
  • 10.
    Procedure for testingstatistical hypothesis • State the null hypothesis • State the alternative hypothesis • State the level of significance • Choose the test statistic • Apply data and evaluate test statistic • Take decision (accept or reject H0)
  • 11.
    Errors in hypothesistesting • There are four possibilities anytime a study is carried out to verify an hypothesis – Truly there is a positive result (e.g. difference between groups) and study concludes a significant difference – Truly there is a negative result (e.g. no association between two variables) and study similarly concludes no significant difference – Truly there is a positive result BUT study wrongly concludes there is no significant difference – Truly there is a negative result BUT study wrongly concludes there is a significant difference
  • 12.
    Statistical errors 2 TRUESITUATION H0 True H0 False CONCLUSIONS FROM STUDY H0 True CORRECT DECISION TYPE 2 ERROR H0 False TYPE 1 ERROR CORRECT DECISION
  • 13.
    Errors in hypothesistesting • Type 1 error (α) - rejecting the null when it’s true; also called level of significance • Type 2 error (β)- failing to reject a false null hypothesis; real difference exists but study fails to detect it; 1- power of the test
  • 14.
    Errors (contd.) • Type1 error also called level of significance, usually set at 5% • Type 2 error has a complement – called power • Power = (1 – type 2 error) – Typical values of power are 80% and 90% – Values of beta error are 10% and 20% • The higher the power the more the chance that the test will detect a real difference if it exists
  • 15.
    Confidence Interval Definition • ConfidenceInterval is an ESTIMATED RANGE of values which is likely to include an unknown population parameter – A range of values that would contain a true estimate of a population parameter with a degree of confidence. • Confidence interval is A FORMULA that tells us how to use sample data TO CALCULATE an interval that estimates a population parameter. 5/27/2024 OMOTOSHO O.S. 15
  • 16.
    CI- Definition (Contd.) •In Calculating the CI, there are 3 basic things needed: i) Statistic ii) Confidence level iii) Margin of error • CIs are significant if the null value of the test statistic is not included in the interval. 5/27/2024 OMOTOSHO O.S. 16
  • 17.
    CI for apopulation mean • CI = statistic ± critical value * s.e. • Statistic – sample mean (ẍ) • Critical value – Large sample: Z- score for 95% CI: 1.96 or 2 – Small sample: t score – which depends on the degree of freedom • s.e. – Calculated from standard deviation (s) – s.e. = s/√n • Where n = sample size • CI = ẍ ± z * s/√n (large sample size) • CI = ẍ ± t * s/√n (small sample size) 5/27/2024 OMOTOSHO O.S. 17
  • 18.
    Comparing P-value andConfidence Interval P-value Confidence Interval Indicates if test is statistically significant or not only Also gives the magnitude of difference apart from ascertaining significance or not. Gives a single value estimate Gives a range of plausible estimate Effect of sample size cannot be ascertained The effect of the sample size can be ascertained 5/27/2024 OMOTOSHO O.S. 18
  • 19.
    What test statisticshould I use? • Study design: independent/dependent samples • What variables are involved: quantitative/qualitative? • Is data normally distributed (parametric/non parametric)? • What is the sample size? Large/small sample size • What are the assumptions underlying the test chosen?
  • 20.
    Selecting the appropriatesignificance test involving 2 or more samples • Relationship between two quantitative variables – Correlation analysis (strength of relationship) – Linear regression analysis (prediction of one variable from the other • Relationship between two qualitative variables – Chi square test • Relationship between one qualitative and one quantitative variable: Can be reduced to mean difference between two or more groups – if two groups (t test) – If more than two groups Analysis of variance (ANOVA or F test)
  • 21.
    Other considerations • Assumptionsin the use of significance tests • Variable type determines way variables are handled • The normal distribution • Sample size considerations – for numeric versus qualitative variables; for multivariable analysis
  • 22.
    What statistical testsare appropriate for the following? • To identify differences in intelligence quotients between children exclusively breastfed and those not. (Ind. Student t test) • To determine if suicidal ideations among in- school adolescents depend on person responsible for upbringing of adolescent (both parents, single parent, grandparent, other relative) (Chi Square)
  • 23.
    Degrees of freedomfor selected significance tests • Degree of freedom is required in hypothesis testing in determining the tabulated/expected value of the test statistic computed from the sample • It is usually related to the number of parameters estimated independently from the sample
  • 24.
    Degree of freedomfor selected significance tests Significance test Degree of freedom Parameters for calculation Independent samples t test n1 + n2 - 2 n1 = Sample size in group 1 n2 = Sample size in group 2 Paired t test n - 1 n is the number of pairs Chi square test (r – 1)(c – 1) r = number of rows c = number of columns
  • 25.
    Bivariate and multivariableanalysis • Bivariate analysis – Relationship between 2 variables or difference between groups concerning a characteristic – Chi square, t test: assumptions and validity – P values and confidence intervals for estimates • Multivariable analysis – More than 2 variables involved – Type depends on the outcome or dependent variable – Logistic regression most widely used – Odds ratios and their confidence intervals are reported for logistic regression output
  • 26.
    Paired designs: 2dependent groups • Extraneous variations are controlled by pairing or matching e .g each subject in one group has a twin in the other group • ‘Before and after’ measurements • Matching • The statistical test is the paired t –test when variable of interest (which is being compared between dependent samples) is quantitative and McNemar’s chi square test when qualitative
  • 27.
    Common significance tests/statisticalmethods of analysis • Chi square test • t test • Analysis of variance (ANOVA) • Correlation analysis • Regression analysis
  • 28.
    The Chi squaretest • The most popular significance test • Compares the observed and expected frequency distributions • Tests homogeneity and independence of distributions • Tests significance of association between qualitative variables • Also used in goodness of fit tests
  • 29.
    T test • Usesthe t distribution to test the significance of observed means against that expected under the null hypothesis • The t distribution is also normally distributed but with more areas at the tails of the curve • Independent samples t test – for unpaired samples • Paired t test for matched samples
  • 30.
    Paired t-test • Differencebetween individual pairs of observations is of interest • The difference is treated as a single variable
  • 31.
    Correlation • Measures degreeof relationship between 2 variables • Variables said to be interdependent • Variables are quantitative continuous • Pearson’s correlation coefficient ‘r’ measures the strength of the relationship
  • 32.
    Correlation coefficient • ‘r’varies between -1 and +1 • If r =0,no linear relationship • If r=1,perfect positive relationship • If r=-1,perfect negative relationship • The closer r is to 1 or -1,the stronger the relationship • Significance of r is tested using the t-test
  • 33.
    Regression • The outcomeor dependent variable defines the type • When interest is in 2 variables- simple • When more than 2 variables are involved - multiple • When outcome is in quantitative units – linear regression • When outcome is in qualitative dichotomous units – logistic regression • Types- simple linear; multiple linear; logistic regression
  • 34.
    Types of Regression •Linear and Multiple - uses continuous data to predict continuous data outcome • Logistic- uses continuous data to predict probability of a dichotomous outcome • Poisson regression- time between rare events. • Cox proportional hazards regression- survival analysis. 34
  • 35.
    Assumptions in RegressionAnalysis • Observations are normally distributed about their mean values. • Errors are independent and normally distributed with zero mean and common variance. • Homogeneity of variance throughout the group (homoscedasticity). 35
  • 36.
    Simple linear regression •Variables are quantitative continuous • Ther’s a dependent variable y and an independent variable x • e. g height and vital capacity ;age and systolic bp • The equation y=a+ bx relates y and x • The regression constant and coefficient are ‘a’ and ‘b’ respectively • Possile to predict y given values of x
  • 37.
    Multivariable analysis • Involves>2 variables • Named according to outcome variable • Dichotomous outcome – logistic regression • Numeric outcome (Quantitative continuous normally distributed) – multiple linear regression • Time to an event as outcome – Cox regression
  • 38.
    Logistic regression • Popularin medical research cos lots of outcomes are in qualitative units e.g disease status, outcome of illness etc • Necessary to adjust for confounding • Outcome variable is qualitative dichotomous • The independent or predictor variables could be quantitative or qualitative • The measure of association is the odds ratio for qualitative independent variables • Confidence intervals (Cis) for odds ratios usually computed • CIs are significant if ‘1’ is not included in the interval
  • 39.
    Parametric tests ofsignificance • Significance tests which follow certain assumptions about the type of distribution of the variable of interest in the population • The most common distribution assumed is the normal distribution • Examples are z test, t test and F test (Analysis of variance)
  • 40.
    Non parametric tests •Do not make any assumptions about the distribution of the underlying population variable • Data not normally distributed • Usually there is a non parametric equivalent for the parametric tests • The chi square test is the most commonly used • Examples: Mann- whitney U-test, wilcoxon signed rank test, kruskal wallis, etc
  • 41.
    Parametric tests andnon parametric equivalents PARAMETRIC TESTS NON PARAMETRIC EQUIVALENT Independent samples t test Mann Whitney U test Paired t test Wilcoxon signed rank test, Sign test One way Analysis of variance Kruskal Wallis test Two way Analysis of variance Friedman’s test Z test Chi square test Pearson’s correlation analysis Spearman’s correlation analysis
  • 42.
    Interpreting odds ratiosand confidence intervals • Odds ratios measure association between 2 categorical variables • It is greater than 1 when the association is positive • It is less than 1(a decimal) when the association is negative • It is 1 when there is no association • Confidence intervals (Cis) for odds ratios usually computed • CIs are significant if ‘1’ is not included in the interval
  • 43.
    Comparing means ofmore than two groups • Analysis of variance (ANOVA) is the technique used • Also called the F –test • Total variation is partitioned into between and within groups or treatment and error • Results are set up in an ANOVA table
  • 44.
    Examples • Suggest theSignificance tests: • Investigation of relationship between age and quality of life scores among adults aged 65 years? • Investigation of the relationship between baldness and stress ? • A comparison of efficacy (using reduction in blood pressure levels) of a new antihypertensive with a standard treatment?
  • 45.
    • THANKS FORLISTENING