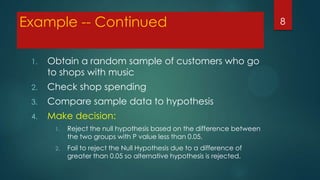
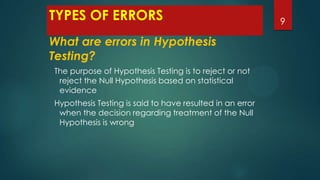
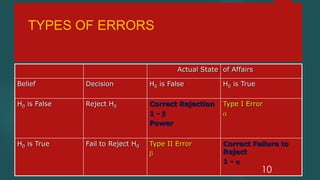
This document discusses hypothesis testing and p-values. It begins by defining a hypothesis as a proposition or prediction about the outcome of an experiment. Hypotheses are formulated and tested through science to evaluate their credibility. There are two main types of hypotheses: the null hypothesis, which corresponds to a default or general position, and the alternative hypothesis, which asserts a rival relationship. Hypothesis testing uses sample data to evaluate whether differences observed could be due to chance (the null hypothesis) or are real effects (the alternative hypothesis). Key concepts discussed include type 1 and type 2 errors, significance levels, one-sided and two-sided tests, and the relationship between p-values, confidence intervals, and the strength of evidence against
Two ways tolearn
about a population
Confidence intervals
Hypothesis testing
2
3.
HYPOTHESIS
What do youmean by a Hypothesis?
A hypothesis is a proposition that is –
assumed as a premise in an argument / claim
set forth as an explanation for the occurrence of
some specified group of phenomena
A hypothesis is a prediction about the outcome of an
experiment. In market research this could be the
result of the out come of a focus or field study
3
4.
Why do wemake hypotheses?
4
The practice of science traditionally involves formulating and
testing hypotheses
Hypotheses are assertions that are capable of being proven false
using a test of observed data
Hypothesis testing is a procedure through which sample data is
used to evaluate the credibility of a hypothesis
Hypothesis is basically used to check the estimate whether its purely
by chance or its real and not due to chance. ( Null & Alternative
Hypothesis).
5.
TYPES OF HYPOTHESIS
NullHypothesis
The null hypothesis typically corresponds to a
general or default position
Making this assertion will make no difference and
hence cannot be proven positively
Alternate Hypothesis
An alternate hypothesis asserts a rival relationship
between the phenomena measured by the null
hypothesis
It need not be a logical negation of the null
hypothesis as it only helps in rejecting or not
rejecting the null hypothesis
5
Null & AlternativeHypothesis
Null Hypothesis.
There is no difference between spending of customers in music
playing shops and music playing shops and any difference is by
chance.
Alternative Hypothesis.
The difference between customers spending in music playing shops
is higher than non-music playing shops and the difference is real, its
not by chance.
7
8.
Example -- Continued
1.
Obtaina random sample of customers who go
to shops with music
2.
Check shop spending
3.
Compare sample data to hypothesis
4.
Make decision:
1.
Reject the null hypothesis based on the difference between
the two groups with P value less than 0.05.
2.
Fail to reject the Null Hypothesis due to a difference of
greater than 0.05 so alternative hypothesis is rejected.
8
9.
TYPES OF ERRORS
Whatare errors in Hypothesis
Testing?
The purpose of Hypothesis Testing is to reject or not
reject the Null Hypothesis based on statistical
evidence
Hypothesis Testing is said to have resulted in an error
when the decision regarding treatment of the Null
Hypothesis is wrong
9
10.
TYPES OF ERRORS
ActualState of Affairs
Belief
Decision
H0 is False
H0 is True
H0 is False
Reject H0
Correct Rejection
1-
Power
Type I Error
H0 is True
Fail to Reject H0
Type II Error
Correct Failure to
Reject
1-
10
11.
α, β ANDTHE INTER-RELATIONSHIP
During the Hypothesis Testing,
α – is the probability of occurrence of a Type-I Error
β – is the probability of occurrence of a Type-II Error
Relationship between α and β
For a fixed sample size, the lower we set value of
α, the higher is the value of β and vice-versa
In many cases, it is difficult or almost impossible to
calculate the value of β and hence we usually
set only α
11
12.
Jury’s Decision
Did NotCommit Crime
Committed Crime
Guilty
Type I Error
Convict Innocent
Person
Correct Verdict
Convict Guilty
Person
Not Guilty
Correct Acquittal
Type II Error
Fail to Convict Innocent Fail to Convict
Person
Guilty Person
12
13.
Level of Significance
13
1.Alpha: probability of committing a Type I error
1.
2.
3.
4.
Reject H0 although it is true
Symbolized by
In research or type 1 error basically kills patients because
a useless drug is going to be prescribed.
Type 2 error kills researcher because a valid and significant
result is not published.
2. Obtained result attributed to:
1.
2.
Real effect (reject H0)
Chance ( Accept Null)
14.
Statistical Power
1.
P-value isa probability statement:
2.
Probability that the test will correctly reject a false
null hypothesis.
3.
A p-value is based on chance variation: how likely
is this sample or a more extreme one as a result of
chance alone?
4.
A p-value is the probability that the null hypothesis is true
5.
A p-value is the probability that the null hypothesis is false.
14
15.
INTERPRETING RESULTS
15
Interpreting theweight of evidence against the Null
Hypothesis for rejecting / not rejecting Ho
If the p-value for testing Ho is less than –
< 0.05, we have strong evidence that Ho is false
< 0.01, we have very strong evidence that Ho is false
P value is taken as 0.05 or 5% because it is a standard icon & it
nearly corresponds to the difference of two standard errors.
16.
Decision Rule usedwith P-Value to
Make Conclusions
A p-value measures the strength of evidence against an
hypothesis
if a p-value is small, then either the null hypothesis is false
or we got a very unlikely sample
small p-values lead us to reject null hypotheses, and
support alternative hypotheses
The smaller the p-value is, the more convincing the
evidence is against the null hypothesis
if a p-value is large, the null hypothesis could still be
false, but n may be too small to reject the null.
16
17.
One Sided &Two Sided Tests
Consider two means A & B.
One sided test only tells you that A > B.
Two sided tests tells you that either A>B or A <B so leaving you with
two options.
Mostly Two sided tests are used except in cases of equivalence tests
like Lumpectomy done for Breast surgery as well as radical
Mastectomy.
One sided test would be whether Lumpectomy is worst for survival
than Radical Mastectomy and we don't bother about better survival
results.
One sided tests can also be applied for variables which will only go
in one direction like Height, Age etc.
17
18.
Relationships between confidenceinterval,
alpha & P Values.
p-values can be referenced to alpha, or the chance of
making a type one error
a 95% confidence interval will reject any value of the null
hypothesis that is outside the interval at a 5% significance
level for a two-sided test.
A larger sample size with the same sample mean will
result in a smaller p-value (i.e., stronger evidence)
18
19.
Cautions and Limitations
19
p-valuesare about data, not parameters
A null hypothesis is right or wrong, one or the other
A p-value indicates that there may be an effect and how
strong the evidence is that there is an effect. It does not tell
how large an effect there is.
A p-value is only as good as your data. The error involved may
be due to sampling.
large samples can lead to small p-values without resulting in
practical significance (e.g., statistical significance does not
imply practical significance)
Interpreting a p-value (or its implication) is relative to the
context or consequence of the problem (and data).
There is nothing sacred about .05