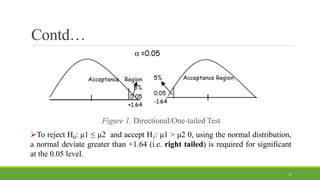
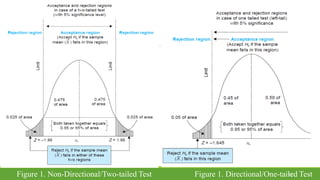
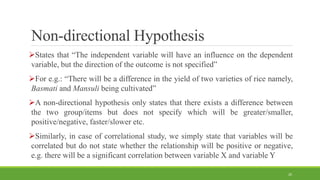
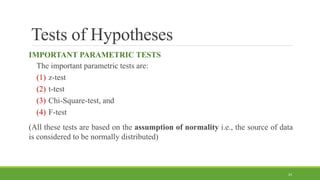
Hypothesis Testing
NABIN KUNWAR
DEPARTMENT OF AGRICULTURAL ECONOMICS
MAY 29, 2021
1
Introduction
A specific, testable and precise prediction about what the researcher assumes to
happen in his/her study
Hypothesis is usually considered as the principal instrument in research
Involves proposing a possible relationship between two variables i.e. the
dependent and independent variable
A complete hypothesis must include three components i.e. the variables, the
population and the relationship between the variables
2
Characteristics of Hypothesis
Should be clear and precise
Should be capable of being tested
Should state relationship between variables (if relational hypothesis)
Should be limited in scope and must be specific
Should be stated as far as possible in most simple terms
Should be consistent with most known facts
3
Contd…
Should be amenable to testing within a reasonable time
Must explain the facts that gave rise to the need for explanation
4
Types of Research Hypothesis
Generally, there are four types of research hypothesis which are:
1. Null Hypothesis
2. Alternate Hypothesis
3. Directional Hypothesis
4. Non-directional Hypothesis
5
Purpose of Hypothesis Testing
A statistical process of testing an assumption regarding a phenomenon or
population parameter
It is a critical and crucial part of the scientific method
Is a systematic approach to assessing theories through observations and
determining the probability that a stated statement is true or false
For an analyst who makes predictions, hypothesis testing is a difficult way of
backing up his prediction with statistical analysis
Also helps to determine whether there is sufficient statistical evidences that
support a certain hypothesis about the population parameter or not
6
Null Hypothesis
Null hypothesis is normally referred to as hypothesis of no difference and it is
denoted by Ho
Assumes that there is no difference between the hypothetical population and
the one, from which the sample under study has been drawn
A/c to this hypothesis, “there is no difference between the effects of two
treatments or there is no association between two attributes”
7
Contd…
It declares that there is no true difference in the sample statistic and
population parameter under consideration,
Hence it is called ‘null’ which means invalid, void, or a mounting to nothing
and the difference found is accidental, arising out of instabilities of sampling
Rejecting a null hypothesis does not necessarily mean that the experiment did
not produce the required results, but it sets the situation for further
experimentation
8
Contd…
For example, the hypothesis may be set in a form “maize variety A will give the
same yield per hectare as that of the variety B or there is no difference between
the average yields of maize varieties A and B”
Symbolically, Ho: μ1=μ2
Thus, these hypothesis form a basis to work with and such a working
hypothesis is known as null hypothesis.
It is called null hypothesis because if nullifies the original hypothesis i.e. variety
A will give more/less yield than variety B
9
States of Nature and Decisions on Null Hypothesis
Decision on Null
Hypothesis
States of Nature
Null Hypothesis True Null Hypothesis False
Accept Correct Decision
Probability=1 − 𝛼
Type II error committed
Probability=𝛽
Reject Type I error committed
Probability=𝛼
(𝛼 𝑖𝑠 𝑐𝑎𝑙𝑙𝑒𝑑 𝑠𝑖𝑔𝑛𝑖𝑓𝑖𝑐𝑎𝑛𝑐𝑒 𝑙𝑒𝑣𝑒𝑙)
Correct Decision
Probability=1 − 𝛽
(1 − 𝛽 𝑖𝑠 𝑐𝑎𝑙𝑙𝑒𝑑 𝑝𝑜𝑤𝑒𝑟 𝑜𝑓 𝑎 𝑡𝑒𝑠𝑡)
Note. Adapted from “Formulating and Testing Hypothesis” by Muhammad, K. S. (2016). Basic Guideline for Research. pp.
51-71.
10
Contd…
In the choice of null hypothesis, the following considerations are usually kept in
view:
A. Alternative hypothesis is usually the one which one wishes to prove and the
null hypothesis is the one which one wishes to disprove. Thus, a null
hypothesis represents the hypothesis we are trying to reject, and alternative
hypothesis represents all other possibilities.
B. If the rejection of a certain hypothesis when it is actually true involves great
risk, it is taken as null hypothesis because the probability of rejecting it when
it is true is 𝜶 which is chosen very small.
C. Null hypothesis should always be specific hypothesis i.e., it should not state
about or approximately a certain value.
11
Alternative Hypothesis
Hypothesis that contradicts the null hypothesis i.e. rejecting the null hypothesis
is known as alternative hypothesis
In other words, the set of alternatives to the null hypothesis is referred to as the
alternative hypothesis.
An alternative hypothesis and a null hypothesis are mutually exclusive, which
implies that only one of the two hypotheses can be true
A/c to this hypothesis, there is a relationship between the two variables being
studied (one variable has an effect on the other) and the results are not due to
chance
In simple words, null hypothesis means there is no effect while alternate
hypothesis means there is an effect
12
Contd…
Usually represented by Ha/H1
For example: “There is a significant difference between the yields of two maize
varieties”
Symbolically, H1: μ1≠μ2 (two tailed or non-direction alternative)
If the statement is that A gives significantly less yield than B or A gives
significantly more yield than B. Such statement is known as alternate hypothesis
Symbolically, H1: μ1 < μ2 (left tailed) H1: μ1 > μ2 (right tailed)
13
Directional Hypothesis
Directional hypothesis is also known as one-tailed hypothesis which predicts
the nature of the effect of the independent variable on the dependent variable
States which way you think the results are going to go
For example: “Mansuli variety of rice will have more yield than that of Basmati
variety”; the hypothesis compares the two groups and states which one will have
more/less, be faster/slower and so on
14
Contd…
Under correlational study, the directional hypothesis would state whether a
positive or a negative correlation is expected, stating how the two variables will
be related to each other
 E.g.: There will be a positive correlation between the number of tillers and
yield of rice, number of irrigation and plant growth etc.
 The directional hypothesis can also specify a negative correlation
 E.g.: the higher the inflation rate in the country, lower the purchasing power of
the people.
15
Contd…
Here the researcher is intellectually committed to a particular outcome and
the anticipated direction of the relationship between variables is also specified
i.e. the investigator predicts not only the existence of a relationship but also its
nature
Such type of hypothesis is generally use by scientific journal
If the normal or t-distribution is used, one side or one tailed test only is
employed to estimate the required probabilities
16
Contd…
Figure 1. Directional/One-tailed Test
To reject H0: μ1 ≤ μ2 and accept H1: μ1 > μ2 0, using the normal distribution,
a normal deviate greater than +1.64 (i.e. right tailed) is required for significant
at the 0.05 level.
17
Contd…
Likewise, to reject H0: μ1 ≥ μ2 and accept H1: μ1 < μ2, the corresponding
normal curve is less than -1.64 (i.e. left tailed)
The choice between a non-directional or directional alternative hypothesis
should be determined by the rationale that gives rise to the study and should be
made before the data are gathered.
The major advantage of a directional alternative hypothesis is that it takes less
of a deviation from expectation to reject the null hypothesis
18
19
Figure 1. Directional/One-tailed Test
Figure 1. Non-Directional/Two-tailed Test
Non-directional Hypothesis
States that “The independent variable will have an influence on the dependent
variable, but the direction of the outcome is not specified”
For e.g.: “There will be a difference in the yield of two varieties of rice namely,
Basmati and Mansuli being cultivated”
A non-directional hypothesis only states that there exists a difference between
the two group/items but does not specify which will be greater/smaller,
positive/negative, faster/slower etc.
Similarly, in case of correlational study, we simply state that variables will be
correlated but do not state whether the relationship will be positive or negative,
e.g. there will be a significant correlation between variable X and variable Y
20
Contd…
We may wish to test the null hypothesis H0:μ1− μ2 = 0 against the alternative
H1:μ1− μ2 ≠ 0. This means that if H0 is rejected, the decision is that a difference
exists between the two means.
No confirmation about the direction of the difference is made. Such test is a
non-directional test.
Sometime called a two-tailed or two-sided test, because if the normal
distribution or t-distribution is used, the two tails of the distribution are employed
in the estimation of probabilities
21
Contd…
Figure 2. Non-directional/Two-tailed Test
Consider a 5% significance level. If the sampling distribution is normal, 2.5%
of the area of the curve falls to the right of 1.96 standard deviation units above
the mean, and 2.5% lies to the left of 1.96 standard deviation units lower the
mean.
22
Procedure For Hypothesis Testing
1. Making a formal statement
2. Selecting a significance level
3. Deciding the distribution to use
4. Selecting a random sample and computing an appropriate value
5. Calculation of the probability
6. Comparing the probability
23
Tests of Hypotheses
IMPORTANT PARAMETRIC TESTS
The important parametric tests are:
(1) z-test
(2) t-test
(3) Chi-Square-test, and
(4) F-test
(All these tests are based on the assumption of normality i.e., the source of data
is considered to be normally distributed)
24
z-test
Based on the normal probability (z) distribution and is used for judging the
significance of several statistical measures, particularly the mean
z-test is generally used for comparing the mean of a sample to some
hypothesized mean for the population in case of large sample (>30)
Besides, this test may be used for judging the significance of median, mode,
coefficient of correlation and several other measures
25
t-test
t-test is based on t-distribution and is considered an appropriate test for judging
the significance of a sample mean or for judging the significance of difference
between the means of two samples in case of small sample(<30)
In case two samples are related, we use paired t-test (aka. difference test) for
judging the significance of the mean of difference between the two related
samples.
It can also be used for judging the significance of the coefficients of simple and
partial correlations
26
Contd…
t-statistic is calculated from the sample data and then compared with its
probable value based on t-distribution (to be read from the table that gives
probable values of t for different levels of significance for different degrees of
freedom) at a specified level of significance for concerning degrees of freedom
for accepting or rejecting the null hypothesis
27
Chi-Square-test
Chi-Square-test is based on chi-square distribution and as a parametric test is
used for comparing a sample variance to a theoretical population variance
It can also be used to make comparisons between theoretical populations and
actual data when categories are used.
Thus, the chi-square test is applicable in large number of problems.
The test is, in fact, a technique through the use of which it is possible for all
researchers to:
(i) test the goodness of fit
(ii) test the significance of association between two attributes,
(iii) test the homogeneity or the significance of population variance.
28
F-test
F-test is based on F-distribution and is used to compare the variance of the
two-independent samples.
This test is also used in the context of analysis of variance (ANOVA) for
judging the significance of more than two sample means at one and the same
time.
It is also used for judging the significance of multiple correlation coefficients
F-statistic is calculated and compared with its probable value (to be seen in the
F-ratio tables for different degrees of freedom for greater and smaller variances at
specified level of significance) for accepting or rejecting the null hypothesis
29
Conclusion
Research hypothesis is a specific, testable and precise prediction about what the
researcher assumes to happen in their study
There are four types of research hypothesis (null, alternate, directional and non-
directional hypothesis)
Hypothesis testing is done to determine whether there is sufficient statistical
evidence that supports a certain hypothesis about the population parameter or not
Null hypothesis is the hypothesis of no difference i.e. same
30
Contd…
Directional hypothesis predicts the nature of the effect of the independent
variable on the dependent variable i.e. direction of outcome is specified
Non directional hypothesis predicts the influence of independent variable on
the dependent variable, but the direction of the outcome is not specified
Test for hypotheses testing: t-test, z-test, chi-square test, F-test
31
References
Agresti, A., & Finlay, B. (1997). Statistical Methods for the Social Sciences (3rd ed.). Prentice
Hall.
CFI. (2020). Null Hypothesis. Retrieved from Corporate Finance Institute:
https://corporatefinanceinstitute.com/resources/knowledge/other/null-hypothesis-2/
Development of the Research Hypothesis and Types of Hypothesis. (2018). Retrieved from
THEINTACTONE: https://theintactone.com/2018/02/26/br-u1-topic-3-development-of-the-
research-hypothesis-and-types-of-hypothesis/
McLeod, S. (2018, August 10). What is a hypothesis. Retrieved from Simply Psychology:
https://www.simplypsychology.org/what-is-a-hypotheses.html
Muhammad, K. S. (2016). Formulating and Testing Hypothesis. In Basic Guideline for Research
(pp. 51-71).
32
THANK YOU!
33

Hypothesis and Hypothesis Testing

  • 1.
    Hypothesis Testing NABIN KUNWAR DEPARTMENTOF AGRICULTURAL ECONOMICS MAY 29, 2021 1
  • 2.
    Introduction A specific, testableand precise prediction about what the researcher assumes to happen in his/her study Hypothesis is usually considered as the principal instrument in research Involves proposing a possible relationship between two variables i.e. the dependent and independent variable A complete hypothesis must include three components i.e. the variables, the population and the relationship between the variables 2
  • 3.
    Characteristics of Hypothesis Shouldbe clear and precise Should be capable of being tested Should state relationship between variables (if relational hypothesis) Should be limited in scope and must be specific Should be stated as far as possible in most simple terms Should be consistent with most known facts 3
  • 4.
    Contd… Should be amenableto testing within a reasonable time Must explain the facts that gave rise to the need for explanation 4
  • 5.
    Types of ResearchHypothesis Generally, there are four types of research hypothesis which are: 1. Null Hypothesis 2. Alternate Hypothesis 3. Directional Hypothesis 4. Non-directional Hypothesis 5
  • 6.
    Purpose of HypothesisTesting A statistical process of testing an assumption regarding a phenomenon or population parameter It is a critical and crucial part of the scientific method Is a systematic approach to assessing theories through observations and determining the probability that a stated statement is true or false For an analyst who makes predictions, hypothesis testing is a difficult way of backing up his prediction with statistical analysis Also helps to determine whether there is sufficient statistical evidences that support a certain hypothesis about the population parameter or not 6
  • 7.
    Null Hypothesis Null hypothesisis normally referred to as hypothesis of no difference and it is denoted by Ho Assumes that there is no difference between the hypothetical population and the one, from which the sample under study has been drawn A/c to this hypothesis, “there is no difference between the effects of two treatments or there is no association between two attributes” 7
  • 8.
    Contd… It declares thatthere is no true difference in the sample statistic and population parameter under consideration, Hence it is called ‘null’ which means invalid, void, or a mounting to nothing and the difference found is accidental, arising out of instabilities of sampling Rejecting a null hypothesis does not necessarily mean that the experiment did not produce the required results, but it sets the situation for further experimentation 8
  • 9.
    Contd… For example, thehypothesis may be set in a form “maize variety A will give the same yield per hectare as that of the variety B or there is no difference between the average yields of maize varieties A and B” Symbolically, Ho: μ1=μ2 Thus, these hypothesis form a basis to work with and such a working hypothesis is known as null hypothesis. It is called null hypothesis because if nullifies the original hypothesis i.e. variety A will give more/less yield than variety B 9
  • 10.
    States of Natureand Decisions on Null Hypothesis Decision on Null Hypothesis States of Nature Null Hypothesis True Null Hypothesis False Accept Correct Decision Probability=1 − 𝛼 Type II error committed Probability=𝛽 Reject Type I error committed Probability=𝛼 (𝛼 𝑖𝑠 𝑐𝑎𝑙𝑙𝑒𝑑 𝑠𝑖𝑔𝑛𝑖𝑓𝑖𝑐𝑎𝑛𝑐𝑒 𝑙𝑒𝑣𝑒𝑙) Correct Decision Probability=1 − 𝛽 (1 − 𝛽 𝑖𝑠 𝑐𝑎𝑙𝑙𝑒𝑑 𝑝𝑜𝑤𝑒𝑟 𝑜𝑓 𝑎 𝑡𝑒𝑠𝑡) Note. Adapted from “Formulating and Testing Hypothesis” by Muhammad, K. S. (2016). Basic Guideline for Research. pp. 51-71. 10
  • 11.
    Contd… In the choiceof null hypothesis, the following considerations are usually kept in view: A. Alternative hypothesis is usually the one which one wishes to prove and the null hypothesis is the one which one wishes to disprove. Thus, a null hypothesis represents the hypothesis we are trying to reject, and alternative hypothesis represents all other possibilities. B. If the rejection of a certain hypothesis when it is actually true involves great risk, it is taken as null hypothesis because the probability of rejecting it when it is true is 𝜶 which is chosen very small. C. Null hypothesis should always be specific hypothesis i.e., it should not state about or approximately a certain value. 11
  • 12.
    Alternative Hypothesis Hypothesis thatcontradicts the null hypothesis i.e. rejecting the null hypothesis is known as alternative hypothesis In other words, the set of alternatives to the null hypothesis is referred to as the alternative hypothesis. An alternative hypothesis and a null hypothesis are mutually exclusive, which implies that only one of the two hypotheses can be true A/c to this hypothesis, there is a relationship between the two variables being studied (one variable has an effect on the other) and the results are not due to chance In simple words, null hypothesis means there is no effect while alternate hypothesis means there is an effect 12
  • 13.
    Contd… Usually represented byHa/H1 For example: “There is a significant difference between the yields of two maize varieties” Symbolically, H1: μ1≠μ2 (two tailed or non-direction alternative) If the statement is that A gives significantly less yield than B or A gives significantly more yield than B. Such statement is known as alternate hypothesis Symbolically, H1: μ1 < μ2 (left tailed) H1: μ1 > μ2 (right tailed) 13
  • 14.
    Directional Hypothesis Directional hypothesisis also known as one-tailed hypothesis which predicts the nature of the effect of the independent variable on the dependent variable States which way you think the results are going to go For example: “Mansuli variety of rice will have more yield than that of Basmati variety”; the hypothesis compares the two groups and states which one will have more/less, be faster/slower and so on 14
  • 15.
    Contd… Under correlational study,the directional hypothesis would state whether a positive or a negative correlation is expected, stating how the two variables will be related to each other  E.g.: There will be a positive correlation between the number of tillers and yield of rice, number of irrigation and plant growth etc.  The directional hypothesis can also specify a negative correlation  E.g.: the higher the inflation rate in the country, lower the purchasing power of the people. 15
  • 16.
    Contd… Here the researcheris intellectually committed to a particular outcome and the anticipated direction of the relationship between variables is also specified i.e. the investigator predicts not only the existence of a relationship but also its nature Such type of hypothesis is generally use by scientific journal If the normal or t-distribution is used, one side or one tailed test only is employed to estimate the required probabilities 16
  • 17.
    Contd… Figure 1. Directional/One-tailedTest To reject H0: μ1 ≤ μ2 and accept H1: μ1 > μ2 0, using the normal distribution, a normal deviate greater than +1.64 (i.e. right tailed) is required for significant at the 0.05 level. 17
  • 18.
    Contd… Likewise, to rejectH0: μ1 ≥ μ2 and accept H1: μ1 < μ2, the corresponding normal curve is less than -1.64 (i.e. left tailed) The choice between a non-directional or directional alternative hypothesis should be determined by the rationale that gives rise to the study and should be made before the data are gathered. The major advantage of a directional alternative hypothesis is that it takes less of a deviation from expectation to reject the null hypothesis 18
  • 19.
    19 Figure 1. Directional/One-tailedTest Figure 1. Non-Directional/Two-tailed Test
  • 20.
    Non-directional Hypothesis States that“The independent variable will have an influence on the dependent variable, but the direction of the outcome is not specified” For e.g.: “There will be a difference in the yield of two varieties of rice namely, Basmati and Mansuli being cultivated” A non-directional hypothesis only states that there exists a difference between the two group/items but does not specify which will be greater/smaller, positive/negative, faster/slower etc. Similarly, in case of correlational study, we simply state that variables will be correlated but do not state whether the relationship will be positive or negative, e.g. there will be a significant correlation between variable X and variable Y 20
  • 21.
    Contd… We may wishto test the null hypothesis H0:μ1− μ2 = 0 against the alternative H1:μ1− μ2 ≠ 0. This means that if H0 is rejected, the decision is that a difference exists between the two means. No confirmation about the direction of the difference is made. Such test is a non-directional test. Sometime called a two-tailed or two-sided test, because if the normal distribution or t-distribution is used, the two tails of the distribution are employed in the estimation of probabilities 21
  • 22.
    Contd… Figure 2. Non-directional/Two-tailedTest Consider a 5% significance level. If the sampling distribution is normal, 2.5% of the area of the curve falls to the right of 1.96 standard deviation units above the mean, and 2.5% lies to the left of 1.96 standard deviation units lower the mean. 22
  • 23.
    Procedure For HypothesisTesting 1. Making a formal statement 2. Selecting a significance level 3. Deciding the distribution to use 4. Selecting a random sample and computing an appropriate value 5. Calculation of the probability 6. Comparing the probability 23
  • 24.
    Tests of Hypotheses IMPORTANTPARAMETRIC TESTS The important parametric tests are: (1) z-test (2) t-test (3) Chi-Square-test, and (4) F-test (All these tests are based on the assumption of normality i.e., the source of data is considered to be normally distributed) 24
  • 25.
    z-test Based on thenormal probability (z) distribution and is used for judging the significance of several statistical measures, particularly the mean z-test is generally used for comparing the mean of a sample to some hypothesized mean for the population in case of large sample (>30) Besides, this test may be used for judging the significance of median, mode, coefficient of correlation and several other measures 25
  • 26.
    t-test t-test is basedon t-distribution and is considered an appropriate test for judging the significance of a sample mean or for judging the significance of difference between the means of two samples in case of small sample(<30) In case two samples are related, we use paired t-test (aka. difference test) for judging the significance of the mean of difference between the two related samples. It can also be used for judging the significance of the coefficients of simple and partial correlations 26
  • 27.
    Contd… t-statistic is calculatedfrom the sample data and then compared with its probable value based on t-distribution (to be read from the table that gives probable values of t for different levels of significance for different degrees of freedom) at a specified level of significance for concerning degrees of freedom for accepting or rejecting the null hypothesis 27
  • 28.
    Chi-Square-test Chi-Square-test is basedon chi-square distribution and as a parametric test is used for comparing a sample variance to a theoretical population variance It can also be used to make comparisons between theoretical populations and actual data when categories are used. Thus, the chi-square test is applicable in large number of problems. The test is, in fact, a technique through the use of which it is possible for all researchers to: (i) test the goodness of fit (ii) test the significance of association between two attributes, (iii) test the homogeneity or the significance of population variance. 28
  • 29.
    F-test F-test is basedon F-distribution and is used to compare the variance of the two-independent samples. This test is also used in the context of analysis of variance (ANOVA) for judging the significance of more than two sample means at one and the same time. It is also used for judging the significance of multiple correlation coefficients F-statistic is calculated and compared with its probable value (to be seen in the F-ratio tables for different degrees of freedom for greater and smaller variances at specified level of significance) for accepting or rejecting the null hypothesis 29
  • 30.
    Conclusion Research hypothesis isa specific, testable and precise prediction about what the researcher assumes to happen in their study There are four types of research hypothesis (null, alternate, directional and non- directional hypothesis) Hypothesis testing is done to determine whether there is sufficient statistical evidence that supports a certain hypothesis about the population parameter or not Null hypothesis is the hypothesis of no difference i.e. same 30
  • 31.
    Contd… Directional hypothesis predictsthe nature of the effect of the independent variable on the dependent variable i.e. direction of outcome is specified Non directional hypothesis predicts the influence of independent variable on the dependent variable, but the direction of the outcome is not specified Test for hypotheses testing: t-test, z-test, chi-square test, F-test 31
  • 32.
    References Agresti, A., &Finlay, B. (1997). Statistical Methods for the Social Sciences (3rd ed.). Prentice Hall. CFI. (2020). Null Hypothesis. Retrieved from Corporate Finance Institute: https://corporatefinanceinstitute.com/resources/knowledge/other/null-hypothesis-2/ Development of the Research Hypothesis and Types of Hypothesis. (2018). Retrieved from THEINTACTONE: https://theintactone.com/2018/02/26/br-u1-topic-3-development-of-the- research-hypothesis-and-types-of-hypothesis/ McLeod, S. (2018, August 10). What is a hypothesis. Retrieved from Simply Psychology: https://www.simplypsychology.org/what-is-a-hypotheses.html Muhammad, K. S. (2016). Formulating and Testing Hypothesis. In Basic Guideline for Research (pp. 51-71). 32
  • 33.