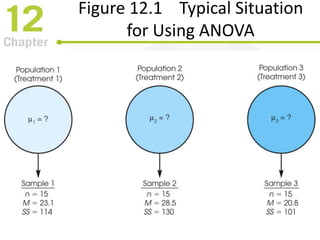
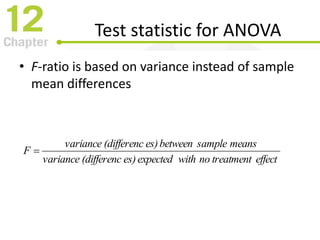
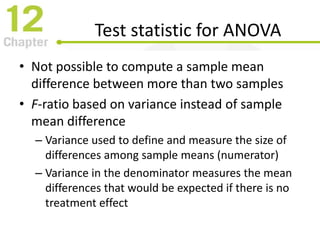
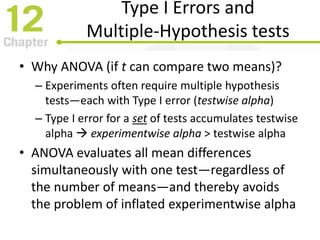
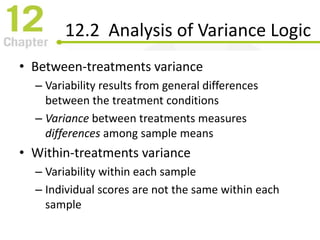
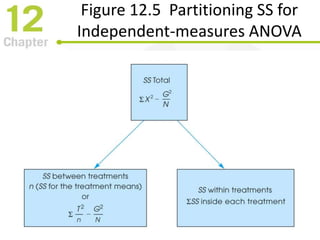
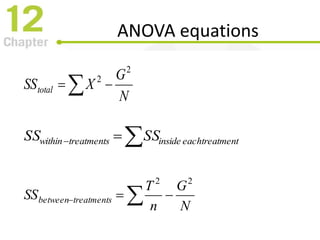
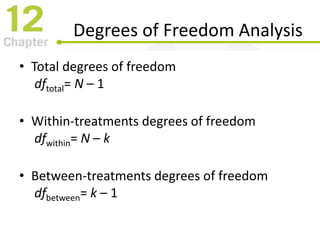
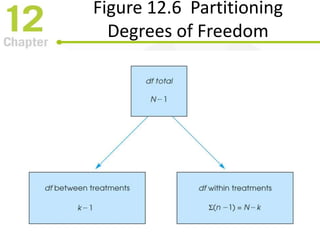
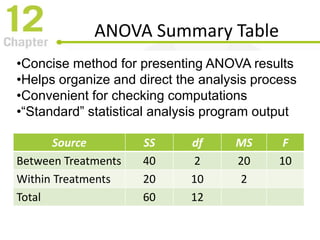
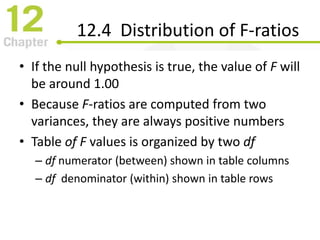
SlideShare a Scribd company logo
Chapter 12
Introduction to Analysis of Variance
PowerPoint Lecture Slides
Essentials of Statistics for the
Behavioral Sciences
Eighth Edition
by Frederick J. Gravetter and Larry B. Wallnau
Chapter 12 Learning Outcomes
• Explain purpose and logic of Analysis of
Variance1
• Perform Analysis of Variance on data from
single-factor study2
• Know when and why to use post hoc tests
(posttests)3
• Compute Tukey’s HSD and Scheffé test post
hoc tests4
• Compute η2 to measure effect size5
Tools You Will Need
• Variability (Chapter 4)
– Sum of squares
– Sample variance
– Degrees of freedom
• Introduction to hypothesis testing (Chapter 8)
– The logic of hypothesis testing
• Independent-measures t statistic (Chapter 10)
12.1 Introduction to Analysis
of Variance
• Analysis of variance
– Used to evaluate mean differences between two
or more treatments
– Uses sample data as basis for drawing general
conclusions about populations
• Clear advantage over a t test: it can be used
to compare more than two treatments at the
same time
Figure 12.1 Typical Situation
for Using ANOVA
Terminology
• Factor
– The independent (or quasi-independent) variable
that designates the groups being compared
• Levels
– Individual conditions or values that make up
a factor
• Factorial design
– A study that combines two or more factors
Figure 12.2
Two-Factor Research Design
Statistical Hypotheses for ANOVA
• Null hypothesis: the level or value on the
factor does not affect the dependent variable
– In the population, this is equivalent to saying that
the means of the groups do not differ from each
other
•
3210 :  H
Alternate Hypothesis for ANOVA
• H1: There is at least one mean difference
among the populations (Acceptable
shorthand is “Not H0”)
• Issue: how many ways can H0 be wrong?
– All means are different from every other mean
– Some means are not different from some others,
but other means do differ from some means
Test statistic for ANOVA
• F-ratio is based on variance instead of sample
mean differences
effecttreatmentnowithexpectedes)(differencvariance
meanssamplebetweenes)(differencvariance
F 
Test statistic for ANOVA
• Not possible to compute a sample mean
difference between more than two samples
• F-ratio based on variance instead of sample
mean difference
– Variance used to define and measure the size of
differences among sample means (numerator)
– Variance in the denominator measures the mean
differences that would be expected if there is no
treatment effect
Type I Errors and
Multiple-Hypothesis tests
• Why ANOVA (if t can compare two means)?
– Experiments often require multiple hypothesis
tests—each with Type I error (testwise alpha)
– Type I error for a set of tests accumulates testwise
alpha  experimentwise alpha > testwise alpha
• ANOVA evaluates all mean differences
simultaneously with one test—regardless of
the number of means—and thereby avoids
the problem of inflated experimentwise alpha
12.2 Analysis of Variance Logic
• Between-treatments variance
– Variability results from general differences
between the treatment conditions
– Variance between treatments measures
differences among sample means
• Within-treatments variance
– Variability within each sample
– Individual scores are not the same within each
sample
Sources of Variability
Between Treatments
• Systematic differences caused
by treatments
• Random, unsystematic differences
– Individual differences
– Experimental (measurement) error
Sources of Variability
Within Treatments
• No systematic differences related to treatment
groups occur within each group
• Random, unsystematic differences
– Individual differences
– Experimental (measurement) error
effectstreatmentnowithsdifference
effectstreatmentanyincludingsdifference
F 
Figure 12.3 Total Variability
Partitioned into Two Components
F-ratio
• If H0 is true:
– Size of treatment effect is near zero
– F is near 1.00
• If H1 is true:
– Size of treatment effect is more than 0.
– F is noticeably larger than 1.00
• Denominator of the F-ratio is called the
error term
Learning Check
• Decide if each of the following statements
is True or False
• ANOVA allows researchers to compare
several treatment conditions without
conducting several hypothesis tests
T/F
• If the null hypothesis is true, the
F-ratio for ANOVA is expected (on
average) to have a value of 0
T/F
Learning Check - Answers
• Several conditions can be
compared in one testTrue
• If the null hypothesis is true, the
F-ratio will have a value near 1.00
False
12.3 ANOVA Notation
and Formulas
• Number of treatment conditions: k
• Number of scores in each treatment: n1, n2…
• Total number of scores: N
– When all samples are same size, N = kn
• Sum of scores (ΣX) for each treatment: T
• Grand total of all scores in study: G = ΣT
• No universally accepted notation for ANOVA;
Other sources may use other symbols
Figure 12.4 ANOVA Calculation
Structure and Sequence
Figure 12.5 Partitioning SS for
Independent-measures ANOVA
ANOVA equations
N
G
XSStotal
2
2
 
 treatmenteachinsidetreatmentswithin SSSS
N
G
n
T
SS treatmentsbetween
22
 
Degrees of Freedom Analysis
• Total degrees of freedom
dftotal= N – 1
• Within-treatments degrees of freedom
dfwithin= N – k
• Between-treatments degrees of freedom
dfbetween= k – 1
Figure 12.6 Partitioning
Degrees of Freedom
Mean Squares and F-ratio
within
within
withinwithin
df
SS
sMS  2
between
between
betweenbetween
df
SS
sMS  2
within
between
within
between
MS
MS
s
s
F  2
2
ANOVA Summary Table
Source SS df MS F
Between Treatments 40 2 20 10
Within Treatments 20 10 2
Total 60 12
•Concise method for presenting ANOVA results
•Helps organize and direct the analysis process
•Convenient for checking computations
•“Standard” statistical analysis program output
Learning Check
• An analysis of variance produces SStotal = 80
and SSwithin = 30. For this analysis, what is
SSbetween?
• 50A
• 110B
• 2400C
• More information is neededD
Learning Check - Answer
• An analysis of variance produces SStotal = 80
and SSwithin = 30. For this analysis, what is
SSbetween?
• 50A
• 110B
• 2400C
• More information is neededD
12.4 Distribution of F-ratios
• If the null hypothesis is true, the value of F will
be around 1.00
• Because F-ratios are computed from two
variances, they are always positive numbers
• Table of F values is organized by two df
– df numerator (between) shown in table columns
– df denominator (within) shown in table rows
Figure 12.7
Distribution of F-ratios
12.5 Examples of Hypothesis
Testing and Effect Size
• Hypothesis tests use the same four steps that
have been used in earlier hypothesis tests.
• Computation of the test statistic F is done
in stages
– Compute SStotal, SSbetween, SSwithin
– Compute MStotal, MSbetween, MSwithin
– Compute F
Figure 12.8 Critical region for α=.01
in Distribution of F-ratios
Measuring Effect size for
ANOVA
• Compute percentage of variance accounted
for by the treatment conditions
• In published reports of ANOVA, effect size is
usually called η2 (“eta squared”)
– r2 concept (proportion of variance explained)
total
treatmentsbetween
SS
SS
2

In the Literature
• Treatment means and standard deviations are
presented in text, table or graph
• Results of ANOVA are summarized, including
– F and df
– p-value
– η2
• E.g., F(3,20) = 6.45, p<.01, η2 = 0.492
Figure 12.9 Visual Representation
of Between & Within Variability
MSwithin and Pooled Variance
• In the t-statistic and in the F-ratio, the
variances from the separate samples are
pooled together to create one average value
for the sample variance
• Numerator of F-ratio measures how much
difference exists between treatment means.
• Denominator measures the variance of the
scores inside each treatment
12.6 post hoc Tests
• ANOVA compares all individual mean
differences simultaneously, in one test
• A significant F-ratio indicates that at least one
difference in means is statistically significant
– Does not indicate which means differ significantly
from each other!
• post hoc tests are follow up tests done to
determine exactly which mean differences are
significant, and which are not
Experimentwise Alpha
• post hoc tests compare two individual means
at a time (pairwise comparison)
– Each comparison includes risk of a Type I error
– Risk of Type I error accumulates and is called the
experimentwise alpha level.
• Increasing the number of hypothesis tests
increases the total probability of a Type I error
• post hoc (“posttests”) use special methods to
try to control experimentwise Type I error rate
Tukey’s Honestly Significant
Difference
• A single value that determines the minimum
difference between treatment means that is
necessary to claim statistical significance–a
difference large enough that p < αexperimentwise
– Honestly Significant Difference (HSD)
n
MS
qHSD within

The Scheffé Test
• The Scheffé test is one of the safest of all
possible post hoc tests
– Uses an F-ratio to evaluate significance of the
difference between two treatment conditions
groupstwoofSSwithcalculatedBA versus
within
between
MS
MS
F 
Learning Check
• Which combination of factors is most likely to
produce a large value for the F-ratio?
• large mean differences
and large sample variancesA
• large mean differences
and small sample variancesB
• small mean differences
and large sample variancesC
• small mean differences
and small sample variancesD
Learning Check - Answer
• Which combination of factors is most likely to
produce a large value for the F-ratio?
• large mean differences
and large sample variancesA
• large mean differences
and small sample variancesB
• small mean differences
and large sample variancesC
• small mean differences
and small sample variancesD
Learning Check
• Decide if each of the following statements
is True or False
• Post tests are needed if the decision from
an analysis of variance is “fail to reject the
null hypothesis”
T/F
• A report shows ANOVA results: F(2, 27) =
5.36, p < .05. You can conclude that the
study used a total of 30 participants
T/F
Learning Check - Answers
• post hoc tests are needed only if
you reject H0 (indicating at least
one mean difference is significant)
False
• Because dftotal = N-1 and
• Because dftotal = dfbetween + dfwithin
True
12.7 Relationship between
ANOVA and t tests
• For two independent samples, either t or F
can be used
– Always result in same decision
– F = t2
• For any value of α, (tcritical)2 = Fcritical
Figure 12.10
Distribution of t and F statistics
Independent Measures
ANOVA Assumptions
• The observations within each sample must be
independent
• The population from which the samples are
selected must be normal
• The populations from which the samples are
selected must have equal variances
(homogeneity of variance)
• Violating the assumption of homogeneity of
variance risks invalid test results
Figure 12.11
Formulas for ANOVA
Figure 12.12
Distribution of t and F statistics
Any
Questions
?
Concepts
?
Equations?

More Related Content

What's hot

Z-scores: Location of Scores and Standardized Distributions
Z-scores: Location of Scores and Standardized DistributionsZ-scores: Location of Scores and Standardized Distributions
Z-scores: Location of Scores and Standardized Distributions
jasondroesch
 
Measures of Central Tendency
Measures of Central TendencyMeasures of Central Tendency
Measures of Central Tendency
jasondroesch
 
Full Lecture Presentation on ANOVA
Full Lecture Presentation on ANOVAFull Lecture Presentation on ANOVA
Full Lecture Presentation on ANOVA
StevegellKololi
 
Correlation and Regression
Correlation and RegressionCorrelation and Regression
Correlation and Regression
jasondroesch
 
T test, independant sample, paired sample and anova
T test, independant sample, paired sample and anovaT test, independant sample, paired sample and anova
T test, independant sample, paired sample and anovaQasim Raza
 
Non parametric-tests
Non parametric-testsNon parametric-tests
Non parametric-tests
Asmita Bhagdikar
 
Inferential statistics
Inferential statisticsInferential statistics
Inferential statistics
Dalia El-Shafei
 
9. basic concepts_of_one_way_analysis_of_variance_(anova)
9. basic concepts_of_one_way_analysis_of_variance_(anova)9. basic concepts_of_one_way_analysis_of_variance_(anova)
9. basic concepts_of_one_way_analysis_of_variance_(anova)
Irfan Hussain
 
Anova, ancova, manova thiyagu
Anova, ancova, manova   thiyaguAnova, ancova, manova   thiyagu
Anova, ancova, manova thiyagu
Thiyagu K
 
Inferential Statistics
Inferential StatisticsInferential Statistics
Inferential Statistics
ewhite00
 
Frequency Distributions
Frequency DistributionsFrequency Distributions
Frequency Distributions
jasondroesch
 
Statistical inference: Statistical Power, ANOVA, and Post Hoc tests
Statistical inference: Statistical Power, ANOVA, and Post Hoc testsStatistical inference: Statistical Power, ANOVA, and Post Hoc tests
Statistical inference: Statistical Power, ANOVA, and Post Hoc tests
Eugene Yan Ziyou
 
Probability
ProbabilityProbability
Probability
jasondroesch
 
F Distribution
F  DistributionF  Distribution
F Distributionjravish
 
Anova single factor
Anova single factorAnova single factor
Anova single factor
Dhruv Patel
 
Manova ppt
Manova pptManova ppt
Manova ppt
AnupVs2
 
One Sample T Test
One Sample T TestOne Sample T Test
One Sample T Testshoffma5
 
Reporting Pearson Correlation Test of Independence in APA
Reporting Pearson Correlation Test of Independence in APAReporting Pearson Correlation Test of Independence in APA
Reporting Pearson Correlation Test of Independence in APA
Ken Plummer
 

What's hot (20)

Z-scores: Location of Scores and Standardized Distributions
Z-scores: Location of Scores and Standardized DistributionsZ-scores: Location of Scores and Standardized Distributions
Z-scores: Location of Scores and Standardized Distributions
 
Measures of Central Tendency
Measures of Central TendencyMeasures of Central Tendency
Measures of Central Tendency
 
Full Lecture Presentation on ANOVA
Full Lecture Presentation on ANOVAFull Lecture Presentation on ANOVA
Full Lecture Presentation on ANOVA
 
Chi square mahmoud
Chi square mahmoudChi square mahmoud
Chi square mahmoud
 
Correlation and Regression
Correlation and RegressionCorrelation and Regression
Correlation and Regression
 
T test, independant sample, paired sample and anova
T test, independant sample, paired sample and anovaT test, independant sample, paired sample and anova
T test, independant sample, paired sample and anova
 
Non parametric-tests
Non parametric-testsNon parametric-tests
Non parametric-tests
 
Inferential statistics
Inferential statisticsInferential statistics
Inferential statistics
 
9. basic concepts_of_one_way_analysis_of_variance_(anova)
9. basic concepts_of_one_way_analysis_of_variance_(anova)9. basic concepts_of_one_way_analysis_of_variance_(anova)
9. basic concepts_of_one_way_analysis_of_variance_(anova)
 
Anova, ancova, manova thiyagu
Anova, ancova, manova   thiyaguAnova, ancova, manova   thiyagu
Anova, ancova, manova thiyagu
 
Inferential Statistics
Inferential StatisticsInferential Statistics
Inferential Statistics
 
Frequency Distributions
Frequency DistributionsFrequency Distributions
Frequency Distributions
 
Statistical inference: Statistical Power, ANOVA, and Post Hoc tests
Statistical inference: Statistical Power, ANOVA, and Post Hoc testsStatistical inference: Statistical Power, ANOVA, and Post Hoc tests
Statistical inference: Statistical Power, ANOVA, and Post Hoc tests
 
Manova Report
Manova ReportManova Report
Manova Report
 
Probability
ProbabilityProbability
Probability
 
F Distribution
F  DistributionF  Distribution
F Distribution
 
Anova single factor
Anova single factorAnova single factor
Anova single factor
 
Manova ppt
Manova pptManova ppt
Manova ppt
 
One Sample T Test
One Sample T TestOne Sample T Test
One Sample T Test
 
Reporting Pearson Correlation Test of Independence in APA
Reporting Pearson Correlation Test of Independence in APAReporting Pearson Correlation Test of Independence in APA
Reporting Pearson Correlation Test of Independence in APA
 

Similar to Introduction to Analysis of Variance

Analysis of Variance
Analysis of VarianceAnalysis of Variance
Analysis of Variance
Kaori Kubo Germano, PhD
 
Analysis of Variance
Analysis of VarianceAnalysis of Variance
Analysis of Variance
Shailesh Dewangan
 
1 ANOVA.ppt
1 ANOVA.ppt1 ANOVA.ppt
1 ANOVA.ppt
Alemayehu70
 
Day 12 t test for dependent samples and single samples pdf
Day 12 t test for dependent samples and single samples pdfDay 12 t test for dependent samples and single samples pdf
Day 12 t test for dependent samples and single samples pdf
Elih Sutisna Yanto
 
Applied statistics lecture_8
Applied statistics lecture_8Applied statistics lecture_8
Applied statistics lecture_8Daria Bogdanova
 
tests of significance
tests of significancetests of significance
tests of significance
benita regi
 
Repeated Measures ANOVA
Repeated Measures ANOVARepeated Measures ANOVA
Repeated Measures ANOVA
Kaori Kubo Germano, PhD
 
(Individuals With Disabilities Act Transformation Over the Years)D
(Individuals With Disabilities Act Transformation Over the Years)D(Individuals With Disabilities Act Transformation Over the Years)D
(Individuals With Disabilities Act Transformation Over the Years)D
SilvaGraf83
 
(Individuals With Disabilities Act Transformation Over the Years)D
(Individuals With Disabilities Act Transformation Over the Years)D(Individuals With Disabilities Act Transformation Over the Years)D
(Individuals With Disabilities Act Transformation Over the Years)D
MoseStaton39
 
univariate and bivariate analysis in spss
univariate and bivariate analysis in spss univariate and bivariate analysis in spss
univariate and bivariate analysis in spss
Subodh Khanal
 
Analyzing Results
Analyzing ResultsAnalyzing Results
Analyzing Results
Veniez Sunga
 
Parametric tests
Parametric  testsParametric  tests
Parametric tests
shefali jain
 
Emil Pulido on Quantitative Research: Inferential Statistics
Emil Pulido on Quantitative Research: Inferential StatisticsEmil Pulido on Quantitative Research: Inferential Statistics
Emil Pulido on Quantitative Research: Inferential Statistics
EmilEJP
 
Inferential statistics_AAF 500L 2021.ppt
Inferential statistics_AAF 500L 2021.pptInferential statistics_AAF 500L 2021.ppt
Inferential statistics_AAF 500L 2021.ppt
OfeniJoshuaSeyi
 
INFERENTIAL TECHNIQUES. Inferential Stat. pt 3
INFERENTIAL TECHNIQUES. Inferential Stat. pt 3INFERENTIAL TECHNIQUES. Inferential Stat. pt 3
INFERENTIAL TECHNIQUES. Inferential Stat. pt 3
John Labrador
 
mean comparison.pptx
mean comparison.pptxmean comparison.pptx
mean comparison.pptx
FenembarMekonnen
 
mean comparison.pptx
mean comparison.pptxmean comparison.pptx
mean comparison.pptx
FenembarMekonnen
 
Analysis of Variance (ANOVA)
Analysis of Variance (ANOVA)Analysis of Variance (ANOVA)
Analysis of Variance (ANOVA)
Avjinder (Avi) Kaler
 
Statistics for Anaesthesiologists
Statistics for AnaesthesiologistsStatistics for Anaesthesiologists
Statistics for Anaesthesiologists
xeonfusion
 

Similar to Introduction to Analysis of Variance (20)

Analysis of Variance
Analysis of VarianceAnalysis of Variance
Analysis of Variance
 
Analysis of Variance
Analysis of VarianceAnalysis of Variance
Analysis of Variance
 
1 ANOVA.ppt
1 ANOVA.ppt1 ANOVA.ppt
1 ANOVA.ppt
 
Day 12 t test for dependent samples and single samples pdf
Day 12 t test for dependent samples and single samples pdfDay 12 t test for dependent samples and single samples pdf
Day 12 t test for dependent samples and single samples pdf
 
Applied statistics lecture_8
Applied statistics lecture_8Applied statistics lecture_8
Applied statistics lecture_8
 
tests of significance
tests of significancetests of significance
tests of significance
 
Repeated Measures ANOVA
Repeated Measures ANOVARepeated Measures ANOVA
Repeated Measures ANOVA
 
(Individuals With Disabilities Act Transformation Over the Years)D
(Individuals With Disabilities Act Transformation Over the Years)D(Individuals With Disabilities Act Transformation Over the Years)D
(Individuals With Disabilities Act Transformation Over the Years)D
 
(Individuals With Disabilities Act Transformation Over the Years)D
(Individuals With Disabilities Act Transformation Over the Years)D(Individuals With Disabilities Act Transformation Over the Years)D
(Individuals With Disabilities Act Transformation Over the Years)D
 
univariate and bivariate analysis in spss
univariate and bivariate analysis in spss univariate and bivariate analysis in spss
univariate and bivariate analysis in spss
 
Analyzing Results
Analyzing ResultsAnalyzing Results
Analyzing Results
 
Parametric tests
Parametric  testsParametric  tests
Parametric tests
 
Emil Pulido on Quantitative Research: Inferential Statistics
Emil Pulido on Quantitative Research: Inferential StatisticsEmil Pulido on Quantitative Research: Inferential Statistics
Emil Pulido on Quantitative Research: Inferential Statistics
 
Inferential statistics_AAF 500L 2021.ppt
Inferential statistics_AAF 500L 2021.pptInferential statistics_AAF 500L 2021.ppt
Inferential statistics_AAF 500L 2021.ppt
 
INFERENTIAL TECHNIQUES. Inferential Stat. pt 3
INFERENTIAL TECHNIQUES. Inferential Stat. pt 3INFERENTIAL TECHNIQUES. Inferential Stat. pt 3
INFERENTIAL TECHNIQUES. Inferential Stat. pt 3
 
mean comparison.pptx
mean comparison.pptxmean comparison.pptx
mean comparison.pptx
 
mean comparison.pptx
mean comparison.pptxmean comparison.pptx
mean comparison.pptx
 
Analysis of Variance (ANOVA)
Analysis of Variance (ANOVA)Analysis of Variance (ANOVA)
Analysis of Variance (ANOVA)
 
Statistics for Anaesthesiologists
Statistics for AnaesthesiologistsStatistics for Anaesthesiologists
Statistics for Anaesthesiologists
 
ANOVA Parametric test: Biostatics and Research Methodology
ANOVA Parametric test: Biostatics and Research MethodologyANOVA Parametric test: Biostatics and Research Methodology
ANOVA Parametric test: Biostatics and Research Methodology
 

Recently uploaded

Guidance_and_Counselling.pdf B.Ed. 4th Semester
Guidance_and_Counselling.pdf B.Ed. 4th SemesterGuidance_and_Counselling.pdf B.Ed. 4th Semester
Guidance_and_Counselling.pdf B.Ed. 4th Semester
Atul Kumar Singh
 
BÀI TẬP BỔ TRỢ TIẾNG ANH GLOBAL SUCCESS LỚP 3 - CẢ NĂM (CÓ FILE NGHE VÀ ĐÁP Á...
BÀI TẬP BỔ TRỢ TIẾNG ANH GLOBAL SUCCESS LỚP 3 - CẢ NĂM (CÓ FILE NGHE VÀ ĐÁP Á...BÀI TẬP BỔ TRỢ TIẾNG ANH GLOBAL SUCCESS LỚP 3 - CẢ NĂM (CÓ FILE NGHE VÀ ĐÁP Á...
BÀI TẬP BỔ TRỢ TIẾNG ANH GLOBAL SUCCESS LỚP 3 - CẢ NĂM (CÓ FILE NGHE VÀ ĐÁP Á...
Nguyen Thanh Tu Collection
 
Operation Blue Star - Saka Neela Tara
Operation Blue Star   -  Saka Neela TaraOperation Blue Star   -  Saka Neela Tara
Operation Blue Star - Saka Neela Tara
Balvir Singh
 
Welcome to TechSoup New Member Orientation and Q&A (May 2024).pdf
Welcome to TechSoup   New Member Orientation and Q&A (May 2024).pdfWelcome to TechSoup   New Member Orientation and Q&A (May 2024).pdf
Welcome to TechSoup New Member Orientation and Q&A (May 2024).pdf
TechSoup
 
The French Revolution Class 9 Study Material pdf free download
The French Revolution Class 9 Study Material pdf free downloadThe French Revolution Class 9 Study Material pdf free download
The French Revolution Class 9 Study Material pdf free download
Vivekanand Anglo Vedic Academy
 
Language Across the Curriculm LAC B.Ed.
Language Across the  Curriculm LAC B.Ed.Language Across the  Curriculm LAC B.Ed.
Language Across the Curriculm LAC B.Ed.
Atul Kumar Singh
 
Palestine last event orientationfvgnh .pptx
Palestine last event orientationfvgnh .pptxPalestine last event orientationfvgnh .pptx
Palestine last event orientationfvgnh .pptx
RaedMohamed3
 
Digital Tools and AI for Teaching Learning and Research
Digital Tools and AI for Teaching Learning and ResearchDigital Tools and AI for Teaching Learning and Research
Digital Tools and AI for Teaching Learning and Research
Vikramjit Singh
 
Home assignment II on Spectroscopy 2024 Answers.pdf
Home assignment II on Spectroscopy 2024 Answers.pdfHome assignment II on Spectroscopy 2024 Answers.pdf
Home assignment II on Spectroscopy 2024 Answers.pdf
Tamralipta Mahavidyalaya
 
Model Attribute Check Company Auto Property
Model Attribute  Check Company Auto PropertyModel Attribute  Check Company Auto Property
Model Attribute Check Company Auto Property
Celine George
 
Polish students' mobility in the Czech Republic
Polish students' mobility in the Czech RepublicPolish students' mobility in the Czech Republic
Polish students' mobility in the Czech Republic
Anna Sz.
 
Unit 8 - Information and Communication Technology (Paper I).pdf
Unit 8 - Information and Communication Technology (Paper I).pdfUnit 8 - Information and Communication Technology (Paper I).pdf
Unit 8 - Information and Communication Technology (Paper I).pdf
Thiyagu K
 
Mule 4.6 & Java 17 Upgrade | MuleSoft Mysore Meetup #46
Mule 4.6 & Java 17 Upgrade | MuleSoft Mysore Meetup #46Mule 4.6 & Java 17 Upgrade | MuleSoft Mysore Meetup #46
Mule 4.6 & Java 17 Upgrade | MuleSoft Mysore Meetup #46
MysoreMuleSoftMeetup
 
How libraries can support authors with open access requirements for UKRI fund...
How libraries can support authors with open access requirements for UKRI fund...How libraries can support authors with open access requirements for UKRI fund...
How libraries can support authors with open access requirements for UKRI fund...
Jisc
 
Adversarial Attention Modeling for Multi-dimensional Emotion Regression.pdf
Adversarial Attention Modeling for Multi-dimensional Emotion Regression.pdfAdversarial Attention Modeling for Multi-dimensional Emotion Regression.pdf
Adversarial Attention Modeling for Multi-dimensional Emotion Regression.pdf
Po-Chuan Chen
 
Thesis Statement for students diagnonsed withADHD.ppt
Thesis Statement for students diagnonsed withADHD.pptThesis Statement for students diagnonsed withADHD.ppt
Thesis Statement for students diagnonsed withADHD.ppt
EverAndrsGuerraGuerr
 
Lapbook sobre os Regimes Totalitários.pdf
Lapbook sobre os Regimes Totalitários.pdfLapbook sobre os Regimes Totalitários.pdf
Lapbook sobre os Regimes Totalitários.pdf
Jean Carlos Nunes Paixão
 
CLASS 11 CBSE B.St Project AIDS TO TRADE - INSURANCE
CLASS 11 CBSE B.St Project AIDS TO TRADE - INSURANCECLASS 11 CBSE B.St Project AIDS TO TRADE - INSURANCE
CLASS 11 CBSE B.St Project AIDS TO TRADE - INSURANCE
BhavyaRajput3
 
Introduction to AI for Nonprofits with Tapp Network
Introduction to AI for Nonprofits with Tapp NetworkIntroduction to AI for Nonprofits with Tapp Network
Introduction to AI for Nonprofits with Tapp Network
TechSoup
 
special B.ed 2nd year old paper_20240531.pdf
special B.ed 2nd year old paper_20240531.pdfspecial B.ed 2nd year old paper_20240531.pdf
special B.ed 2nd year old paper_20240531.pdf
Special education needs
 

Recently uploaded (20)

Guidance_and_Counselling.pdf B.Ed. 4th Semester
Guidance_and_Counselling.pdf B.Ed. 4th SemesterGuidance_and_Counselling.pdf B.Ed. 4th Semester
Guidance_and_Counselling.pdf B.Ed. 4th Semester
 
BÀI TẬP BỔ TRỢ TIẾNG ANH GLOBAL SUCCESS LỚP 3 - CẢ NĂM (CÓ FILE NGHE VÀ ĐÁP Á...
BÀI TẬP BỔ TRỢ TIẾNG ANH GLOBAL SUCCESS LỚP 3 - CẢ NĂM (CÓ FILE NGHE VÀ ĐÁP Á...BÀI TẬP BỔ TRỢ TIẾNG ANH GLOBAL SUCCESS LỚP 3 - CẢ NĂM (CÓ FILE NGHE VÀ ĐÁP Á...
BÀI TẬP BỔ TRỢ TIẾNG ANH GLOBAL SUCCESS LỚP 3 - CẢ NĂM (CÓ FILE NGHE VÀ ĐÁP Á...
 
Operation Blue Star - Saka Neela Tara
Operation Blue Star   -  Saka Neela TaraOperation Blue Star   -  Saka Neela Tara
Operation Blue Star - Saka Neela Tara
 
Welcome to TechSoup New Member Orientation and Q&A (May 2024).pdf
Welcome to TechSoup   New Member Orientation and Q&A (May 2024).pdfWelcome to TechSoup   New Member Orientation and Q&A (May 2024).pdf
Welcome to TechSoup New Member Orientation and Q&A (May 2024).pdf
 
The French Revolution Class 9 Study Material pdf free download
The French Revolution Class 9 Study Material pdf free downloadThe French Revolution Class 9 Study Material pdf free download
The French Revolution Class 9 Study Material pdf free download
 
Language Across the Curriculm LAC B.Ed.
Language Across the  Curriculm LAC B.Ed.Language Across the  Curriculm LAC B.Ed.
Language Across the Curriculm LAC B.Ed.
 
Palestine last event orientationfvgnh .pptx
Palestine last event orientationfvgnh .pptxPalestine last event orientationfvgnh .pptx
Palestine last event orientationfvgnh .pptx
 
Digital Tools and AI for Teaching Learning and Research
Digital Tools and AI for Teaching Learning and ResearchDigital Tools and AI for Teaching Learning and Research
Digital Tools and AI for Teaching Learning and Research
 
Home assignment II on Spectroscopy 2024 Answers.pdf
Home assignment II on Spectroscopy 2024 Answers.pdfHome assignment II on Spectroscopy 2024 Answers.pdf
Home assignment II on Spectroscopy 2024 Answers.pdf
 
Model Attribute Check Company Auto Property
Model Attribute  Check Company Auto PropertyModel Attribute  Check Company Auto Property
Model Attribute Check Company Auto Property
 
Polish students' mobility in the Czech Republic
Polish students' mobility in the Czech RepublicPolish students' mobility in the Czech Republic
Polish students' mobility in the Czech Republic
 
Unit 8 - Information and Communication Technology (Paper I).pdf
Unit 8 - Information and Communication Technology (Paper I).pdfUnit 8 - Information and Communication Technology (Paper I).pdf
Unit 8 - Information and Communication Technology (Paper I).pdf
 
Mule 4.6 & Java 17 Upgrade | MuleSoft Mysore Meetup #46
Mule 4.6 & Java 17 Upgrade | MuleSoft Mysore Meetup #46Mule 4.6 & Java 17 Upgrade | MuleSoft Mysore Meetup #46
Mule 4.6 & Java 17 Upgrade | MuleSoft Mysore Meetup #46
 
How libraries can support authors with open access requirements for UKRI fund...
How libraries can support authors with open access requirements for UKRI fund...How libraries can support authors with open access requirements for UKRI fund...
How libraries can support authors with open access requirements for UKRI fund...
 
Adversarial Attention Modeling for Multi-dimensional Emotion Regression.pdf
Adversarial Attention Modeling for Multi-dimensional Emotion Regression.pdfAdversarial Attention Modeling for Multi-dimensional Emotion Regression.pdf
Adversarial Attention Modeling for Multi-dimensional Emotion Regression.pdf
 
Thesis Statement for students diagnonsed withADHD.ppt
Thesis Statement for students diagnonsed withADHD.pptThesis Statement for students diagnonsed withADHD.ppt
Thesis Statement for students diagnonsed withADHD.ppt
 
Lapbook sobre os Regimes Totalitários.pdf
Lapbook sobre os Regimes Totalitários.pdfLapbook sobre os Regimes Totalitários.pdf
Lapbook sobre os Regimes Totalitários.pdf
 
CLASS 11 CBSE B.St Project AIDS TO TRADE - INSURANCE
CLASS 11 CBSE B.St Project AIDS TO TRADE - INSURANCECLASS 11 CBSE B.St Project AIDS TO TRADE - INSURANCE
CLASS 11 CBSE B.St Project AIDS TO TRADE - INSURANCE
 
Introduction to AI for Nonprofits with Tapp Network
Introduction to AI for Nonprofits with Tapp NetworkIntroduction to AI for Nonprofits with Tapp Network
Introduction to AI for Nonprofits with Tapp Network
 
special B.ed 2nd year old paper_20240531.pdf
special B.ed 2nd year old paper_20240531.pdfspecial B.ed 2nd year old paper_20240531.pdf
special B.ed 2nd year old paper_20240531.pdf
 

Introduction to Analysis of Variance

  • 1. Chapter 12 Introduction to Analysis of Variance PowerPoint Lecture Slides Essentials of Statistics for the Behavioral Sciences Eighth Edition by Frederick J. Gravetter and Larry B. Wallnau
  • 2. Chapter 12 Learning Outcomes • Explain purpose and logic of Analysis of Variance1 • Perform Analysis of Variance on data from single-factor study2 • Know when and why to use post hoc tests (posttests)3 • Compute Tukey’s HSD and Scheffé test post hoc tests4 • Compute η2 to measure effect size5
  • 3. Tools You Will Need • Variability (Chapter 4) – Sum of squares – Sample variance – Degrees of freedom • Introduction to hypothesis testing (Chapter 8) – The logic of hypothesis testing • Independent-measures t statistic (Chapter 10)
  • 4. 12.1 Introduction to Analysis of Variance • Analysis of variance – Used to evaluate mean differences between two or more treatments – Uses sample data as basis for drawing general conclusions about populations • Clear advantage over a t test: it can be used to compare more than two treatments at the same time
  • 5. Figure 12.1 Typical Situation for Using ANOVA
  • 6. Terminology • Factor – The independent (or quasi-independent) variable that designates the groups being compared • Levels – Individual conditions or values that make up a factor • Factorial design – A study that combines two or more factors
  • 8. Statistical Hypotheses for ANOVA • Null hypothesis: the level or value on the factor does not affect the dependent variable – In the population, this is equivalent to saying that the means of the groups do not differ from each other • 3210 :  H
  • 9. Alternate Hypothesis for ANOVA • H1: There is at least one mean difference among the populations (Acceptable shorthand is “Not H0”) • Issue: how many ways can H0 be wrong? – All means are different from every other mean – Some means are not different from some others, but other means do differ from some means
  • 10. Test statistic for ANOVA • F-ratio is based on variance instead of sample mean differences effecttreatmentnowithexpectedes)(differencvariance meanssamplebetweenes)(differencvariance F 
  • 11. Test statistic for ANOVA • Not possible to compute a sample mean difference between more than two samples • F-ratio based on variance instead of sample mean difference – Variance used to define and measure the size of differences among sample means (numerator) – Variance in the denominator measures the mean differences that would be expected if there is no treatment effect
  • 12. Type I Errors and Multiple-Hypothesis tests • Why ANOVA (if t can compare two means)? – Experiments often require multiple hypothesis tests—each with Type I error (testwise alpha) – Type I error for a set of tests accumulates testwise alpha  experimentwise alpha > testwise alpha • ANOVA evaluates all mean differences simultaneously with one test—regardless of the number of means—and thereby avoids the problem of inflated experimentwise alpha
  • 13. 12.2 Analysis of Variance Logic • Between-treatments variance – Variability results from general differences between the treatment conditions – Variance between treatments measures differences among sample means • Within-treatments variance – Variability within each sample – Individual scores are not the same within each sample
  • 14. Sources of Variability Between Treatments • Systematic differences caused by treatments • Random, unsystematic differences – Individual differences – Experimental (measurement) error
  • 15. Sources of Variability Within Treatments • No systematic differences related to treatment groups occur within each group • Random, unsystematic differences – Individual differences – Experimental (measurement) error effectstreatmentnowithsdifference effectstreatmentanyincludingsdifference F 
  • 16. Figure 12.3 Total Variability Partitioned into Two Components
  • 17. F-ratio • If H0 is true: – Size of treatment effect is near zero – F is near 1.00 • If H1 is true: – Size of treatment effect is more than 0. – F is noticeably larger than 1.00 • Denominator of the F-ratio is called the error term
  • 18. Learning Check • Decide if each of the following statements is True or False • ANOVA allows researchers to compare several treatment conditions without conducting several hypothesis tests T/F • If the null hypothesis is true, the F-ratio for ANOVA is expected (on average) to have a value of 0 T/F
  • 19. Learning Check - Answers • Several conditions can be compared in one testTrue • If the null hypothesis is true, the F-ratio will have a value near 1.00 False
  • 20. 12.3 ANOVA Notation and Formulas • Number of treatment conditions: k • Number of scores in each treatment: n1, n2… • Total number of scores: N – When all samples are same size, N = kn • Sum of scores (ΣX) for each treatment: T • Grand total of all scores in study: G = ΣT • No universally accepted notation for ANOVA; Other sources may use other symbols
  • 21. Figure 12.4 ANOVA Calculation Structure and Sequence
  • 22. Figure 12.5 Partitioning SS for Independent-measures ANOVA
  • 23. ANOVA equations N G XSStotal 2 2    treatmenteachinsidetreatmentswithin SSSS N G n T SS treatmentsbetween 22  
  • 24. Degrees of Freedom Analysis • Total degrees of freedom dftotal= N – 1 • Within-treatments degrees of freedom dfwithin= N – k • Between-treatments degrees of freedom dfbetween= k – 1
  • 26. Mean Squares and F-ratio within within withinwithin df SS sMS  2 between between betweenbetween df SS sMS  2 within between within between MS MS s s F  2 2
  • 27. ANOVA Summary Table Source SS df MS F Between Treatments 40 2 20 10 Within Treatments 20 10 2 Total 60 12 •Concise method for presenting ANOVA results •Helps organize and direct the analysis process •Convenient for checking computations •“Standard” statistical analysis program output
  • 28. Learning Check • An analysis of variance produces SStotal = 80 and SSwithin = 30. For this analysis, what is SSbetween? • 50A • 110B • 2400C • More information is neededD
  • 29. Learning Check - Answer • An analysis of variance produces SStotal = 80 and SSwithin = 30. For this analysis, what is SSbetween? • 50A • 110B • 2400C • More information is neededD
  • 30. 12.4 Distribution of F-ratios • If the null hypothesis is true, the value of F will be around 1.00 • Because F-ratios are computed from two variances, they are always positive numbers • Table of F values is organized by two df – df numerator (between) shown in table columns – df denominator (within) shown in table rows
  • 32. 12.5 Examples of Hypothesis Testing and Effect Size • Hypothesis tests use the same four steps that have been used in earlier hypothesis tests. • Computation of the test statistic F is done in stages – Compute SStotal, SSbetween, SSwithin – Compute MStotal, MSbetween, MSwithin – Compute F
  • 33. Figure 12.8 Critical region for α=.01 in Distribution of F-ratios
  • 34. Measuring Effect size for ANOVA • Compute percentage of variance accounted for by the treatment conditions • In published reports of ANOVA, effect size is usually called η2 (“eta squared”) – r2 concept (proportion of variance explained) total treatmentsbetween SS SS 2 
  • 35. In the Literature • Treatment means and standard deviations are presented in text, table or graph • Results of ANOVA are summarized, including – F and df – p-value – η2 • E.g., F(3,20) = 6.45, p<.01, η2 = 0.492
  • 36. Figure 12.9 Visual Representation of Between & Within Variability
  • 37. MSwithin and Pooled Variance • In the t-statistic and in the F-ratio, the variances from the separate samples are pooled together to create one average value for the sample variance • Numerator of F-ratio measures how much difference exists between treatment means. • Denominator measures the variance of the scores inside each treatment
  • 38. 12.6 post hoc Tests • ANOVA compares all individual mean differences simultaneously, in one test • A significant F-ratio indicates that at least one difference in means is statistically significant – Does not indicate which means differ significantly from each other! • post hoc tests are follow up tests done to determine exactly which mean differences are significant, and which are not
  • 39. Experimentwise Alpha • post hoc tests compare two individual means at a time (pairwise comparison) – Each comparison includes risk of a Type I error – Risk of Type I error accumulates and is called the experimentwise alpha level. • Increasing the number of hypothesis tests increases the total probability of a Type I error • post hoc (“posttests”) use special methods to try to control experimentwise Type I error rate
  • 40. Tukey’s Honestly Significant Difference • A single value that determines the minimum difference between treatment means that is necessary to claim statistical significance–a difference large enough that p < αexperimentwise – Honestly Significant Difference (HSD) n MS qHSD within 
  • 41. The Scheffé Test • The Scheffé test is one of the safest of all possible post hoc tests – Uses an F-ratio to evaluate significance of the difference between two treatment conditions groupstwoofSSwithcalculatedBA versus within between MS MS F 
  • 42. Learning Check • Which combination of factors is most likely to produce a large value for the F-ratio? • large mean differences and large sample variancesA • large mean differences and small sample variancesB • small mean differences and large sample variancesC • small mean differences and small sample variancesD
  • 43. Learning Check - Answer • Which combination of factors is most likely to produce a large value for the F-ratio? • large mean differences and large sample variancesA • large mean differences and small sample variancesB • small mean differences and large sample variancesC • small mean differences and small sample variancesD
  • 44. Learning Check • Decide if each of the following statements is True or False • Post tests are needed if the decision from an analysis of variance is “fail to reject the null hypothesis” T/F • A report shows ANOVA results: F(2, 27) = 5.36, p < .05. You can conclude that the study used a total of 30 participants T/F
  • 45. Learning Check - Answers • post hoc tests are needed only if you reject H0 (indicating at least one mean difference is significant) False • Because dftotal = N-1 and • Because dftotal = dfbetween + dfwithin True
  • 46. 12.7 Relationship between ANOVA and t tests • For two independent samples, either t or F can be used – Always result in same decision – F = t2 • For any value of α, (tcritical)2 = Fcritical
  • 47. Figure 12.10 Distribution of t and F statistics
  • 48. Independent Measures ANOVA Assumptions • The observations within each sample must be independent • The population from which the samples are selected must be normal • The populations from which the samples are selected must have equal variances (homogeneity of variance) • Violating the assumption of homogeneity of variance risks invalid test results
  • 50. Figure 12.12 Distribution of t and F statistics

Editor's Notes

  1. FIGURE 12.1 A typical situation in which ANOVA would be used. Three separate samples are obtained to evaluate the mean differences among three populations (or treatments) with unknown means.
  2. FIGURE 12.2 A research design with two factors. The research study uses two factors: One factor uses two levels of therapy technique (I versus II), and the second factor uses three levels of time (before, after and 6 months after). Also notice that the therapy factor uses two separate groups (independent measures) and the time factor uses the same group for all three levels (repeated measures).
  3. Some instructors may want to spend some time listing some of the ways that the null hypothesis cold be wrong that do NOT include μ1 ≠ μ2 ≠ μ3 because many students make the logic error of assuming that if null is wrong then the ONLY way it can be wrong is if all the groups are significantly different from each other.
  4. Testwise Type I error rate and Experimentwise Type I error rate are sufficiently complex concepts that some instructors may want to expand the lecture materials on this topic.
  5. FIGURE 12.3 The independent-measures ANOVA partitions, or analyzes, the total variability into two components: variance between treatments and variance within treatments.
  6. FIGURE 12.4 The structure and sequence of calculations for the ANOVA.
  7. FIGURE 12.5 Partitioning the sum of squares (SS) for the independent-measures ANOVA.
  8. FIGURE 12.6 Partitioning degrees of freedom (df) for the independent-measures ANOVA.
  9. Some instructors may want to begin the discussion of the computational procedures with this slide. Students sometimes get lost in all the formulas, but if they can see that the summary table is the “goal” of the process, they can break it down into the small steps required to fill in each part of the table.
  10. FIGURE 12.7 The distribution of F-ratios with df = 2, 12. Of all the values in the distribution, only 5% are larger than F = 3.88, and only 1% are larger than F = 6.93.
  11. FIGURE 12.8 The distribution of F-ratios with df = 3, 20. The critical values for α = .01 is 4.94.
  12. A visual representation of the between-treatments variability and the within0-treatments variability that form the numerator and denominator, respectively, of the F-ratio. In (a), the difference between treatments is relatively large and easy to see. In (b), the same 4-point difference between treatments is relatively small and is overwhelmed by the within-treatments variability.
  13. FIGURE 12.10 The distribution of t statistics with df = 18 and the corresponding distribution of F-ratios with df = 1, 18. Notice that the critical values for α = .05 are t = ±2.101 and F = 2.1012 = 4.41.
  14. FIGURE 12.10 Formulas for ANOVA.
  15. FIGURE 12.12 SPSS Output of the ANOVA for the studying strategy experiment in Example 12.1.