SlideShare a Scribd company logo
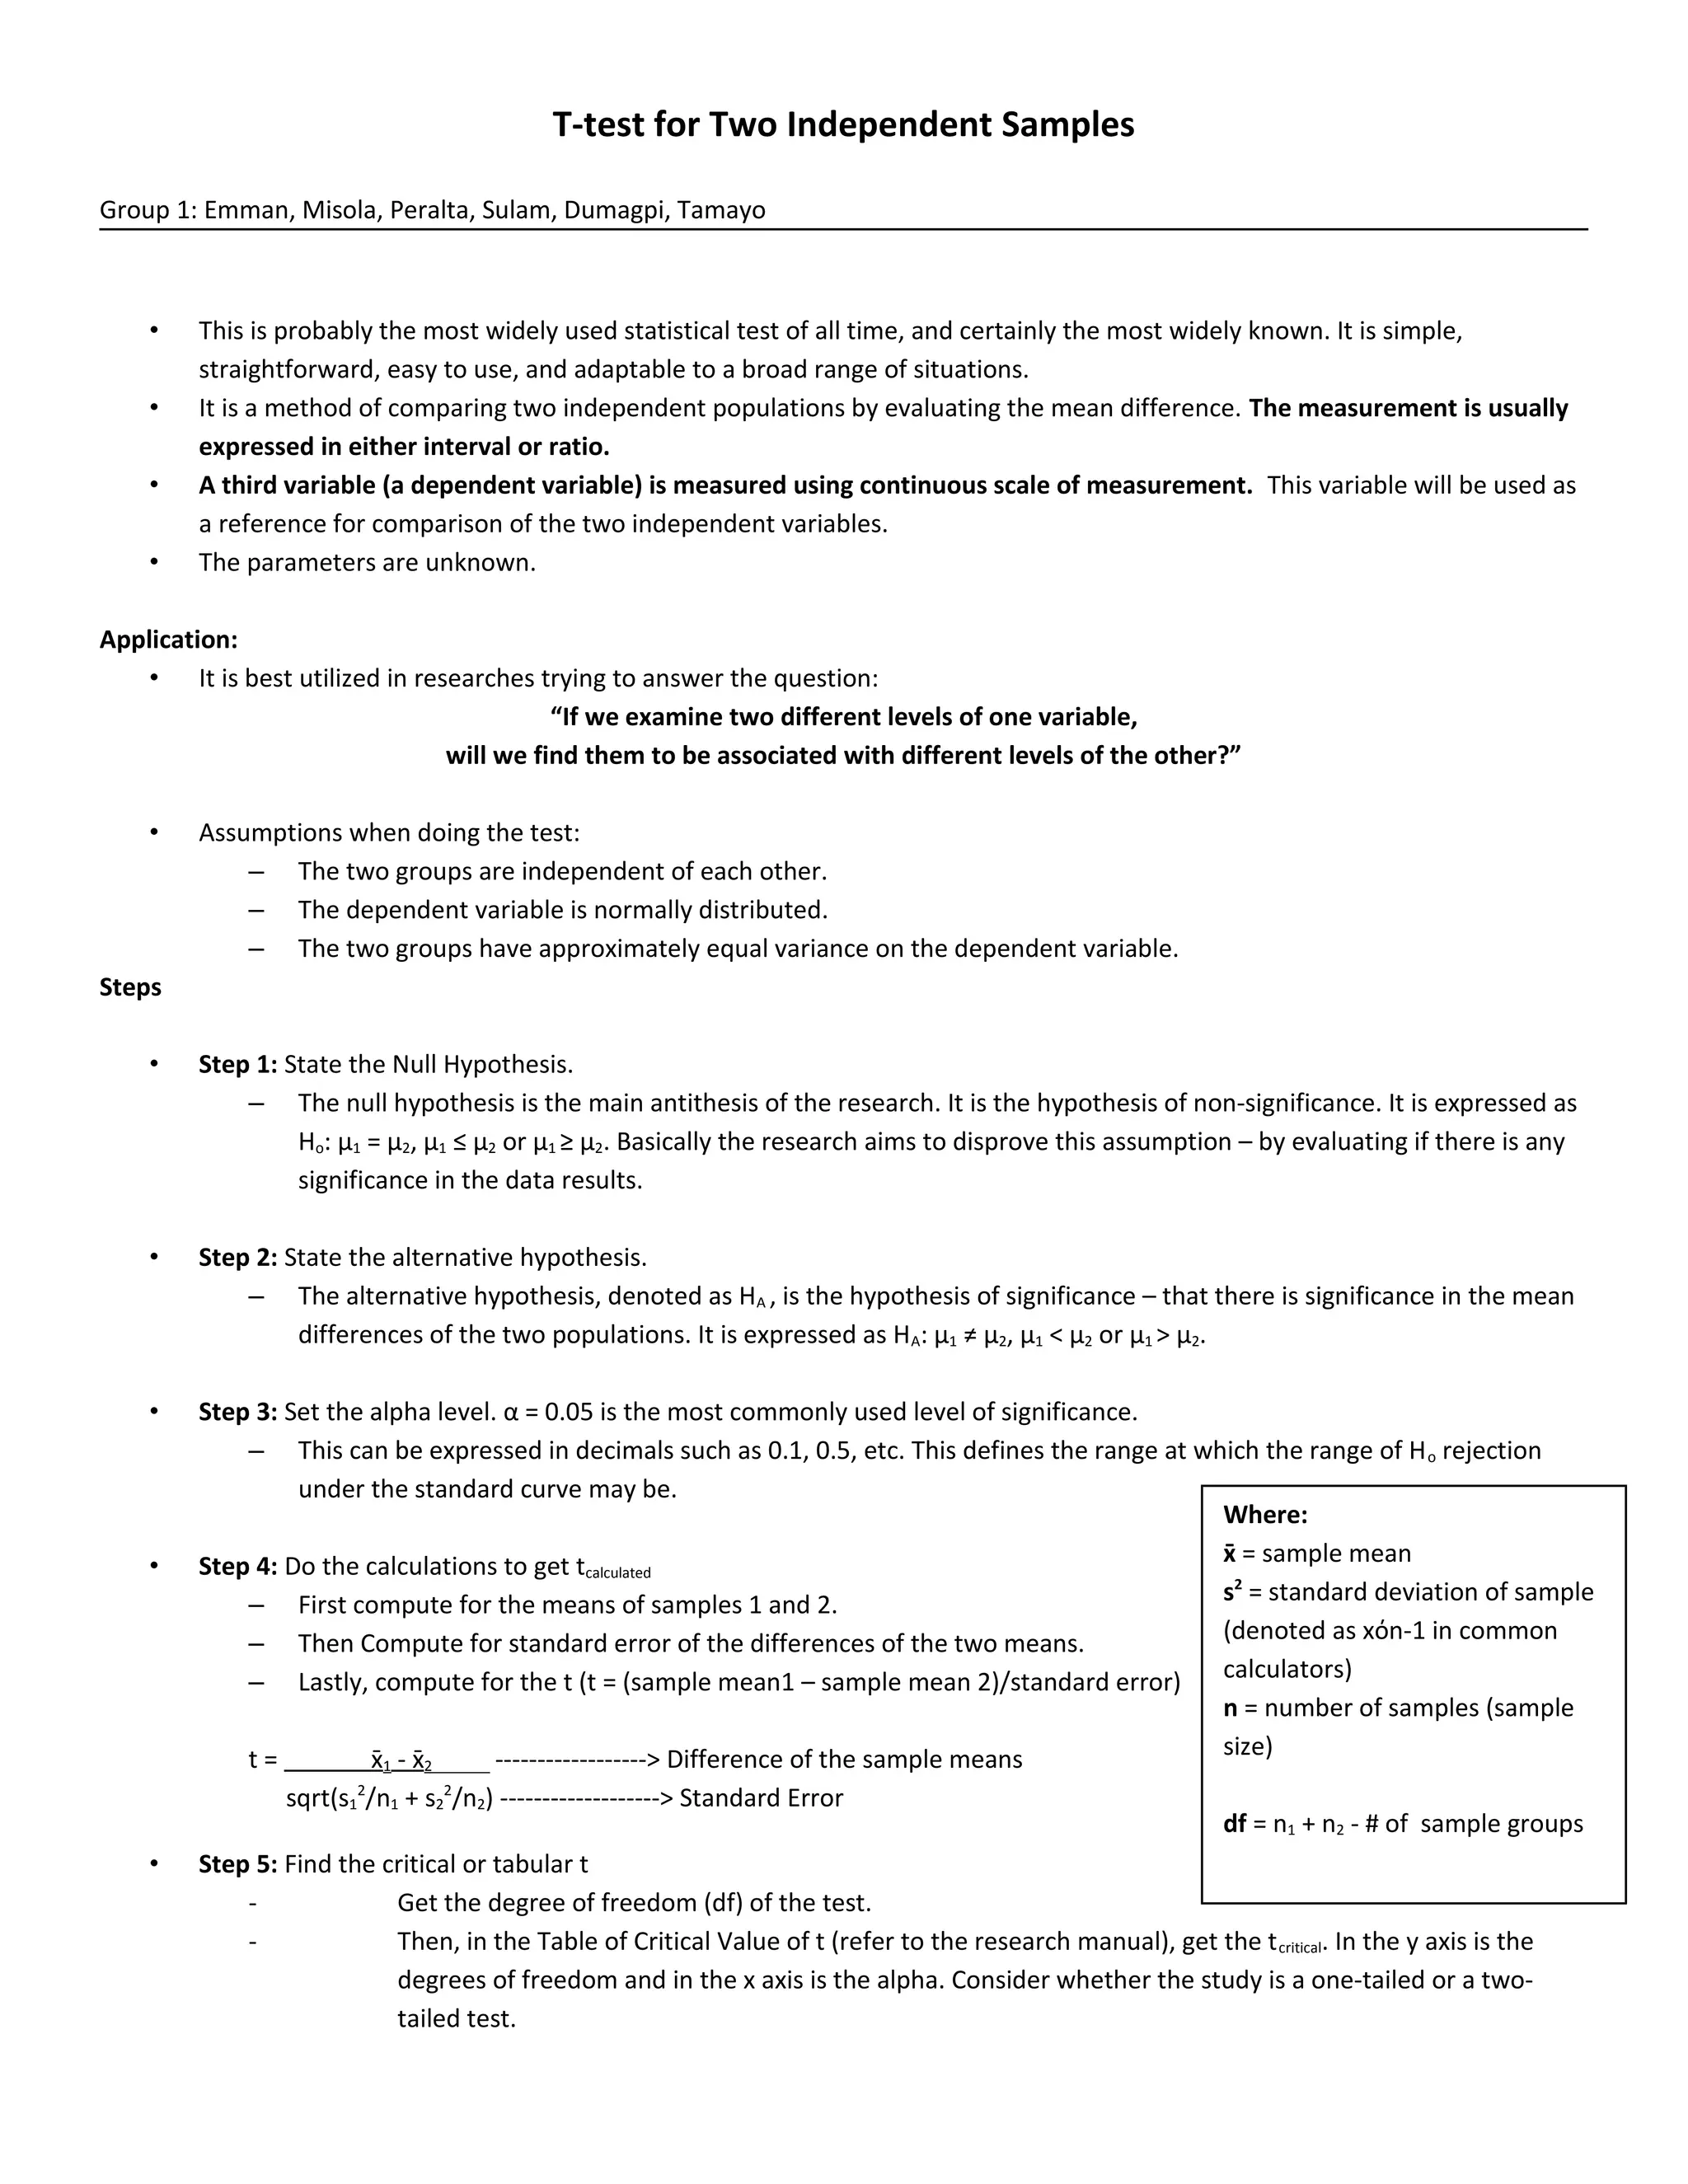
T-test for Two Independent Samples
Group 1: Emman, Misola, Peralta, Sulam, Dumagpi, Tamayo
• This is probably the most widely used statistical test of all time, and certainly the most widely known. It is simple,
straightforward, easy to use, and adaptable to a broad range of situations.
• It is a method of comparing two independent populations by evaluating the mean difference. The measurement is usually
expressed in either interval or ratio.
• A third variable (a dependent variable) is measured using continuous scale of measurement. This variable will be used as
a reference for comparison of the two independent variables.
• The parameters are unknown.
Application:
• It is best utilized in researches trying to answer the question:
“If we examine two different levels of one variable,
will we find them to be associated with different levels of the other?”
• Assumptions when doing the test:
– The two groups are independent of each other.
– The dependent variable is normally distributed.
– The two groups have approximately equal variance on the dependent variable.
Steps
• Step 1: State the Null Hypothesis.
– The null hypothesis is the main antithesis of the research. It is the hypothesis of non-significance. It is expressed as
Ho: µ1 = µ2, µ1 ≤ µ2 or µ1 ≥ µ2. Basically the research aims to disprove this assumption – by evaluating if there is any
significance in the data results.
• Step 2: State the alternative hypothesis.
– The alternative hypothesis, denoted as HA , is the hypothesis of significance – that there is significance in the mean
differences of the two populations. It is expressed as HA: µ1 ≠ µ2, µ1 < µ2 or µ1 > µ2.
• Step 3: Set the alpha level. α = 0.05 is the most commonly used level of significance.
– This can be expressed in decimals such as 0.1, 0.5, etc. This defines the range at which the range of Ho rejection
under the standard curve may be.
• Step 4: Do the calculations to get tcalculated
– First compute for the means of samples 1 and 2.
– Then Compute for standard error of the differences of the two means.
– Lastly, compute for the t (t = (sample mean1 – sample mean 2)/standard error)
t = x̄1 - x̄2 f------------------> Difference of the sample means
sqrt(s1
2
/n1 + s2
2
/n2) -------------------> Standard Error
• Step 5: Find the critical or tabular t
- Get the degree of freedom (df) of the test.
- Then, in the Table of Critical Value of t (refer to the research manual), get the tcritical. In the y axis is the
degrees of freedom and in the x axis is the alpha. Consider whether the study is a one-tailed or a two-
tailed test.
Where:
x̄ = sample mean
s2
= standard deviation of sample
(denoted as xόn-1 in common
calculators)
n = number of samples (sample
size)
df = n1 + n2 - # of sample groups
• Step 6: Decide whether the t value is within the range of Ho or not (CONCLUDE)
– For one tailed test, if the tcalculated is to the left of the tcritical (if µ1 < µ2) or to the
right of the tcritical (if µ1 > µ2), then the HA is correct. If not, then Ho is correct.
– For two tailed test, if the tcalculated is within the range of +tcritical, then Ho is
true. If not within the range, then the Ha is true.
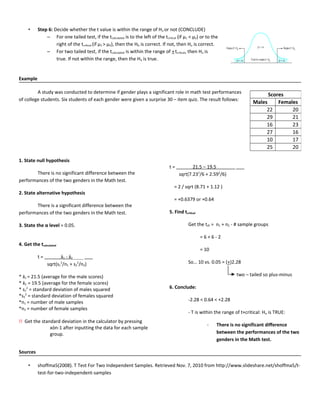
Example
A study was conducted to determine if gender plays a significant role in math test performances
of college students. Six students of each gender were given a surprise 30 – item quiz. The result follows:
1. State null hypothesis
There is no significant difference between the
performances of the two genders in the Math test.
2. State alternative hypothesis
There is a significant difference between the
performances of the two genders in the Math test.
3. State the α level = 0.05.
4. Get the tcalculated
t = x̄1 - x̄2 f
sqrt(s1
2
/n1 + s2
2
/n2)
* x̄1 = 21.5 (average for the male scores)
* x̄2 = 19.5 (average for the female scores)
* s1
2
= standard deviation of males squared
*s2
2
= standard deviation of females squared
*n1 = number of male samples
*n2 = number of female samples
!! Get the standard deviation in the calculator by pressing
xόn-1 after inputting the data for each sample
group.
t = 21.5 – 19.5 f
sqrt(7.232
/6 + 2.592
/6)
= 2 / sqrt (8.71 + 1.12 )
= +0.6379 or +0.64
5. Find tcritical
Get the tdf = n1 + n2 - # sample groups
= 6 + 6 - 2
= 10
So… 10 vs. 0.05 = (+)2.28
two – tailed so plus-minus
6. Conclude:
-2.28 < 0.64 < +2.28
- T is within the range of t+critical: Ho is TRUE:
- There is no significant difference
between the performances of the two
genders in the Math test.
Sources
• shoffma5(2008). T Test For Two Independent Samples. Retrieved Nov. 7, 2010 from http://www.slideshare.net/shoffma5/t-
test-for-two-independent-samples
Scores
Males Females
22 20
29 21
16 23
27 16
10 17
25 20
• Lowry R. (1999-2010). Chapter 11. t-Test for the Significance of the Difference between the Means of Two Independent
Samples. Retrieved Nov. 7, 2010 from http://faculty.vassar.edu/lowry/ch11pt1.html
• MacFarland T.W. (1998). Student's t-Test for Independent Samples. Retrieved Nov. 7, 2010 from
http://www.nyx.net/~tmacfarl/STAT_TUT/studen_t.ssi

More Related Content

What's hot

Introduction to the t test
Introduction to the t testIntroduction to the t test
Introduction to the t test
Sr Edith Bogue
 
T distribution
T distributionT distribution
T distribution
Stephan Jade Navarro
 
T distribution | Statistics
T distribution | StatisticsT distribution | Statistics
T distribution | Statistics
Transweb Global Inc
 
Chi square test ( x2 )
Chi square test ( x2  )Chi square test ( x2  )
Chi square test ( x2 )
yogesh ingle
 
Statistical methods
Statistical methods Statistical methods
Statistical methods
rcm business
 
The chi square_test
The chi square_testThe chi square_test
The chi square_test
Anandapadmanabhan Kottiyam
 
Chi Squared Test
Chi Squared TestChi Squared Test
Chi Squared Test
Darren Barton
 
Central tendency and Variation or Dispersion
Central tendency and Variation or DispersionCentral tendency and Variation or Dispersion
Central tendency and Variation or Dispersion
Johny Kutty Joseph
 
The chi square test of indep of categorical variables
The chi square test of indep of categorical variablesThe chi square test of indep of categorical variables
The chi square test of indep of categorical variables
Regent University
 
T test
T testT test
Analysis of Variance
Analysis of VarianceAnalysis of Variance
Analysis of Variance
Kaori Kubo Germano, PhD
 
T test
T testT test
Chi square test
Chi square testChi square test
Chi square test
Patel Parth
 
Test for independence
Test for independence Test for independence
Test for independence
Sofia Marie Escultura
 
T test statistics
T test statisticsT test statistics
T test statistics
Mohammad Ihmeidan
 
Measures of Central Tendency and Dispersion
Measures of Central Tendency and DispersionMeasures of Central Tendency and Dispersion
Measures of Central Tendency and Dispersion
Pharmacy Universe
 
T test statistic
T test statisticT test statistic
T test statistic
qamrunnisashaikh1997
 
Moments in statistics
Moments in statisticsMoments in statistics
Moments in statistics
515329748
 
The Chi Square Test
The Chi Square TestThe Chi Square Test
Aron chpt 9 ed t test independent samples
Aron chpt 9 ed t test independent samplesAron chpt 9 ed t test independent samples
Aron chpt 9 ed t test independent samples
Karen Price
 

What's hot (20)

Introduction to the t test
Introduction to the t testIntroduction to the t test
Introduction to the t test
 
T distribution
T distributionT distribution
T distribution
 
T distribution | Statistics
T distribution | StatisticsT distribution | Statistics
T distribution | Statistics
 
Chi square test ( x2 )
Chi square test ( x2  )Chi square test ( x2  )
Chi square test ( x2 )
 
Statistical methods
Statistical methods Statistical methods
Statistical methods
 
The chi square_test
The chi square_testThe chi square_test
The chi square_test
 
Chi Squared Test
Chi Squared TestChi Squared Test
Chi Squared Test
 
Central tendency and Variation or Dispersion
Central tendency and Variation or DispersionCentral tendency and Variation or Dispersion
Central tendency and Variation or Dispersion
 
The chi square test of indep of categorical variables
The chi square test of indep of categorical variablesThe chi square test of indep of categorical variables
The chi square test of indep of categorical variables
 
T test
T testT test
T test
 
Analysis of Variance
Analysis of VarianceAnalysis of Variance
Analysis of Variance
 
T test
T testT test
T test
 
Chi square test
Chi square testChi square test
Chi square test
 
Test for independence
Test for independence Test for independence
Test for independence
 
T test statistics
T test statisticsT test statistics
T test statistics
 
Measures of Central Tendency and Dispersion
Measures of Central Tendency and DispersionMeasures of Central Tendency and Dispersion
Measures of Central Tendency and Dispersion
 
T test statistic
T test statisticT test statistic
T test statistic
 
Moments in statistics
Moments in statisticsMoments in statistics
Moments in statistics
 
The Chi Square Test
The Chi Square TestThe Chi Square Test
The Chi Square Test
 
Aron chpt 9 ed t test independent samples
Aron chpt 9 ed t test independent samplesAron chpt 9 ed t test independent samples
Aron chpt 9 ed t test independent samples
 

Viewers also liked

Pax romana research
Pax romana researchPax romana research
Pax romana research
iamkim
 
1 july 2011 batch congress
1 july 2011 batch congress1 july 2011 batch congress
1 july 2011 batch congress
iamkim
 
Ss greek civilization2
Ss   greek civilization2Ss   greek civilization2
Ss greek civilization2
iamkim
 
Pisay 4 q sched
Pisay   4 q schedPisay   4 q sched
Pisay 4 q sched
iamkim
 
M4 combinatronics hw
M4   combinatronics hwM4   combinatronics hw
M4 combinatronics hw
iamkim
 
Cs project instructions
Cs   project instructionsCs   project instructions
Cs project instructions
iamkim
 
Cs project instructions
Cs   project instructionsCs   project instructions
Cs project instructions
iamkim
 
Ss industrial rev
Ss   industrial revSs   industrial rev
Ss industrial rev
iamkim
 
Hypothesis testing
Hypothesis testingHypothesis testing
Hypothesis testing
iamkim
 
Graduation pictorial schedule
Graduation pictorial scheduleGraduation pictorial schedule
Graduation pictorial schedule
iamkim
 
Math reviewer 2
Math reviewer 2Math reviewer 2
Math reviewer 2iamkim
 
Chi square hand out (1)
Chi square hand out (1)Chi square hand out (1)
Chi square hand out (1)
iamkim
 
Physics statics
Physics   staticsPhysics   statics
Physics statics
iamkim
 
14 january 2011 congress
14 january 2011 congress14 january 2011 congress
14 january 2011 congress
iamkim
 
Str statistics lec notes
Str   statistics lec notesStr   statistics lec notes
Str statistics lec notes
iamkim
 
Dost application
Dost applicationDost application
Dost application
iamkim
 
Yearbook grad pic orders
Yearbook   grad pic ordersYearbook   grad pic orders
Yearbook grad pic orders
iamkim
 
Fil panitikan
Fil   panitikanFil   panitikan
Fil panitikaniamkim
 
Str tlc
Str   tlcStr   tlc
Str tlc
iamkim
 
Upcat sched
Upcat   schedUpcat   sched
Upcat sched
iamkim
 

Viewers also liked (20)

Pax romana research
Pax romana researchPax romana research
Pax romana research
 
1 july 2011 batch congress
1 july 2011 batch congress1 july 2011 batch congress
1 july 2011 batch congress
 
Ss greek civilization2
Ss   greek civilization2Ss   greek civilization2
Ss greek civilization2
 
Pisay 4 q sched
Pisay   4 q schedPisay   4 q sched
Pisay 4 q sched
 
M4 combinatronics hw
M4   combinatronics hwM4   combinatronics hw
M4 combinatronics hw
 
Cs project instructions
Cs   project instructionsCs   project instructions
Cs project instructions
 
Cs project instructions
Cs   project instructionsCs   project instructions
Cs project instructions
 
Ss industrial rev
Ss   industrial revSs   industrial rev
Ss industrial rev
 
Hypothesis testing
Hypothesis testingHypothesis testing
Hypothesis testing
 
Graduation pictorial schedule
Graduation pictorial scheduleGraduation pictorial schedule
Graduation pictorial schedule
 
Math reviewer 2
Math reviewer 2Math reviewer 2
Math reviewer 2
 
Chi square hand out (1)
Chi square hand out (1)Chi square hand out (1)
Chi square hand out (1)
 
Physics statics
Physics   staticsPhysics   statics
Physics statics
 
14 january 2011 congress
14 january 2011 congress14 january 2011 congress
14 january 2011 congress
 
Str statistics lec notes
Str   statistics lec notesStr   statistics lec notes
Str statistics lec notes
 
Dost application
Dost applicationDost application
Dost application
 
Yearbook grad pic orders
Yearbook   grad pic ordersYearbook   grad pic orders
Yearbook grad pic orders
 
Fil panitikan
Fil   panitikanFil   panitikan
Fil panitikan
 
Str tlc
Str   tlcStr   tlc
Str tlc
 
Upcat sched
Upcat   schedUpcat   sched
Upcat sched
 

Similar to Str t-test1

Test of hypothesis (t)
Test of hypothesis (t)Test of hypothesis (t)
Test of hypothesis (t)
Marlon Gomez
 
Dr.Dinesh-BIOSTAT-Tests-of-significance-1-min.pdf
Dr.Dinesh-BIOSTAT-Tests-of-significance-1-min.pdfDr.Dinesh-BIOSTAT-Tests-of-significance-1-min.pdf
Dr.Dinesh-BIOSTAT-Tests-of-significance-1-min.pdf
HassanMohyUdDin2
 
Biostat.
Biostat.Biostat.
Biostat.
Sachin kumar
 
Talk 3
Talk 3Talk 3
Point Estimate, Confidence Interval, Hypotesis tests
Point Estimate, Confidence Interval, Hypotesis testsPoint Estimate, Confidence Interval, Hypotesis tests
Point Estimate, Confidence Interval, Hypotesis tests
University of Salerno
 
Test of hypothesis test of significance
Test of hypothesis test of significanceTest of hypothesis test of significance
Test of hypothesis test of significance
Dr. Jayesh Vyas
 
Analyzing experimental research data
Analyzing experimental research dataAnalyzing experimental research data
Analyzing experimental research data
Atula Ahuja
 
Two Means, Independent Samples
Two Means, Independent SamplesTwo Means, Independent Samples
Two Means, Independent Samples
Long Beach City College
 
Sampling distribution.pptx
Sampling distribution.pptxSampling distribution.pptx
Sampling distribution.pptx
ssusera0e0e9
 
Statistical analysis by iswar
Statistical analysis by iswarStatistical analysis by iswar
Descriptive Statistics Formula Sheet Sample Populatio.docx
Descriptive Statistics Formula Sheet    Sample Populatio.docxDescriptive Statistics Formula Sheet    Sample Populatio.docx
Descriptive Statistics Formula Sheet Sample Populatio.docx
simonithomas47935
 
Analysis of variance (ANOVA)
Analysis of variance (ANOVA)Analysis of variance (ANOVA)
Analysis of variance (ANOVA)
Sneh Kumari
 
Probability distribution Function & Decision Trees in machine learning
Probability distribution Function  & Decision Trees in machine learningProbability distribution Function  & Decision Trees in machine learning
Probability distribution Function & Decision Trees in machine learning
Sadia Zafar
 
Test of significance
Test of significanceTest of significance
Test of significance
Dr. Imran Zaheer
 
UNIT I -Data and Data Collection1.ppt
UNIT I -Data and Data Collection1.pptUNIT I -Data and Data Collection1.ppt
UNIT I -Data and Data Collection1.ppt
NAGESH108233
 
Data analysis
Data analysisData analysis
Data analysis
metalkid132
 
Chapter 11 Psrm
Chapter 11 PsrmChapter 11 Psrm
Chapter 11 Psrm
mandrewmartin
 
Business research methods 2
Business research methods 2Business research methods 2
Business research methods 2
Free Talk 2 Other
 
UNIT I -Data and Data Collection1.ppt
UNIT I -Data and Data Collection1.pptUNIT I -Data and Data Collection1.ppt
UNIT I -Data and Data Collection1.ppt
NAGESH108233
 
tps5e_Ch10_2.ppt
tps5e_Ch10_2.ppttps5e_Ch10_2.ppt
tps5e_Ch10_2.ppt
Dunakanshon
 

Similar to Str t-test1 (20)

Test of hypothesis (t)
Test of hypothesis (t)Test of hypothesis (t)
Test of hypothesis (t)
 
Dr.Dinesh-BIOSTAT-Tests-of-significance-1-min.pdf
Dr.Dinesh-BIOSTAT-Tests-of-significance-1-min.pdfDr.Dinesh-BIOSTAT-Tests-of-significance-1-min.pdf
Dr.Dinesh-BIOSTAT-Tests-of-significance-1-min.pdf
 
Biostat.
Biostat.Biostat.
Biostat.
 
Talk 3
Talk 3Talk 3
Talk 3
 
Point Estimate, Confidence Interval, Hypotesis tests
Point Estimate, Confidence Interval, Hypotesis testsPoint Estimate, Confidence Interval, Hypotesis tests
Point Estimate, Confidence Interval, Hypotesis tests
 
Test of hypothesis test of significance
Test of hypothesis test of significanceTest of hypothesis test of significance
Test of hypothesis test of significance
 
Analyzing experimental research data
Analyzing experimental research dataAnalyzing experimental research data
Analyzing experimental research data
 
Two Means, Independent Samples
Two Means, Independent SamplesTwo Means, Independent Samples
Two Means, Independent Samples
 
Sampling distribution.pptx
Sampling distribution.pptxSampling distribution.pptx
Sampling distribution.pptx
 
Statistical analysis by iswar
Statistical analysis by iswarStatistical analysis by iswar
Statistical analysis by iswar
 
Descriptive Statistics Formula Sheet Sample Populatio.docx
Descriptive Statistics Formula Sheet    Sample Populatio.docxDescriptive Statistics Formula Sheet    Sample Populatio.docx
Descriptive Statistics Formula Sheet Sample Populatio.docx
 
Analysis of variance (ANOVA)
Analysis of variance (ANOVA)Analysis of variance (ANOVA)
Analysis of variance (ANOVA)
 
Probability distribution Function & Decision Trees in machine learning
Probability distribution Function  & Decision Trees in machine learningProbability distribution Function  & Decision Trees in machine learning
Probability distribution Function & Decision Trees in machine learning
 
Test of significance
Test of significanceTest of significance
Test of significance
 
UNIT I -Data and Data Collection1.ppt
UNIT I -Data and Data Collection1.pptUNIT I -Data and Data Collection1.ppt
UNIT I -Data and Data Collection1.ppt
 
Data analysis
Data analysisData analysis
Data analysis
 
Chapter 11 Psrm
Chapter 11 PsrmChapter 11 Psrm
Chapter 11 Psrm
 
Business research methods 2
Business research methods 2Business research methods 2
Business research methods 2
 
UNIT I -Data and Data Collection1.ppt
UNIT I -Data and Data Collection1.pptUNIT I -Data and Data Collection1.ppt
UNIT I -Data and Data Collection1.ppt
 
tps5e_Ch10_2.ppt
tps5e_Ch10_2.ppttps5e_Ch10_2.ppt
tps5e_Ch10_2.ppt
 

More from iamkim

Nat sci minerals part1
Nat sci   minerals part1Nat sci   minerals part1
Nat sci minerals part1
iamkim
 
Nat Sci - Minerals
Nat Sci - MineralsNat Sci - Minerals
Nat Sci - Minerals
iamkim
 
Batch 2012 schedule of exit interview
Batch 2012 schedule of exit interviewBatch 2012 schedule of exit interview
Batch 2012 schedule of exit interview
iamkim
 
College test results b2012
College test results b2012College test results b2012
College test results b2012
iamkim
 
Chem cations
Chem   cationsChem   cations
Chem cations
iamkim
 
Chem anions
Chem   anionsChem   anions
Chem anions
iamkim
 
Grad ball collections per section(01 28-12)
Grad ball collections per section(01 28-12)Grad ball collections per section(01 28-12)
Grad ball collections per section(01 28-12)
iamkim
 
Congratulations to batch 2012 star scholar candidates
Congratulations to batch 2012 star scholar candidatesCongratulations to batch 2012 star scholar candidates
Congratulations to batch 2012 star scholar candidates
iamkim
 
Retreat consent form
Retreat consent formRetreat consent form
Retreat consent formiamkim
 
Retreat agreements
Retreat agreementsRetreat agreements
Retreat agreementsiamkim
 
Fil la loba negra
Fil   la loba negraFil   la loba negra
Fil la loba negraiamkim
 
Fil fray botod
Fil   fray botodFil   fray botod
Fil fray botodiamkim
 
Fil 3 q readings
Fil   3 q readingsFil   3 q readings
Fil 3 q readingsiamkim
 
Dasalan at tocsohan
Dasalan at tocsohanDasalan at tocsohan
Dasalan at tocsohaniamkim
 
Chem ps electrolysis
Chem   ps electrolysisChem   ps electrolysis
Chem ps electrolysis
iamkim
 
Physics waves
Physics   wavesPhysics   waves
Physics waves
iamkim
 
Math 3 hw ps2
Math   3 hw ps2Math   3 hw ps2
Math 3 hw ps2
iamkim
 
Memo circular # 4 dtd nov 4, 2011
Memo circular # 4 dtd nov 4, 2011Memo circular # 4 dtd nov 4, 2011
Memo circular # 4 dtd nov 4, 2011iamkim
 
Final creative shots hair & makeup evaluation (110211)
Final creative shots hair & makeup evaluation (110211)Final creative shots hair & makeup evaluation (110211)
Final creative shots hair & makeup evaluation (110211)iamkim
 
Creative shots hair & makeup evaluation (110211)
Creative shots hair & makeup evaluation (110211)Creative shots hair & makeup evaluation (110211)
Creative shots hair & makeup evaluation (110211)iamkim
 

More from iamkim (20)

Nat sci minerals part1
Nat sci   minerals part1Nat sci   minerals part1
Nat sci minerals part1
 
Nat Sci - Minerals
Nat Sci - MineralsNat Sci - Minerals
Nat Sci - Minerals
 
Batch 2012 schedule of exit interview
Batch 2012 schedule of exit interviewBatch 2012 schedule of exit interview
Batch 2012 schedule of exit interview
 
College test results b2012
College test results b2012College test results b2012
College test results b2012
 
Chem cations
Chem   cationsChem   cations
Chem cations
 
Chem anions
Chem   anionsChem   anions
Chem anions
 
Grad ball collections per section(01 28-12)
Grad ball collections per section(01 28-12)Grad ball collections per section(01 28-12)
Grad ball collections per section(01 28-12)
 
Congratulations to batch 2012 star scholar candidates
Congratulations to batch 2012 star scholar candidatesCongratulations to batch 2012 star scholar candidates
Congratulations to batch 2012 star scholar candidates
 
Retreat consent form
Retreat consent formRetreat consent form
Retreat consent form
 
Retreat agreements
Retreat agreementsRetreat agreements
Retreat agreements
 
Fil la loba negra
Fil   la loba negraFil   la loba negra
Fil la loba negra
 
Fil fray botod
Fil   fray botodFil   fray botod
Fil fray botod
 
Fil 3 q readings
Fil   3 q readingsFil   3 q readings
Fil 3 q readings
 
Dasalan at tocsohan
Dasalan at tocsohanDasalan at tocsohan
Dasalan at tocsohan
 
Chem ps electrolysis
Chem   ps electrolysisChem   ps electrolysis
Chem ps electrolysis
 
Physics waves
Physics   wavesPhysics   waves
Physics waves
 
Math 3 hw ps2
Math   3 hw ps2Math   3 hw ps2
Math 3 hw ps2
 
Memo circular # 4 dtd nov 4, 2011
Memo circular # 4 dtd nov 4, 2011Memo circular # 4 dtd nov 4, 2011
Memo circular # 4 dtd nov 4, 2011
 
Final creative shots hair & makeup evaluation (110211)
Final creative shots hair & makeup evaluation (110211)Final creative shots hair & makeup evaluation (110211)
Final creative shots hair & makeup evaluation (110211)
 
Creative shots hair & makeup evaluation (110211)
Creative shots hair & makeup evaluation (110211)Creative shots hair & makeup evaluation (110211)
Creative shots hair & makeup evaluation (110211)
 

Str t-test1

  • 1. T-test for Two Independent Samples Group 1: Emman, Misola, Peralta, Sulam, Dumagpi, Tamayo • This is probably the most widely used statistical test of all time, and certainly the most widely known. It is simple, straightforward, easy to use, and adaptable to a broad range of situations. • It is a method of comparing two independent populations by evaluating the mean difference. The measurement is usually expressed in either interval or ratio. • A third variable (a dependent variable) is measured using continuous scale of measurement. This variable will be used as a reference for comparison of the two independent variables. • The parameters are unknown. Application: • It is best utilized in researches trying to answer the question: “If we examine two different levels of one variable, will we find them to be associated with different levels of the other?” • Assumptions when doing the test: – The two groups are independent of each other. – The dependent variable is normally distributed. – The two groups have approximately equal variance on the dependent variable. Steps • Step 1: State the Null Hypothesis. – The null hypothesis is the main antithesis of the research. It is the hypothesis of non-significance. It is expressed as Ho: µ1 = µ2, µ1 ≤ µ2 or µ1 ≥ µ2. Basically the research aims to disprove this assumption – by evaluating if there is any significance in the data results. • Step 2: State the alternative hypothesis. – The alternative hypothesis, denoted as HA , is the hypothesis of significance – that there is significance in the mean differences of the two populations. It is expressed as HA: µ1 ≠ µ2, µ1 < µ2 or µ1 > µ2. • Step 3: Set the alpha level. α = 0.05 is the most commonly used level of significance. – This can be expressed in decimals such as 0.1, 0.5, etc. This defines the range at which the range of Ho rejection under the standard curve may be. • Step 4: Do the calculations to get tcalculated – First compute for the means of samples 1 and 2. – Then Compute for standard error of the differences of the two means. – Lastly, compute for the t (t = (sample mean1 – sample mean 2)/standard error) t = x̄1 - x̄2 f------------------> Difference of the sample means sqrt(s1 2 /n1 + s2 2 /n2) -------------------> Standard Error • Step 5: Find the critical or tabular t - Get the degree of freedom (df) of the test. - Then, in the Table of Critical Value of t (refer to the research manual), get the tcritical. In the y axis is the degrees of freedom and in the x axis is the alpha. Consider whether the study is a one-tailed or a two- tailed test. Where: x̄ = sample mean s2 = standard deviation of sample (denoted as xόn-1 in common calculators) n = number of samples (sample size) df = n1 + n2 - # of sample groups
  • 2. • Step 6: Decide whether the t value is within the range of Ho or not (CONCLUDE) – For one tailed test, if the tcalculated is to the left of the tcritical (if µ1 < µ2) or to the right of the tcritical (if µ1 > µ2), then the HA is correct. If not, then Ho is correct. – For two tailed test, if the tcalculated is within the range of +tcritical, then Ho is true. If not within the range, then the Ha is true. Example A study was conducted to determine if gender plays a significant role in math test performances of college students. Six students of each gender were given a surprise 30 – item quiz. The result follows: 1. State null hypothesis There is no significant difference between the performances of the two genders in the Math test. 2. State alternative hypothesis There is a significant difference between the performances of the two genders in the Math test. 3. State the α level = 0.05. 4. Get the tcalculated t = x̄1 - x̄2 f sqrt(s1 2 /n1 + s2 2 /n2) * x̄1 = 21.5 (average for the male scores) * x̄2 = 19.5 (average for the female scores) * s1 2 = standard deviation of males squared *s2 2 = standard deviation of females squared *n1 = number of male samples *n2 = number of female samples !! Get the standard deviation in the calculator by pressing xόn-1 after inputting the data for each sample group. t = 21.5 – 19.5 f sqrt(7.232 /6 + 2.592 /6) = 2 / sqrt (8.71 + 1.12 ) = +0.6379 or +0.64 5. Find tcritical Get the tdf = n1 + n2 - # sample groups = 6 + 6 - 2 = 10 So… 10 vs. 0.05 = (+)2.28 two – tailed so plus-minus 6. Conclude: -2.28 < 0.64 < +2.28 - T is within the range of t+critical: Ho is TRUE: - There is no significant difference between the performances of the two genders in the Math test. Sources • shoffma5(2008). T Test For Two Independent Samples. Retrieved Nov. 7, 2010 from http://www.slideshare.net/shoffma5/t- test-for-two-independent-samples Scores Males Females 22 20 29 21 16 23 27 16 10 17 25 20
  • 3. • Lowry R. (1999-2010). Chapter 11. t-Test for the Significance of the Difference between the Means of Two Independent Samples. Retrieved Nov. 7, 2010 from http://faculty.vassar.edu/lowry/ch11pt1.html • MacFarland T.W. (1998). Student's t-Test for Independent Samples. Retrieved Nov. 7, 2010 from http://www.nyx.net/~tmacfarl/STAT_TUT/studen_t.ssi