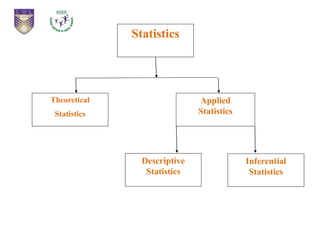
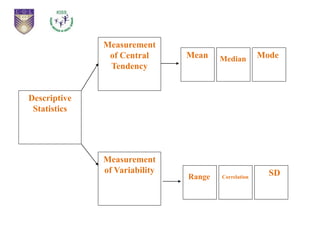
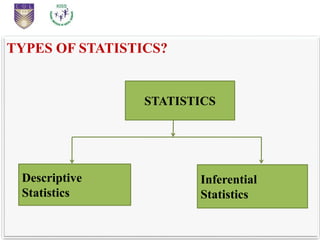
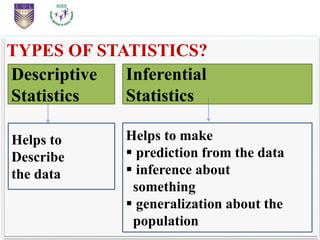
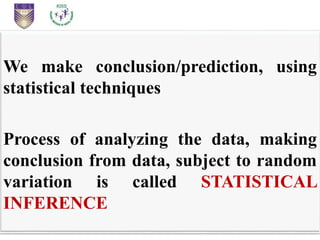
Welcome to Week 1, Topic 1.
INTRODUCTION TO
STATISTICAL INFERENCE.
WHAT IS STATISTICS?
A discipline that deals with
-collection of data
- analysis of data
- presentation of data
PURPOSE OF STATISTICS?
The sole purpose is to make an
accurate conclusion / prediction
/inference about the population
from the sample.
Theoretical
Statistics
Applied
Statistics
Descriptive
Statistics
Inferential
Statistics
Statistics
Descriptive
Statistics
Measurement
of Central
Tendency
Measurement
of Variability
Mean Median Mode
Range Correlation
SD
TYPES OF STATISTICS?
Descriptive
Statistics
Inferential
Statistics
STATISTICS
TYPES OF STATISTICS?
Descriptive
Statistics
Inferential
Statistics
Helps to
Describe
the data
Helps to make
 prediction from the data
 inference about
something
 generalization about the
population
We make conclusion/prediction, using
statistical techniques
Process of analyzing the data, making
conclusion from data, subject to random
variation is called STATISTICAL
INFERENCE
We always deal with DATA.
DATA, that constitute the SAMPLE not
the POPULATION
For any study, it is impossible to consider
all items in a population. Its impractical
and unnecessary as well.
Therefore, a study is always conducted on
SAMPLE, that rightly represent the
population. We call it representative sample.
Therefore, it is, very important to
have a clear understanding of the
two terms
SAMPLE
POPULATION
FOR EXAMPLE
Lets find the average age of
students enrolled in ODL system
in India
There are TWO ways to proceed
Either with CENSUS inquiry
OR
with SAMPLE inquiry
CENSUS INQUIRY SAMPLE INQUIRY
We study the population/ whole
universe which comprises of all
students enrolled in all open
universities, Directorate of
Distance Education and other
institutions offering ODL
programmes in India.
We study few cases (i.e. sample)
selected from the population /
universe to get the age of the
members of sample and then take
the average.
We have to get the age of each
student and then take the average
From this average, we can find
some ideas to predict/infer, the
average age of the population.
Census inquiry in most of the cases
is impossible and impracticable
also. Actually, it is, unnecessary as
well.
Sample inquiry is always preferred,
as it is practicable in terms of time,
labor and economy as well
Therefore, in research study always contented
with SAMPLE and SAMPLING METHOD to
get the measures of the SAMPLE
From the measures of the SAMPE, we predict
and draw inferences about the measure of the
population
This is what is called STATISTICAL
INFERENCE
Measures of the SAMPLE
STATISTICS
Measures of the POPULATION
PARAMETRE
Statistics are derived from the SAMPE.
From the STATISTICS (measure of the sample)
we draw conclusion / inferences/Predict about
PARAMETRE (measure of the population)
The whole process is called STATISTICAL
INFERENCE. It involves INDUCTIVE
RESONING and based on PROBABILITY
THEORY
Drawing conclusion about the measures of the
population based on the measures of the sample,
drawn from the population is called
ESTIMATION OF PARAMETRE
STATISTICAL INFERENCE is a means of
generalization from a SAMPLE
Statistical inference is a process of drawing
conclusion/inference or making predictions
about the population parameter based on the
sample statistics
Statistical Inference is based on the concept
of SAMPLING DISTRIBUTION
To understand the concept of SAMPLING
DISTRIBUTION
Let us consider a POPULATION of size ‘N’
We need to draw a sample size of ‘n’ from the
population size ‘N’ such that
‘n’ would be the representative of the whole ‘N’
We can have a series of sample of size ‘n’ (i.e.
n1, n2, n3,) depending upon the sampling
process.
The series of sample (each of sample size n) so
obtained (i.e. n1, n2, n3,) is called SAMLING
DISTRIBUTION.
Each sample has size ‘n’ and are
derived from ‘N’
Now, let us find the measures of each sample.
Let the measure be the MEAN
We can get a series of MEAN (one mean from
each sample) such as m1, m2, m3,…..
The distribution of mean so obtained is called
SAMPLING DISTRIBUTION OF MEANS
Now, if we calculate the Standard Deviation of
these MEANS (measures of mean obtained from
the series of sample),
it is called STANDARD ERROR OF MEAN
Similarly, we can find
i) Sampling distribution of Medians &
STANDARD ERROR OF MEDIAN
ii) Sampling distribution of Mode &
STANDARD ERROR OF Mode
iii) Sampling distribution of SD &
STANDARD ERROR OF SD
Features of Sampling Distribution of any
STATISTICS
 Sampling Distribution is closely approximates
to NORMAL DISTRIBUTION, if
i) sample size is large
ii) there are large no. of samples
Standard Deviation of these distribution is
Standard Error of that Statistics
 By using the properties of NORMAL
DISTRIBUTION, we can make statistical
inference
IMPORTANT POINTS
 Be in touch with Forum Questions,
respond to Post(s) of MOOC TEAM
positively
 Also, respond to Forum posts of your
co-learners
 Make sure to create at least one new
post(s)of your own in in week.
 Discuss and interact with your co-
learners in Forum Posts and also in
Hangout.
 Don’t miss the live sessions
 Do solve all the problems i) check
your progress and ii) Reflection
Questions
 Make sure to watch all the videos
posted in the course home page
 Make sure to download e-text and go
through it in each week
 I am available online everyday
between 3:00PM to 5:00PM . Feel free
to interact in Forum Posts & hangout
 SPARE at least 30 Mins everyday in
the platform Wish you all the best

Ppt for 1.1 introduction to statistical inference

  • 1.
    Welcome to Week1, Topic 1. INTRODUCTION TO STATISTICAL INFERENCE.
  • 2.
    WHAT IS STATISTICS? Adiscipline that deals with -collection of data - analysis of data - presentation of data
  • 3.
    PURPOSE OF STATISTICS? Thesole purpose is to make an accurate conclusion / prediction /inference about the population from the sample.
  • 4.
  • 5.
  • 6.
  • 7.
    TYPES OF STATISTICS? Descriptive Statistics Inferential Statistics Helpsto Describe the data Helps to make  prediction from the data  inference about something  generalization about the population
  • 8.
    We make conclusion/prediction,using statistical techniques Process of analyzing the data, making conclusion from data, subject to random variation is called STATISTICAL INFERENCE
  • 9.
    We always dealwith DATA. DATA, that constitute the SAMPLE not the POPULATION For any study, it is impossible to consider all items in a population. Its impractical and unnecessary as well.
  • 10.
    Therefore, a studyis always conducted on SAMPLE, that rightly represent the population. We call it representative sample.
  • 11.
    Therefore, it is,very important to have a clear understanding of the two terms SAMPLE POPULATION
  • 12.
    FOR EXAMPLE Lets findthe average age of students enrolled in ODL system in India
  • 13.
    There are TWOways to proceed Either with CENSUS inquiry OR with SAMPLE inquiry
  • 14.
    CENSUS INQUIRY SAMPLEINQUIRY We study the population/ whole universe which comprises of all students enrolled in all open universities, Directorate of Distance Education and other institutions offering ODL programmes in India. We study few cases (i.e. sample) selected from the population / universe to get the age of the members of sample and then take the average. We have to get the age of each student and then take the average From this average, we can find some ideas to predict/infer, the average age of the population. Census inquiry in most of the cases is impossible and impracticable also. Actually, it is, unnecessary as well. Sample inquiry is always preferred, as it is practicable in terms of time, labor and economy as well
  • 15.
    Therefore, in researchstudy always contented with SAMPLE and SAMPLING METHOD to get the measures of the SAMPLE From the measures of the SAMPE, we predict and draw inferences about the measure of the population This is what is called STATISTICAL INFERENCE
  • 16.
    Measures of theSAMPLE STATISTICS Measures of the POPULATION PARAMETRE
  • 17.
    Statistics are derivedfrom the SAMPE. From the STATISTICS (measure of the sample) we draw conclusion / inferences/Predict about PARAMETRE (measure of the population) The whole process is called STATISTICAL INFERENCE. It involves INDUCTIVE RESONING and based on PROBABILITY THEORY
  • 18.
    Drawing conclusion aboutthe measures of the population based on the measures of the sample, drawn from the population is called ESTIMATION OF PARAMETRE STATISTICAL INFERENCE is a means of generalization from a SAMPLE
  • 19.
    Statistical inference isa process of drawing conclusion/inference or making predictions about the population parameter based on the sample statistics Statistical Inference is based on the concept of SAMPLING DISTRIBUTION
  • 20.
    To understand theconcept of SAMPLING DISTRIBUTION Let us consider a POPULATION of size ‘N’ We need to draw a sample size of ‘n’ from the population size ‘N’ such that ‘n’ would be the representative of the whole ‘N’
  • 21.
    We can havea series of sample of size ‘n’ (i.e. n1, n2, n3,) depending upon the sampling process. The series of sample (each of sample size n) so obtained (i.e. n1, n2, n3,) is called SAMLING DISTRIBUTION. Each sample has size ‘n’ and are derived from ‘N’
  • 22.
    Now, let usfind the measures of each sample. Let the measure be the MEAN We can get a series of MEAN (one mean from each sample) such as m1, m2, m3,….. The distribution of mean so obtained is called SAMPLING DISTRIBUTION OF MEANS
  • 23.
    Now, if wecalculate the Standard Deviation of these MEANS (measures of mean obtained from the series of sample), it is called STANDARD ERROR OF MEAN
  • 24.
    Similarly, we canfind i) Sampling distribution of Medians & STANDARD ERROR OF MEDIAN ii) Sampling distribution of Mode & STANDARD ERROR OF Mode iii) Sampling distribution of SD & STANDARD ERROR OF SD
  • 25.
    Features of SamplingDistribution of any STATISTICS  Sampling Distribution is closely approximates to NORMAL DISTRIBUTION, if i) sample size is large ii) there are large no. of samples
  • 26.
    Standard Deviation ofthese distribution is Standard Error of that Statistics  By using the properties of NORMAL DISTRIBUTION, we can make statistical inference
  • 27.
    IMPORTANT POINTS  Bein touch with Forum Questions, respond to Post(s) of MOOC TEAM positively  Also, respond to Forum posts of your co-learners  Make sure to create at least one new post(s)of your own in in week.
  • 28.
     Discuss andinteract with your co- learners in Forum Posts and also in Hangout.  Don’t miss the live sessions  Do solve all the problems i) check your progress and ii) Reflection Questions
  • 29.
     Make sureto watch all the videos posted in the course home page  Make sure to download e-text and go through it in each week  I am available online everyday between 3:00PM to 5:00PM . Feel free to interact in Forum Posts & hangout  SPARE at least 30 Mins everyday in the platform Wish you all the best