Download as PDF, PPTX
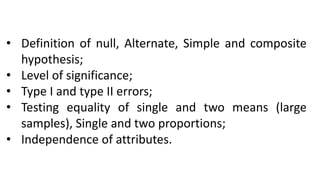
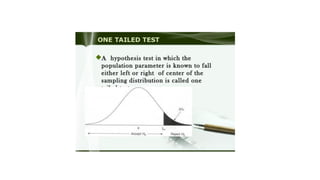
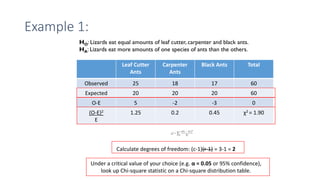
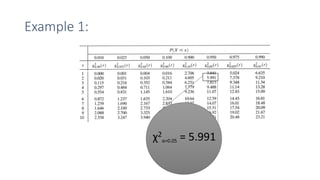
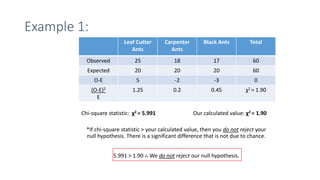

This document provides an overview of inferential statistics, detailing concepts such as null and alternative hypotheses, types of errors, and hypothesis testing for means and proportions. It explains key statistical tests and their applications, including one-tailed tests, t-tests for small samples, and the chi-square test for assessing differences between observed and expected values. The document includes examples and calculations for clarity on these statistical methods.


![Hypotheses Testing stat [Autosaved].pptx](https://cdn.slidesharecdn.com/ss_thumbnails/hypothesestestingautosaved-241015205108-f0373f24-thumbnail.jpg?width=640&height=640&fit=bounds)


