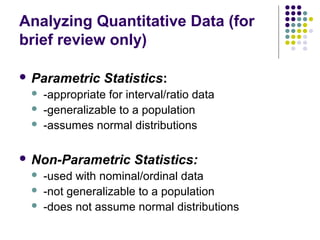
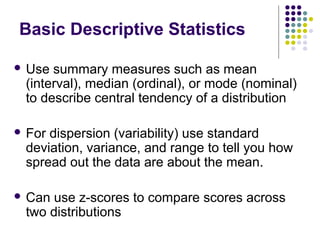
This document provides an overview of various quantitative data analysis techniques including parametric and non-parametric statistics, descriptive statistics, contingency analysis, t-tests, ANOVA, correlation, and regression. It discusses assumptions and processes for each technique and how to interpret results. Computer software like SPSS and SAS can be used to analyze large, complex datasets.
Analysis of data is a process of inspecting, cleaning, transforming, and modeling data with the goal of discovering useful information, suggesting conclusions, and supporting decision-making.
Part of a course I run introducing quantitative methods. One of the slideshows on my site www.kevinmorrell.org.uk please reference the site if you use any of it - hope it is useful.
In any single written message, one can count letters, words or sentences. One can categories phrases, describe the logical structure of expressions, ascertain associations, connotations, denotations, elocutionary forces, and one can also offer psychiatric, sociological, or political interpretations. All of these may be simultaneously valid. In short a message may convey a multitude of contents even to a single receiver.
Statistics is an important tool in pharmacological research that is used to summarize (descriptive statistics) experimental data in terms of central tendency (mean or median) and variance (standard deviation, standard error of the mean, confidence interval or range)
To get a copy of the slides for free Email me at: japhethmuthama@gmail.com
You can also support my PhD studies by donating a 1 dollar to my PayPal.
PayPal ID is japhethmuthama@gmail.com
this activity is designed for you to explore the continuum of an a.docxhowardh5
this activity is designed for you to explore the continuum of an addictive behavior of your choice.
Addictive behavior appears in stages. The earliest stage is non-use, which finally leads up to out-of-control dependence. The stages in between are important to identify, as it is much easier to correct an early-stage issue as opposed to a late-stage problem.
After reviewing the module readings and tasks, use the module notes as a reference and alcohol or substance abuse addiction as an example to identify the various levels of addiction.
You may choose to develop a time line identifying the stages or develop a written essay (no more than 500 words in Word format) to describe the escalation of addictive behaviors.
You are to include at least two references from academic sources that you have researched on this topic in the Excelsior College Library and use appropriate citations in American Psychological Association (APA) style.
You cannot just do a Google search for the topic! Academic sources are required. You may use Google Scholar or other libraries.
Chapter 13
Qualitative Data Analysis
1
Process of Qualitative Data Analysis
Preparing the Qualitative Data
Transform the data into readable text
Check for and resolve transcription errors
Manage the data
Organize by attribute coding
Two Separate Processes
5
Coding: Involves labeling and breaking down the data to find:
Patterns
Themes
Interpretation: Giving meaning to the identified patterns and themes
Coding
Starts with identifying the unit of analysis
Coding categories may reflect realms of meaning or different activities.
Coding categories can be theoretically-based or inductively created emerging from the data.
Use of Analytical Memos
7
Analytical memos help researchers w/ process of breaking down the data
Personal reflections on the research experience, methodological issues, or patterns in the data
Comes in 3 varieties:
Code notes
Operational notes
Theoretical notes
Data Displays
Taxonomy: system of ordered classification
Data matrix: individuals or other units represent columns and coding categories represent rows
Typologies: representation of findings based on the interrelationship between two or more ideas, concepts, or variables
Flow charts: diagrams that display processes
Taxonomy of Survival Strategies
Data Matrix: Homeless Individuals by Dimensions
Drawing and Evaluating Conclusions
Conclusions may result in:
Rich descriptions
Identification of themes
Inferences about patterns and concepts
Theoretical propositions
Evaluation of the data can occur by:
Comparing notes among observers
Using multiple sources of data
Examining exceptions to the data patterns
Member checking
Variations in Qualitative Data Analysis: Grounded Theory
Objective is to develop theory from data
Emphasizes people’s actions and voices as the main sources of d.
How to Split Bills in the Odoo 17 POS ModuleCeline George
Bills have a main role in point of sale procedure. It will help to track sales, handling payments and giving receipts to customers. Bill splitting also has an important role in POS. For example, If some friends come together for dinner and if they want to divide the bill then it is possible by POS bill splitting. This slide will show how to split bills in odoo 17 POS.
Instructions for Submissions thorugh G- Classroom.pptxJheel Barad
This presentation provides a briefing on how to upload submissions and documents in Google Classroom. It was prepared as part of an orientation for new Sainik School in-service teacher trainees. As a training officer, my goal is to ensure that you are comfortable and proficient with this essential tool for managing assignments and fostering student engagement.
This is a presentation by Dada Robert in a Your Skill Boost masterclass organised by the Excellence Foundation for South Sudan (EFSS) on Saturday, the 25th and Sunday, the 26th of May 2024.
He discussed the concept of quality improvement, emphasizing its applicability to various aspects of life, including personal, project, and program improvements. He defined quality as doing the right thing at the right time in the right way to achieve the best possible results and discussed the concept of the "gap" between what we know and what we do, and how this gap represents the areas we need to improve. He explained the scientific approach to quality improvement, which involves systematic performance analysis, testing and learning, and implementing change ideas. He also highlighted the importance of client focus and a team approach to quality improvement.
Model Attribute Check Company Auto PropertyCeline George
In Odoo, the multi-company feature allows you to manage multiple companies within a single Odoo database instance. Each company can have its own configurations while still sharing common resources such as products, customers, and suppliers.
Read| The latest issue of The Challenger is here! We are thrilled to announce that our school paper has qualified for the NATIONAL SCHOOLS PRESS CONFERENCE (NSPC) 2024. Thank you for your unwavering support and trust. Dive into the stories that made us stand out!
The Roman Empire A Historical Colossus.pdfkaushalkr1407
The Roman Empire, a vast and enduring power, stands as one of history's most remarkable civilizations, leaving an indelible imprint on the world. It emerged from the Roman Republic, transitioning into an imperial powerhouse under the leadership of Augustus Caesar in 27 BCE. This transformation marked the beginning of an era defined by unprecedented territorial expansion, architectural marvels, and profound cultural influence.
The empire's roots lie in the city of Rome, founded, according to legend, by Romulus in 753 BCE. Over centuries, Rome evolved from a small settlement to a formidable republic, characterized by a complex political system with elected officials and checks on power. However, internal strife, class conflicts, and military ambitions paved the way for the end of the Republic. Julius Caesar’s dictatorship and subsequent assassination in 44 BCE created a power vacuum, leading to a civil war. Octavian, later Augustus, emerged victorious, heralding the Roman Empire’s birth.
Under Augustus, the empire experienced the Pax Romana, a 200-year period of relative peace and stability. Augustus reformed the military, established efficient administrative systems, and initiated grand construction projects. The empire's borders expanded, encompassing territories from Britain to Egypt and from Spain to the Euphrates. Roman legions, renowned for their discipline and engineering prowess, secured and maintained these vast territories, building roads, fortifications, and cities that facilitated control and integration.
The Roman Empire’s society was hierarchical, with a rigid class system. At the top were the patricians, wealthy elites who held significant political power. Below them were the plebeians, free citizens with limited political influence, and the vast numbers of slaves who formed the backbone of the economy. The family unit was central, governed by the paterfamilias, the male head who held absolute authority.
Culturally, the Romans were eclectic, absorbing and adapting elements from the civilizations they encountered, particularly the Greeks. Roman art, literature, and philosophy reflected this synthesis, creating a rich cultural tapestry. Latin, the Roman language, became the lingua franca of the Western world, influencing numerous modern languages.
Roman architecture and engineering achievements were monumental. They perfected the arch, vault, and dome, constructing enduring structures like the Colosseum, Pantheon, and aqueducts. These engineering marvels not only showcased Roman ingenuity but also served practical purposes, from public entertainment to water supply.
Welcome to TechSoup New Member Orientation and Q&A (May 2024).pdfTechSoup
In this webinar you will learn how your organization can access TechSoup's wide variety of product discount and donation programs. From hardware to software, we'll give you a tour of the tools available to help your nonprofit with productivity, collaboration, financial management, donor tracking, security, and more.
2. Analyzing Quantitative Data (for
brief review only)
Parametric Statistics:
-appropriate for interval/ratio data
-generalizable to a population
-assumes normal distributions
Non-Parametric Statistics:
-used with nominal/ordinal data
-not generalizable to a population
-does not assume normal distributions
3. Tables and Graphs
Frequency tables with percentages give a
numerical description of the cases on a
variable.
Graphs like bar or pie graphs are used to
display nominal or ordinal data
Histograms and line graphs (frequency
polygons) can display interval/ratio level data.
Bivariate relationships can be displayed
using contingency tables (nominal or ordinal)
Relationships at the interval/ratio level are
displayed using a scatterplot.
4. Basic Descriptive Statistics
Use summary measures such as mean
(interval), median (ordinal), or mode (nominal)
to describe central tendency of a distribution
For dispersion (variability) use standard
deviation, variance, and range to tell you how
spread out the data are about the mean.
Can use z-scores to compare scores across
two distributions
5. Contingency (Cross-Tabs) Analysis
and Related Statistics
- for non-parametric (non-normal
distributions) statistics
Assumptions
Nominal or ordinal (categorical) data
Any type of distribution
The hypothesis test: The null hypothesis:
the two (or more) samples come from the
same distribution
6. Contingency (cont.)
Conducting the Analysis:
a. calculate percentages within the categories of
the IV and compare across the categories of the DV.
Are there differences in the outcomes?
b. for nominal
Chi-square statistic: is the relationship (the above
differences) real?
Phi, Cramer's V, etc.: how strong is the relationship?
c. for ordinal
t-test for gamma: is the relationship (the above differences)
real?
Gamma: how strong and what direction?
7. T-Tests (parametric) for Means and
Proportions
The t-test is used to determine whether
sample(s) have different means. Essentially, the
t-test is the ratio between the sample mean
difference and the standard error of that
difference. The t-test makes some important
assumptions:
Interval/Ratio level data
one or two levels of one or two variables
normal distributions
equal variances (relatively).
8. T-tests (cont.)
a. The one sample t-test:
tests a sample mean against a known population
mean
b. The independent samples t-test:
tests whether the mean of one sample is different
from the mean of another sample.
c. The paired group t-test (dependent or
related samples)
tests if two groups within the overall sample are
different on the same dependent variable.
9. ANOVA (parametric)
Analysis of Variance, or ANOVA, is testing the
difference in the means among 3 or more
different samples.
One-way ANOVA Assumptions:
One independent variable -- categorical with
two+ levels
Dependent variable -- interval or ratio
ANOVA is testing the ratio (F) of the mean
squares between groups and within groups.
Depending on the degrees of freedom, the F
score will show if there is a difference in the
means among all of the groups.
10. ANOVA (cont.)
One-way ANOVA will provide you with an F-ratio
and its corresponding p-value.
If there is a large enough difference between the
between groups mean squares and the within
groups mean squares, then the null hypothesis will
be rejected, indicating that there is a difference in
the mean scores among the groups.
However, the F-ratio does not tell you where those
differences are, only that one group mean is
significantly different from the others.
11. Correlation (parametric)
Used to test the presence, strength and direction
of a linear relationship among variables.
Correlation is a numerical expression that signifies
the relationship between two variables. Correlation
allows you to explore this relationship by
'measuring the association' between the variables.
Correlation is a 'measure of association' because
the correlation coefficient provides the degree of
the relationship between the variables. Correlation
does not infer causality! Typically, you need at
least interval and ratio data. However, you can run
correlation with ordinal level data with 5 or more
categories.
12. Correlation (cont.)
The Correlation Coefficient : Pearson's r, the
correlation coefficient, is the numeric value of the
relationship between variables. The correlation
coefficient is a percentage and can vary between
-1 and +1. If no relationship exists, then the
correlation coefficient would equal 0. Pearson's r
provides an (1) estimate of the strength of the
relationship and (2) an estimate of the direction of
the relationship.
If the correlation coefficient lies between -1 and 0,
it is a negative (inverse) relationship, 0 and +1, it is
a positive relationship and is 0, there is no
relationship The closer the coefficient lies to -1 or
+1, the stronger the relationship.
13. Correlation (cont.)
Coefficient of determination: provides the
percentage of the variance accounted for both
variables (x & y). To calculate the determination
coefficient, you square the r value. In other
words, if you had an r of 90, your coefficient of
determination would account for just 81 percent
of the variance between the variables.
14. Regression
Regression is used to model, calculate, and predict the
pattern of a linear relationship among two or more
variables.
There are two types of regression -- simple & multiple
a. Assumptions
Note: Variables should be approximately normally
distributed. If not, recode and use non-parametric
measures.
Dependent Variable: at least interval (can use ordinal if using
summated scale)
Independent Variable: should be interval. Independent
variables should be independent of each other, not related in
any way. You can use nominal if it is binary or 'dummy'
variable (0,1)
15. Regression (cont.)
b. Tests
Overall: The null tests that the regression (estimated)
line no better predicting dependent variable than the
mean line
Coefficients (slope "b", etc.): That the estimated
coefficient equals 0
c. Statistics
Overall: R-squared, F-test
Coefficient: t tests
d. Limitations
Only addresses linear patterns
Variables should be normally distributed
16. Using Computer Software to
Analyze Quantitative Data
Special statistical software is available to
analyze large quantities of data and to do
more complex analyses
The most common computer software used
in sociology are SPSS and SAS
SPSS is available at both the King’s and
Brescia computer labs and as well in various
computer labs on main campus.