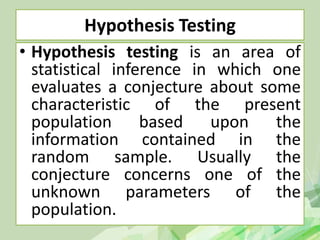
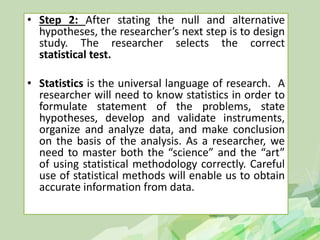
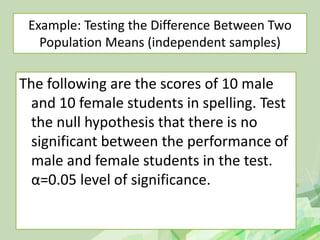
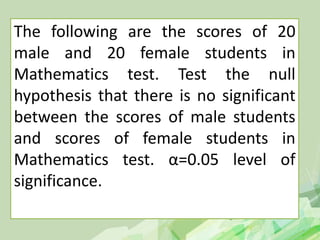
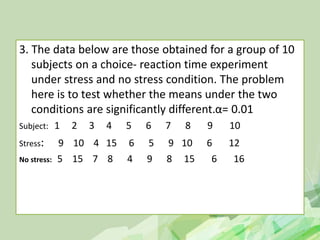
Here are the steps to solve this hypothesis testing problem:
1. State the null and alternative hypotheses:
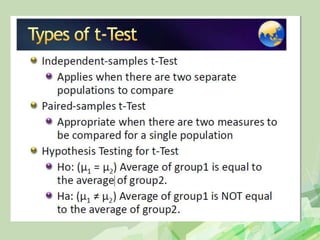
H0: There is no significant difference between the means under stress and no stress conditions.
H1: There is a significant difference between the means under stress and no stress conditions.
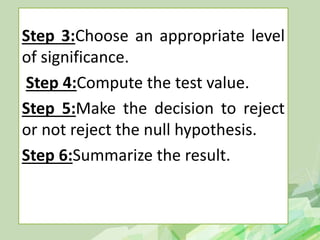
2. Choose the level of significance: Given as α = 0.01
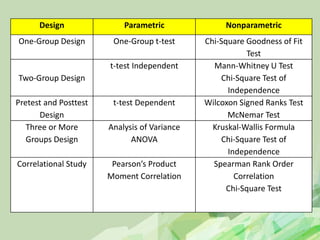
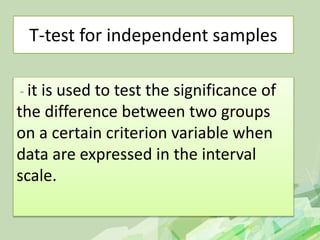
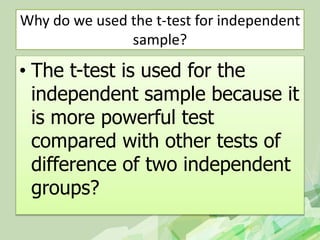
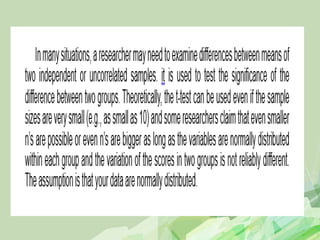
3. Select the appropriate statistical test: Since this involves comparing the means of two independent groups, use a two-sample t-test.
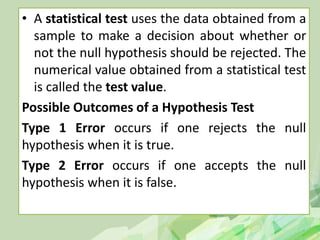
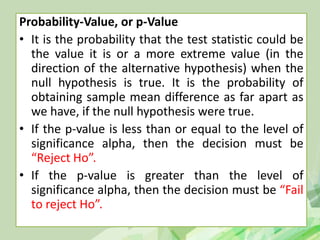
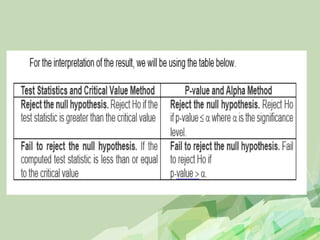
4. Compute the test statistic and p-value: Follow the t-test formula and calculation.
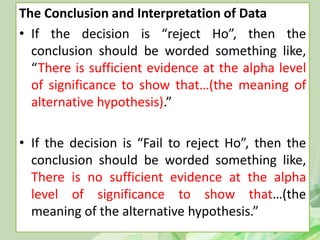
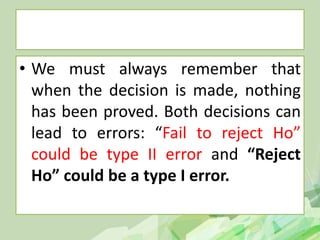
5. Make a decision: Reject H0 if p-value < α, fail to reject H0 if
This document provides an overview of a presentation on statistical hypothesis testing using the t-test. It discusses what a t-test is, how to perform a t-test, and provides an example of a t-test comparing spelling test scores of two groups that received different teaching strategies. The document outlines the six steps for conducting statistical hypothesis testing using a t-test: 1) stating the hypotheses, 2) choosing the significance level, 3) determining the critical values, 4) calculating the test statistic, 5) comparing the test statistic to the critical values, and 6) writing a conclusion.
Hypothesis Testing Definitions A statistical hypothesi.docxwilcockiris
Hypothesis Testing
Definitions:
A statistical hypothesis is a guess about a population parameter. The guess may or not be
true.
The null hypothesis, written H0, is a statistical hypothesis that states that there is no
difference between a parameter and a specific value, or that there is no difference between
two parameters.
The alternative hypothesis, written H1 or HA, is a statistical hypothesis that specifies a
specific difference between a parameter and a specific value, or that there is a difference
between two parameters.
Example 1:
A medical researcher is interested in finding out whether a new medication will have
undesirable side effects. She is particularly concerned with the pulse rate of patients who
take the medication. The research question is, will the pulse rate increase, decrease, or
remain the same after a patient takes the medication?
Since the researcher knows that the mean pulse rate for the population under study is 82
beats per minute, the hypotheses for this study are:
H0: µ = 82
HA: µ ≠ 82
The null hypothesis specifies that the mean will remain unchanged and the alternative
hypothesis states that it will be different. This test is called a two-tailed test since the
possible side effects could be to raise or lower the pulse rate. Notice that this is a non
directional hypothesis. The rejection region lies in both tails. We divide the alpha in two
and place half in each tail.
Example 2:
An entrepreneur invents an additive to increase the life of an automobile battery. If the
mean lifetime of the automobile battery is 36 months, then his hypotheses are:
H0: µ ≤ 36
HA: µ > 36
Here, the entrepreneur is only interested in increasing the lifetime of the batteries, so his
alternative hypothesis is that the mean is greater than 36 months. The null hypothesis is
that the mean is less than or equal to 36 months. This test is one-tailed since the interest
is only in an increased lifetime. Notice that the direction of the inequality in the alternate
hypothesis points to the right, same as the area of the curve that forms the rejection
region.
Example 3:
A landlord who wants to lower heating bills in a large apartment complex is considering
using a new type of insulation. If the current average of the monthly heating bills is $78,
his hypotheses about heating costs with the new insulation are:
H0: µ ≥ 78
HA: µ < 78
This test is also a one-tailed test since the landlord is interested only in lowering heating
costs. Notice that the direction of the inequality in the alternate hypothesis points to the
left, same as the area of the curve that forms the rejection region.
Study Design:
After stating the hypotheses, the researcher’s next step is to design the study. In designing
the study, the researcher selects an appropriate statistical test, chooses a level of
significance, and formulates a plan for conducting the study..
tests of significance in periodontics aspect, tests of significance with common examples, tests in brief, null hypothesis, parametric vs non parametric tests, seminar by sai lakshmi
Methods of Statistical Analysis & Interpretation of Data..pptxheencomm
The document discusses various statistical analysis techniques for making sense of numerical data, including descriptive statistics like measures of central tendency and dispersion to describe basic features of data, and inferential statistics to make predictions about a larger population based on a sample. Common inferential techniques covered are correlation, regression analysis, analysis of variance, and hypothesis testing to compare data against assumptions. The goal of these statistical methods is to derive meaningful insights from research data.
Testing of Hypothesis and Goodness of Fit
This document discusses hypothesis testing and goodness of fit. It defines hypothesis testing as a procedure to determine if sample data agrees with a hypothesized population characteristic. The key steps are stating the null and alternative hypotheses, selecting a significance level, determining the test distribution, defining rejection regions, performing the statistical test, and drawing a conclusion. Common hypothesis tests discussed include the Student's t-test and chi-square test of goodness of fit.
This document provides an overview of various statistical tests used for hypothesis testing, including parametric and non-parametric tests. It defines key terms like population, sample, mean, median, mode, and standard deviation. It explains the stages of hypothesis testing including creating the null and alternative hypotheses, determining the significance level, and deciding which statistical test to use based on the type of data and number of samples. Specific tests covered include the z-test, t-test, ANOVA, chi-square test, Wilcoxon signed-rank test, Mann-Whitney U test, Kruskal-Wallis test, and Friedman test.
This document provides an overview of quantitative data analysis methods for medical education research. It discusses summary measures, hypothesis testing, statistical methodologies, sample size determination, and additional resources for statistical support. Key points covered include choosing appropriate statistical tests based on study design, translating research questions into testable hypotheses, interpreting p-values and making conclusions, and factors that influence required sample size such as effect size and variability.
When to use, What Statistical Test for data Analysis modified.pptxAsokan R
This document discusses choosing the appropriate statistical test for data analysis. It begins by defining key terminology like independent and dependent variables. It then discusses the different types of variables, including quantitative, categorical, and their subtypes. Hypothesis testing and its key steps are explained. The document outlines assumptions that statistical tests make and categorizes common parametric and non-parametric tests. It provides guidance on choosing a test based on the research question, data structure, variable type, and whether the data meets necessary assumptions. Specific statistical tests are matched to questions about differences between groups, association between variables, and agreement between assessment techniques.
Hypothesis testing and estimation are used to reach conclusions about a population by examining a sample of that population.
Hypothesis testing is widely used in medicine, dentistry, health care, biology and other fields as a means to draw conclusions about the nature of populations
The document provides an overview of hypothesis testing, including the key elements such as the null and alternative hypotheses, significance level, test statistic, critical region, and conclusion. It defines a hypothesis as a claim about a population parameter that may or may not be true. The two main types of hypotheses - the null hypothesis (H0) and alternative hypothesis (Ha) - are described. The five steps of hypothesis testing are outlined as 1) stating the hypotheses, 2) selecting the significance level, 3) computing the test statistic, 4) determining the critical region, and 5) making a conclusion. An example of testing the mean activated partial thromboplastin time for deep vein thrombosis patients is provided to demonstrate applying the steps.
SAMPLE SIZE CALCULATION IN DIFFERENT STUDY DESIGNS AT.pptxssuserd509321
The document discusses factors that affect sample size calculation in different study designs. It provides examples of calculating sample sizes for descriptive cross-sectional studies, case-control studies, cohort studies, comparative studies, and randomized controlled trials. The key factors discussed are the level of confidence, power, expected proportions or means in groups, margin of error, and standard deviation. Sample size is affected by the type of study design, variables being qualitative or quantitative, and the goal of establishing equivalence, superiority or non-inferiority between groups. Electronic resources are provided for calculating sample sizes.
1. An independent samples t-test was conducted to determine if there were differences in anxiety scores between male and female participants before a major competition.
2. The results of the t-test showed no significant difference between the mean anxiety scores of males (M=17, SD=4.58) and females (M=18, SD=3.16), t(8)=0.41, p>0.05.
3. Therefore, the null hypothesis that there is no difference between male and female anxiety scores before a major competition was not rejected.
This document provides an overview of clinical trials and their various phases. It discusses how clinical trials are used to test potential interventions in humans to determine if they should be adopted for general use. The different phases of clinical trials are described, including phase I-IV. Key aspects of clinical trial design such as randomization, blinding, and placebos are explained. Hypothesis testing and its role in statistical analysis is also summarized.
Basics of Hypothesis testing for PharmacyParag Shah
This presentation will clarify all basic concepts and terms of hypothesis testing. It will also help you to decide correct Parametric & Non-Parametric test for your data
This document provides an overview of basic statistical concepts and techniques for analyzing data that are important for oncologists to understand. It covers topics such as types of data, measures of central tendency and variability, theoretical distributions, sampling, hypothesis testing, and basic techniques for analyzing categorical and numerical data, including t-tests, ANOVA, chi-square tests, correlation, and regression. The goal is to equip oncologists with fundamental statistical knowledge for handling, describing, and making inferences from medical data.
Introduction to Quantitative Research MethodsIman Ardekani
This document provides an introduction to quantitative research methods. It discusses key concepts like research methodology, variables, hypotheses, experimental design, and statistical analysis. Specifically, it covers:
- The difference between research methodology and methods, and examples of methodology scopes.
- Key terms like variables, hypotheses, and types of errors in hypothesis testing.
- How to plan, conduct, and analyze experiments, including best-guess experiments and one-factor-at-a-time experiments.
- Basic statistical concepts like mean, variance, normal distribution, and the t-distribution.
- Types of experimental designs like factorial experiments and comparative experiments.
Sofia conducted a survey of her friends' daily social media usage to see if it differed from the global average of 142 minutes reported in another survey. She formulated two claims: Claim A stated her friends' usage was the same as the global average, while Claim B stated it was higher. Hypothesis testing would be needed to statistically analyze the data from Sofia's survey to determine if her friends' usage supported Claim A or Claim B. Hypothesis testing involves defining a null hypothesis (Ho) stating no difference and an alternative hypothesis (Ha) stating a difference.
The document discusses the t-test, including:
1. It was introduced in 1908 by William Gosset under the pseudonym "Student" to test hypotheses about population means using small samples with unknown standard deviations.
2. The t-test has assumptions such as normality and equal variances that must be met.
3. There are different types of t-tests for different study designs: single sample t-test, independent samples t-test, and paired t-test.
4. Examples are provided to demonstrate how to calculate and interpret t-tests.
This document discusses non-parametric tests, which are statistical tests that make fewer assumptions about the population distribution compared to parametric tests. Some key points:
1) Non-parametric tests like the chi-square test, sign test, Wilcoxon signed-rank test, Mann-Whitney U-test, and Kruskal-Wallis test are used when the population is not normally distributed or sample sizes are small.
2) They are applied in situations where data is on an ordinal scale rather than a continuous scale, the population is not well defined, or the distribution is unknown.
3) Advantages are that they are easier to compute and make fewer assumptions than parametric tests,
Research method ch07 statistical methods 1naranbatn
This document provides an overview of statistical methods used in health research. It discusses descriptive statistics such as mean, median and mode that are used to describe data. It also covers inferential statistics that are used to infer characteristics of populations based on samples. Specific statistical tests covered include t-tests, which are used to test differences between means, and F-tests, which are used to compare variances. The document explains key concepts in hypothesis testing such as null and alternative hypotheses, type I and type II errors, and statistical power. Parametric tests covered assume the data meet certain statistical assumptions like normality.
Assignment 2 Tests of SignificanceThroughout this assignment yo.docxrock73
Assignment 2: Tests of Significance
Throughout this assignment you will review mock studies. You will needs to follow the directions outlined in the section using SPSS and decide whether there is significance between the variables. You will need to list the five steps of hypothesis testing (as covered in the lesson for Week 6) to see how every question should be formatted. You will complete all of the problems. Be sure to cut and past the appropriate test result boxes from SPSS under each problem and explain what you will do with your research hypotheses. All calculations should be coming from your SPSS. You will need to submit the SPSS output file to get credit for this assignment. This file will save as a .spv file and will need to be in a single file. In other words, you are not allowed to submit more than one output file for this assignment.
The five steps of hypothesis testing when using SPSS are as follows:
1. State your research hypothesis (H1) and null hypothesis (H0).
2. Identify your confidence interval (.05 or .01)
3. Conduct your analysis using SPSS.
4. Look for the valid score for comparison. This score is usually under ‘Sig 2-tail’ or ‘Sig. 2’. We will call this “p”.
5. Compare the two and apply the following rule:
a. If “p” is < or = confidence interval, than you reject the null.
Be sure to explain to the reader what this means in regards to your study. (Ex: will you recommend counseling services?)
* Be sure that your answers are clearly distinguishable. Perhaps you bold your font or use a different color.
ASSIGNMENT 2(200) WORD MINIUM
1. They allow us to see if our relationship is "statistically significant". (Remember that this only shows us that there is or is not a relationship but does NOT show us if it is big, small, or in-between.)
2. It let's us know if our findings can be generalized to the population which our sample was selected from and represents.
This week you will decide which test of significance you will use for your project. For this class your choices for tests will include one of the following:
· Chi-square
· t Test
· ANOVA
We will be using a process for hypothesis testing which outlines five steps researchers can follow to complete this process:
1. Write your research hypothesis (H1) and your null hypothesis (H0).
2. Identify and record your confidence interval. These are usually .05 (95%) or .01 (99%).
3. Complete the test using SPSS.
4. Identify the number under Sig. (2-tail). This will be represented by "p".
5. Compare the numbers in steps 2 and 4 and apply the following rule:
1. If p < or = confidence interval, than you reject the null hypothesis
Determine what to do with your null and explain this to your reader. Be sure to go beyond the phrase "reject or fail to reject the null" and explain how that impacts your research and best describes the relationship between variables.
TEST QUESTIONS-NEED FULL ANSWERS
Q1
Make up and discuss research examples corresponding to the various ...
Parametric and non-parametric tests differ in their assumptions about the population from which data is drawn. Parametric tests assume the population is normally distributed and variables are measured on an interval scale, while non-parametric tests make fewer assumptions. Examples of parametric tests include t-tests and ANOVA, while non-parametric examples include chi-square, Mann-Whitney U, and Wilcoxon signed-rank. Parametric tests are more powerful but rely on stronger assumptions, while non-parametric tests are more flexible but less powerful. Researchers must consider the characteristics of their data and questions being asked to determine the appropriate test.
This document summarizes quantitative data analysis techniques for summarizing data from samples and generalizing to populations. It discusses variables, simple and effect statistics, statistical models, and precision of estimates. Key points covered include describing data distribution through plots and statistics, common effect statistics for different variable types and models, ensuring model fit, and interpreting precision, significance, and probability to generalize from samples.
Hypothesis tests are used to statistically determine the probability that a hypothesis is accepted at a given significance level. The purpose is to determine if there is enough statistical evidence to support a hypothesis. A hypothesis predicts the relationship between variables and can be tested, whereas a research question does not make a prediction. Good hypotheses are compatible with current knowledge, logically consistent, clearly stated, and testable. The null hypothesis asserts there is no difference or relationship, while the alternative or research hypothesis predicts a difference or relationship. Setting a significance level helps determine if results reject the null hypothesis.
Similar to Statistical-Tests-and-Hypothesis-Testing.pptx (20)
How to Build a Module in Odoo 17 Using the Scaffold MethodCeline George
Odoo provides an option for creating a module by using a single line command. By using this command the user can make a whole structure of a module. It is very easy for a beginner to make a module. There is no need to make each file manually. This slide will show how to create a module using the scaffold method.
Strategies for Effective Upskilling is a presentation by Chinwendu Peace in a Your Skill Boost Masterclass organisation by the Excellence Foundation for South Sudan on 08th and 09th June 2024 from 1 PM to 3 PM on each day.
How to Add Chatter in the odoo 17 ERP ModuleCeline George
In Odoo, the chatter is like a chat tool that helps you work together on records. You can leave notes and track things, making it easier to talk with your team and partners. Inside chatter, all communication history, activity, and changes will be displayed.
How to Make a Field Mandatory in Odoo 17Celine George
In Odoo, making a field required can be done through both Python code and XML views. When you set the required attribute to True in Python code, it makes the field required across all views where it's used. Conversely, when you set the required attribute in XML views, it makes the field required only in the context of that particular view.
it describes the bony anatomy including the femoral head , acetabulum, labrum . also discusses the capsule , ligaments . muscle that act on the hip joint and the range of motion are outlined. factors affecting hip joint stability and weight transmission through the joint are summarized.
How to Fix the Import Error in the Odoo 17Celine George
An import error occurs when a program fails to import a module or library, disrupting its execution. In languages like Python, this issue arises when the specified module cannot be found or accessed, hindering the program's functionality. Resolving import errors is crucial for maintaining smooth software operation and uninterrupted development processes.
A review of the growth of the Israel Genealogy Research Association Database Collection for the last 12 months. Our collection is now passed the 3 million mark and still growing. See which archives have contributed the most. See the different types of records we have, and which years have had records added. You can also see what we have for the future.
The simplified electron and muon model, Oscillating Spacetime: The Foundation...RitikBhardwaj56
Discover the Simplified Electron and Muon Model: A New Wave-Based Approach to Understanding Particles delves into a groundbreaking theory that presents electrons and muons as rotating soliton waves within oscillating spacetime. Geared towards students, researchers, and science buffs, this book breaks down complex ideas into simple explanations. It covers topics such as electron waves, temporal dynamics, and the implications of this model on particle physics. With clear illustrations and easy-to-follow explanations, readers will gain a new outlook on the universe's fundamental nature.
ISO/IEC 27001, ISO/IEC 42001, and GDPR: Best Practices for Implementation and...PECB
Denis is a dynamic and results-driven Chief Information Officer (CIO) with a distinguished career spanning information systems analysis and technical project management. With a proven track record of spearheading the design and delivery of cutting-edge Information Management solutions, he has consistently elevated business operations, streamlined reporting functions, and maximized process efficiency.
Certified as an ISO/IEC 27001: Information Security Management Systems (ISMS) Lead Implementer, Data Protection Officer, and Cyber Risks Analyst, Denis brings a heightened focus on data security, privacy, and cyber resilience to every endeavor.
His expertise extends across a diverse spectrum of reporting, database, and web development applications, underpinned by an exceptional grasp of data storage and virtualization technologies. His proficiency in application testing, database administration, and data cleansing ensures seamless execution of complex projects.
What sets Denis apart is his comprehensive understanding of Business and Systems Analysis technologies, honed through involvement in all phases of the Software Development Lifecycle (SDLC). From meticulous requirements gathering to precise analysis, innovative design, rigorous development, thorough testing, and successful implementation, he has consistently delivered exceptional results.
Throughout his career, he has taken on multifaceted roles, from leading technical project management teams to owning solutions that drive operational excellence. His conscientious and proactive approach is unwavering, whether he is working independently or collaboratively within a team. His ability to connect with colleagues on a personal level underscores his commitment to fostering a harmonious and productive workplace environment.
Date: May 29, 2024
Tags: Information Security, ISO/IEC 27001, ISO/IEC 42001, Artificial Intelligence, GDPR
-------------------------------------------------------------------------------
Find out more about ISO training and certification services
Training: ISO/IEC 27001 Information Security Management System - EN | PECB
ISO/IEC 42001 Artificial Intelligence Management System - EN | PECB
General Data Protection Regulation (GDPR) - Training Courses - EN | PECB
Webinars: https://pecb.com/webinars
Article: https://pecb.com/article
-------------------------------------------------------------------------------
For more information about PECB:
Website: https://pecb.com/
LinkedIn: https://www.linkedin.com/company/pecb/
Facebook: https://www.facebook.com/PECBInternational/
Slideshare: http://www.slideshare.net/PECBCERTIFICATION
Exploiting Artificial Intelligence for Empowering Researchers and Faculty, In...Dr. Vinod Kumar Kanvaria
Exploiting Artificial Intelligence for Empowering Researchers and Faculty,
International FDP on Fundamentals of Research in Social Sciences
at Integral University, Lucknow, 06.06.2024
By Dr. Vinod Kumar Kanvaria
Film vocab for eal 3 students: Australia the movie
Statistical-Tests-and-Hypothesis-Testing.pptx
1. Hypothesis Testing
• Hypothesis testing is an area of
statistical inference in which one
evaluates a conjecture about some
characteristic of the present
population based upon the
information contained in the
random sample. Usually the
conjecture concerns one of the
unknown parameters of the
population.
2. Hypothesis Testing
• A hypothesis is a claim or
statement about the population
parameter. Usual parameters are
population mean or proportion.
In hypothesis testing, parameters
must be identified before
analysis.
3. Example of Hypothesis:
• The mean scholastic rating of
students admitted in URS is not
less than 80%.
• The proportion of registered
voters in Antipolo City favoring a
candidate A exceeds 0.60.
4. • Researchers must always keep in
mind that they analyze a sample
data in an attempt to distinguish
between results easily occur and
results that are highly unlikely.
Occurrence of highly unlikely
results can only be explained by
either that a rare event has
indeed occurred or that things
are not as they are assumed to
be.
5. To perform hypothesis testing,
the following steps are usually
followed:
Step 1:Formulate a null and
alternative hypothesis. Every
hypothesis-testing situation
begins with the statement of a
hypothesis.
6. • A statistical hypothesis is a conjecture about
a population parameter. This conjecture may
or may not be true. The null hypothesis,
symbolized by Ho, is a statistical hypothesis
that states that there is no difference
between a parameter and a specific value or
that there is no difference between two
parameters. The alternative hypothesis,
symbolized by H1, is a statistical hypothesis
that states a specific difference between a
parameter and a specific value or that there
is difference between two parameters.
7. Example: A researcher is interested in
finding out whether a new medication
will have any undesirable side effects.
The researcher is particularly
concerned with the pulse rate of the
patients who take the medication. Will
the pulse rate increase, decrease, or
remain unchanged after a patient
takes the medication? Suppose that
the mean rate for the population
under study is 82 beats per minute.
8. H0: There is no significant difference between
the pulse rate of patients exposed to a new
medication and the 82 beats per minute mean
rate for the population under study.
H1: There is a significant difference between
the pulse rate of patients exposed to a new
medication and the 82 beats per minute mean
rate for the population under study.
Critical Value: 82 beats per minute
9. • State the null and alternative for each of
the following problems
A psychologist feels that playing soft music
during a test will change results of the test.
The psychologist is not sure whether the
grades will be higher or lower. In past, the
mean of the scores was 73.
Ho:________________________________
H1: ________________________________
10. A chemist invents an additive to increase the life of an
automobile battery. If the mean lifetime of the
automobile battery is 36 months, then what would be
his hypotheses?
• H0: There is no significant difference between the
average life of an automobile battery with an
additive and the mean life of a regular battery
which is 36 months.
• H1: There is a significant difference between the
average life of an automobile battery with an
additive and the mean life of a regular battery
which is 36 months.
• Critical Value: 36 months
11. Is there a significant difference between
the performance of grade 9 learners
before and after exposure to the
developed Learning Materials in
Physics?
• Ho:____________________________
• H1:____________________________
12. • Step 2: After stating the null and alternative
hypotheses, the researcher’s next step is to design
study. The researcher selects the correct
statistical test.
• Statistics is the universal language of research. A
researcher will need to know statistics in order to
formulate statement of the problems, state
hypotheses, develop and validate instruments,
organize and analyze data, and make conclusion
on the basis of the analysis. As a researcher, we
need to master both the “science” and the “art”
of using statistical methodology correctly. Careful
use of statistical methods will enable us to obtain
accurate information from data.
13. Design Parametric Nonparametric
One-Group Design One-Group t-test Chi-Square Goodness of Fit
Test
Two-Group Design
t-test Independent Mann-Whitney U Test
Chi-Square Test of
Independence
Pretest and Posttest
Design
t-test Dependent Wilcoxon Signed Ranks Test
McNemar Test
Three or More
Groups Design
Analysis of Variance
ANOVA
Kruskal-Wallis Formula
Chi-Square Test of
Independence
Correlational Study Pearson’s Product
Moment Correlation
Spearman Rank Order
Correlation
Chi-Square Test
14. • A statistical test uses the data obtained from a
sample to make a decision about whether or
not the null hypothesis should be rejected. The
numerical value obtained from a statistical test
is called the test value.
Possible Outcomes of a Hypothesis Test
Type 1 Error occurs if one rejects the null
hypothesis when it is true.
Type 2 Error occurs if one accepts the null
hypothesis when it is false.
15. Step 3:Choose an appropriate level
of significance.
Step 4:Compute the test value.
Step 5:Make the decision to reject
or not reject the null hypothesis.
Step 6:Summarize the result.
16. The Conclusion and Interpretation of Data
• If the decision is “reject Ho”, then the
conclusion should be worded something like,
“There is sufficient evidence at the alpha level
of significance to show that…(the meaning of
alternative hypothesis).”
• If the decision is “Fail to reject Ho”, then the
conclusion should be worded something like,
There is no sufficient evidence at the alpha
level of significance to show that…(the
meaning of the alternative hypothesis.”
17. • We must always remember that
when the decision is made, nothing
has been proved. Both decisions can
lead to errors: “Fail to reject Ho”
could be type II error and “Reject
Ho” could be a type I error.
18. Probability-Value, or p-Value
• It is the probability that the test statistic could be
the value it is or a more extreme value (in the
direction of the alternative hypothesis) when the
null hypothesis is true. It is the probability of
obtaining sample mean difference as far apart as
we have, if the null hypothesis were true.
• If the p-value is less than or equal to the level of
significance alpha, then the decision must be
“Reject Ho”.
• If the p-value is greater than the level of
significance alpha, then the decision must be “Fail
to reject Ho”.
20. According to Statistics Laerd
Your data can be checked to
determine whether it is normally
distributed using a variety of tests.
This section of the guide will
concentrate on one of the most
common methods: the Shapiro-
Wilk test of normality.
21. According to Statistics Laerd
This is a numerical method and the result of
this test is available in the output because it
was run when you selected the Normality
plots with tests option in the Explore: Plots
dialogue box. Other methods of
determining if your data is normally
distributed, such as skewness and kurtosis
values, or histograms, can be found in our
Testing for Normality guide.
22. Furthermore :
The Shapiro-Wilk test is
recommended if you have small
sample sizes (< 50 participants) and
are not confident visually
interpreting Normal Q-Q Plots or
other graphical methods.
23. Furthermore :
The Shapiro-Wilk test tests if data
is normally distributed for each
group of the independent variable.
Therefore, there will be as many
Shapiro-Wilk tests as there are
groups of the independent
variable.
27. T-test for independent samples
- it is used to test the significance of
the difference between two groups
on a certain criterion variable when
data are expressed in the interval
scale.
28. Why do we used the t-test for independent
sample?
• The t-test is used for the
independent sample because it
is more powerful test
compared with other tests of
difference of two independent
groups?
29.
30.
31. Example: Testing the Difference Between Two
Population Means (independent samples)
The following are the scores of 10 male
and 10 female students in spelling. Test
the null hypothesis that there is no
significant between the performance of
male and female students in the test.
α=0.05 level of significance.
32. Male Female
14 12
18 9
17 11
16 5
4 10
14 3
12 7
10 2
9 6
17 13
Mean
Standard deviation
Sample size
34. The following are the scores of 20
male and 20 female students in
Mathematics test. Test the null
hypothesis that there is no significant
between the scores of male students
and scores of female students in
Mathematics test. α=0.05 level of
significance.
35.
36.
37.
38.
39. T- test for dependent samples
It is used to determine the significance of the
difference between two dependent or correlated
samples, data are expressed in the interval scale.
Usually it is used in pre-post experimental design to
determine whether a certain treatment is effective or
not. The subjects are given a pretest, undergo the
treatment, e.g., a new method of teaching, then given
the same test as post test. In this case, there is only
one group involved. This group is administered the
same instrument twice, and the difference between
the pretest and posttest is subjected to a t-test for
dependent samples.
40. • At the start of the school year, a teacher
identified the fifteen (15) students in her class
with the lowest grade in Mathematics in the
previous year level. She wanted to give remedial
lessons to these students to improve their
performance in Mathematics. She design a
remedial mathematics program and developed a
test composed of 50 items to measure
mathematics performance. She administered the
Pre-test to the fifteen (15) students before giving
them the remedial lessons. Then, she conducted
a remedial lessons. After three weeks, she again
administered the post-test to the same students.
41.
42.
43.
44. Example: At the start of the school year, a teacher
identified the eight students in her class with the
lowest grade in Mathematics in the previous year
level. She wanted to give remedial lessons to these
students to improved their performance in
Mathematics. She design a remedial mathematics
program and developed an achievement test
composed of 50 items to measure mathematics
performance. She administer ed the achievement
test to the 8 students before giving them the
remedial lessons. Then, she conducted a remedial
lessons. After three weeks, she again administered
the same achievement test.
45. • The data shows the students’ scores in
pretest and in the posttest. Determine if
there is a significant improvement in the
mathematics performance of the students
from the pretest to the posttest.
Pretest Posttest
29 45
30 44
19 42
27 41
10 34
24 38
12 29
9 20
47. Workshop # 2
1. English test was administered to 19 boys and 21
girls, Test whether the girls differ in their scores
from that of the boys. Use α=0.05. Follow the steps
in hypothesis testing.
Boys: 30, 28, 25, 24, 16, 10, 19, 27, 28,16,
15, 23, 20, 18, 17, 12, 28, 9, 15.
Girls: 27,18, 15, 10, 25, 29, 19, 23, 26, 20,
18, 10, 16, 28, 29, 24, 20, 24, 27, 12, 9.
48. 2. Is there a significant improvement in the
learning process of the students based from
their pre-evaluation and post evaluation
conducted by their teacher?
Data:
Student No. 1 2 3 4 5 6 7 8 9 10
Pre-Evaluation 25 23 30 7 3 22 12 30 5 14
Post-Evaluation 28 19 34 10 6 26 13 47 16 9
49. 3. The data below are those obtained for a group of 10
subjects on a choice- reaction time experiment
under stress and no stress condition. The problem
here is to test whether the means under the two
conditions are significantly different.α= 0.01
Subject: 1 2 3 4 5 6 7 8 9 10
Stress: 9 10 4 15 6 5 9 10 6 12
No stress: 5 15 7 8 4 9 8 15 6 16