Downloaded 1,652 times

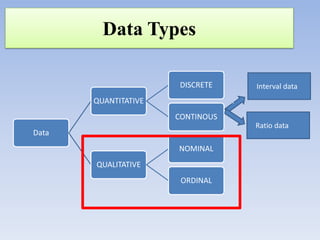

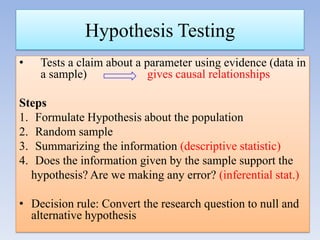


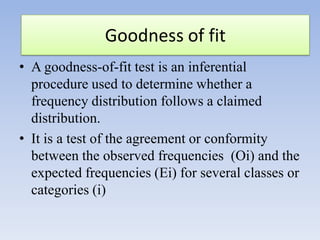
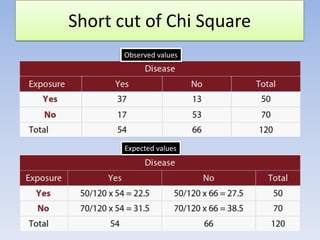
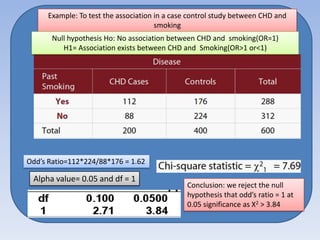
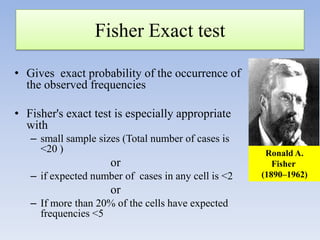
![=> (37- 22.5)2/22.5 +(13 –
27.5)2/27.5 +(17-31.5)2
/31.5+ (53-38.5)2/38.5 =
29.1
120[(37)(53)(13)(17)]2
/ 54(66)(50)(70)
= 29.1](https://image.slidesharecdn.com/chisquaretestfinal-140131063217-phpapp02/85/Chi-square-test-final-42-320.jpg)

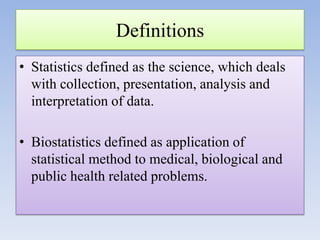
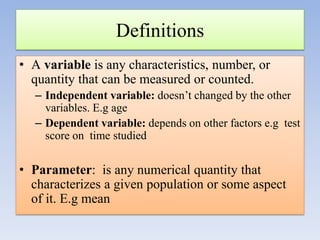
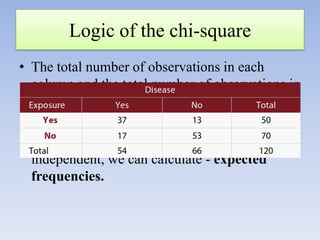
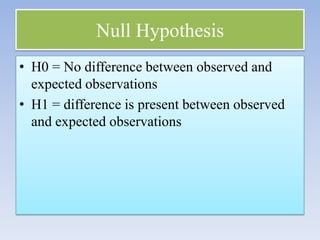
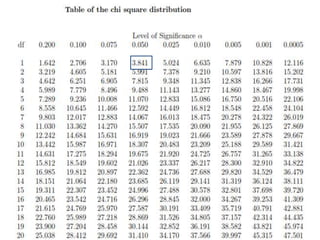
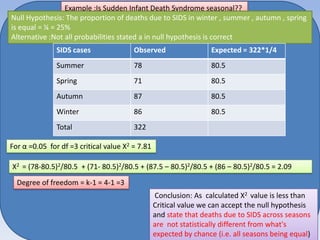
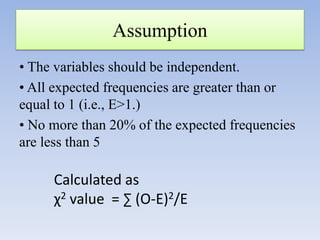
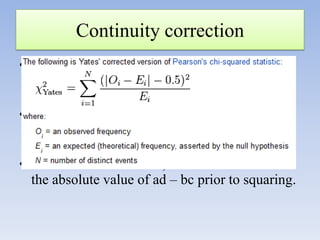
![To test association of smoking exposure and CHD in a matched case control
study
Null hypothesis : No association of smoking exposure and CHD (OR=1)
Alternative Hypothesis: Association exists between smoking exposure and CHD(OR>1 or< 1)
CHD absent
• Test whether OR = 1 by calculating
Smoking history
Smoking history
McNemar’s statistic
present
absent
Smoking history
present
20
40(bb)
Smoking history
absent
CHD present
10(cc)
30
Alpha value= 0.05 and df = 1
OR=40/10 = 4
X2= [(40-10)-1]2/(40+10) = 841/50 = 16.81
Conclusion: We reject the Null Hypothesis
that OR =1 as calculated X 2 >3.84](https://image.slidesharecdn.com/chisquaretestfinal-140131063217-phpapp02/85/Chi-square-test-final-49-320.jpg)
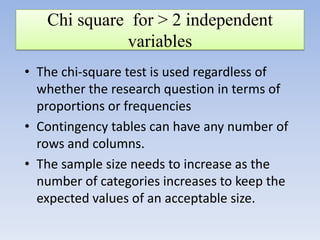
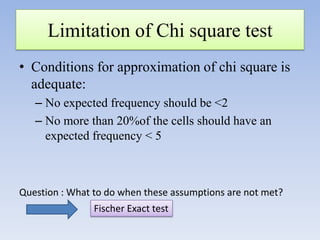


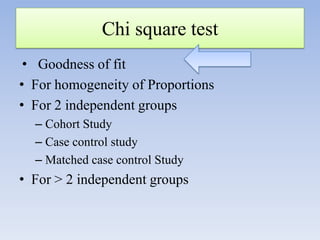
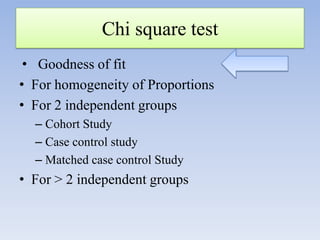
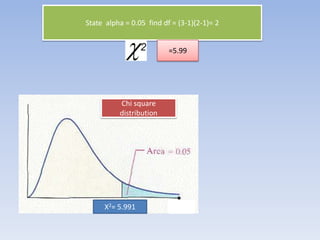
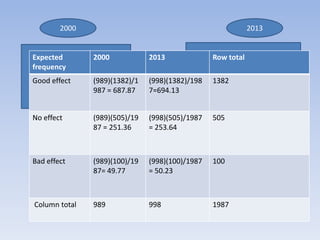
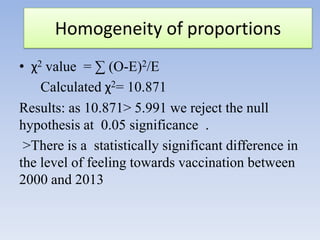
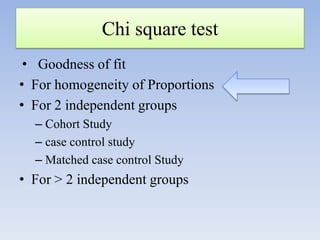
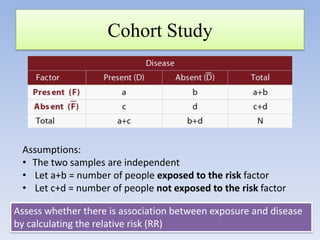
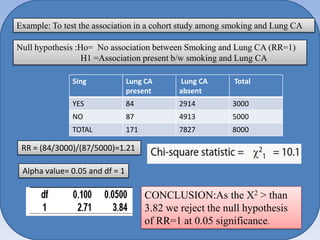
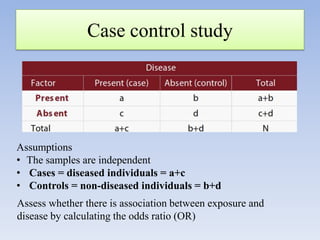
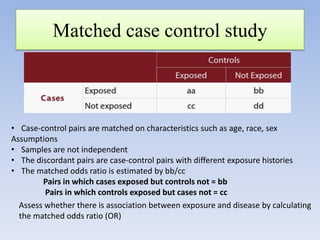
The document provides information about the Chi Square test, including: - It is one of the most widely used statistical tests in research. - It compares observed frequencies to expected frequencies to test hypotheses about categorical variables. - The key steps are defining hypotheses, calculating the test statistic, determining the degrees of freedom, finding the critical value, and making a conclusion by comparing the test statistic to the critical value. - It can be used for goodness of fit tests, tests of homogeneity of proportions, and tests of independence between categorical variables. Examples of applications in cohort studies, case-control studies, and matched case-control studies are provided.


![Hypothalamus short ppt by Dr. Neha [PT].pptx](https://cdn.slidesharecdn.com/ss_thumbnails/hypothalamusbydr-260124145759-b9f94a93-thumbnail.jpg?width=640&height=640&fit=bounds)


