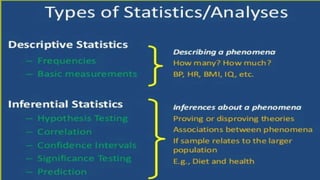
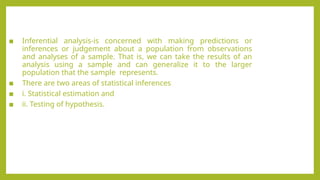
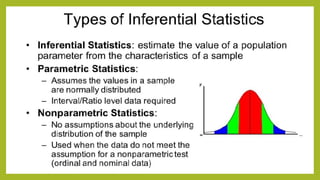
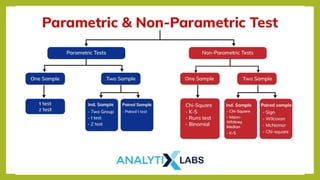
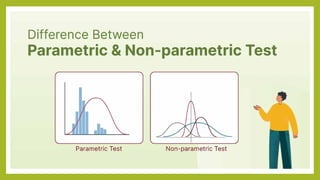
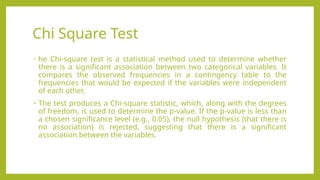
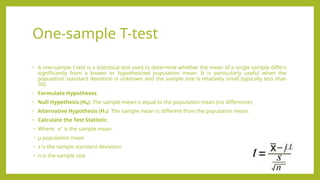
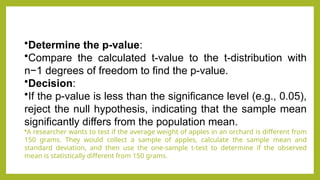
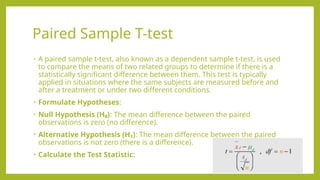
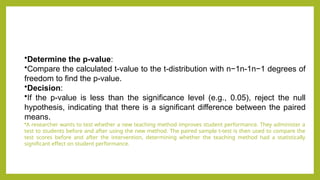
STATISTICAL TESTS &
SOFTWARES
▪ Inferential analysis-is concerned with making predictions or
inferences or judgement about a population from observations
and analyses of a sample. That is, we can take the results of an
analysis using a sample and can generalize it to the larger
population that the sample represents.
▪ There are two areas of statistical inferences
▪ i. Statistical estimation and
▪ ii. Testing of hypothesis.
Statistical Significance
What is statistical significance?
• Statistically significant findings mean that the probability of
obtaining such findings by chance only is less than 5%.
– findings would occur no more than 5 out of 100 times by
chance alone.
What if your study finds there is an effect?
• You will need to measure how big the effect is, you can do this by
using a measure of association (odds ratio, relative risk, absolute
risk, attributable risk etc.).
Skewed distributions
• Normal distribution: Not
skewed in any direction.
• Positive skew: The distribution has
a long tail in the positive direction,
or to the right.
• Negative skew: The distribution
has a long tail in the negative
direction, or to the left.
Normal Distribution
• In a normal distribution, about
68% of the scores are within one
standard deviation of the mean.
• 95% of the scores are within
two standard deviations of the
mean.
.025 .025
Types of Variables Analysis
8
• One variable
(Univariate)
• E.g. Age, gender,
income etc.
UNIVARIATE
ANALYSIS
• Two variables
(Bivariate)
• E.g. gender &
CGPA
BIVARIATE
ANALYSIS
• several variables
(Multivariate)
• E.g. Age,
education, and
prejudice
MULTIVARIATE
ANALYSIS
Chi Square Test
• he Chi-square test is a statistical method used to determine whether
there is a significant association between two categorical variables. It
compares the observed frequencies in a contingency table to the
frequencies that would be expected if the variables were independent
of each other.
• The test produces a Chi-square statistic, which, along with the degrees
of freedom, is used to determine the p-value. If the p-value is less than
a chosen significance level (e.g., 0.05), the null hypothesis (that there is
no association) is rejected, suggesting that there is a significant
association between the variables.
One-sample T-test
• A one-sample t-test is a statistical test used to determine whether the mean of a single sample differs
significantly from a known or hypothesized population mean. It is particularly useful when the
population standard deviation is unknown and the sample size is relatively small (typically less than
30).
• Formulate Hypotheses:
• Null Hypothesis (H₀): The sample mean is equal to the population mean (no difference).
• Alternative Hypothesis (H₁): The sample mean is different from the population mean.
• Calculate the Test Statistic:
• Where: xˉ is the sample mean
• μ population mean
• s is the sample standard deviation
• n is the sample size
•Determine the p-value:
•Compare the calculated t-value to the t-distribution with
n−1 degrees of freedom to find the p-value.
•Decision:
•If the p-value is less than the significance level (e.g., 0.05),
reject the null hypothesis, indicating that the sample mean
significantly differs from the population mean.
•A researcher wants to test if the average weight of apples in an orchard is different from
150 grams. They would collect a sample of apples, calculate the sample mean and
standard deviation, and then use the one-sample t-test to determine if the observed
mean is statistically different from 150 grams.
Paired Sample T-test
• A paired sample t-test, also known as a dependent sample t-test, is used
to compare the means of two related groups to determine if there is a
statistically significant difference between them. This test is typically
applied in situations where the same subjects are measured before and
after a treatment or under two different conditions.
• Formulate Hypotheses:
• Null Hypothesis (H₀): The mean difference between the paired
observations is zero (no difference).
• Alternative Hypothesis (H₁): The mean difference between the paired
observations is not zero (there is a difference).
• Calculate the Test Statistic:
•Determine the p-value:
•Compare the calculated t-value to the t-distribution with n−1n-1n−1 degrees of
freedom to find the p-value.
•Decision:
•If the p-value is less than the significance level (e.g., 0.05), reject the null
hypothesis, indicating that there is a significant difference between the paired
means.
•A researcher wants to test whether a new teaching method improves student performance. They administer a
test to students before and after using the new method. The paired sample t-test is then used to compare the
test scores before and after the intervention, determining whether the teaching method had a statistically
significant effect on student performance.
ARM Module 5. Advanced research methodology

ARM Module 5. Advanced research methodology

  • 1.
  • 3.
    ▪ Inferential analysis-isconcerned with making predictions or inferences or judgement about a population from observations and analyses of a sample. That is, we can take the results of an analysis using a sample and can generalize it to the larger population that the sample represents. ▪ There are two areas of statistical inferences ▪ i. Statistical estimation and ▪ ii. Testing of hypothesis.
  • 5.
    Statistical Significance What isstatistical significance? • Statistically significant findings mean that the probability of obtaining such findings by chance only is less than 5%. – findings would occur no more than 5 out of 100 times by chance alone. What if your study finds there is an effect? • You will need to measure how big the effect is, you can do this by using a measure of association (odds ratio, relative risk, absolute risk, attributable risk etc.).
  • 6.
    Skewed distributions • Normaldistribution: Not skewed in any direction. • Positive skew: The distribution has a long tail in the positive direction, or to the right. • Negative skew: The distribution has a long tail in the negative direction, or to the left.
  • 7.
    Normal Distribution • Ina normal distribution, about 68% of the scores are within one standard deviation of the mean. • 95% of the scores are within two standard deviations of the mean. .025 .025
  • 8.
    Types of VariablesAnalysis 8 • One variable (Univariate) • E.g. Age, gender, income etc. UNIVARIATE ANALYSIS • Two variables (Bivariate) • E.g. gender & CGPA BIVARIATE ANALYSIS • several variables (Multivariate) • E.g. Age, education, and prejudice MULTIVARIATE ANALYSIS
  • 11.
    Chi Square Test •he Chi-square test is a statistical method used to determine whether there is a significant association between two categorical variables. It compares the observed frequencies in a contingency table to the frequencies that would be expected if the variables were independent of each other. • The test produces a Chi-square statistic, which, along with the degrees of freedom, is used to determine the p-value. If the p-value is less than a chosen significance level (e.g., 0.05), the null hypothesis (that there is no association) is rejected, suggesting that there is a significant association between the variables.
  • 12.
    One-sample T-test • Aone-sample t-test is a statistical test used to determine whether the mean of a single sample differs significantly from a known or hypothesized population mean. It is particularly useful when the population standard deviation is unknown and the sample size is relatively small (typically less than 30). • Formulate Hypotheses: • Null Hypothesis (H₀): The sample mean is equal to the population mean (no difference). • Alternative Hypothesis (H₁): The sample mean is different from the population mean. • Calculate the Test Statistic: • Where: xˉ is the sample mean • μ population mean • s is the sample standard deviation • n is the sample size
  • 13.
    •Determine the p-value: •Comparethe calculated t-value to the t-distribution with n−1 degrees of freedom to find the p-value. •Decision: •If the p-value is less than the significance level (e.g., 0.05), reject the null hypothesis, indicating that the sample mean significantly differs from the population mean. •A researcher wants to test if the average weight of apples in an orchard is different from 150 grams. They would collect a sample of apples, calculate the sample mean and standard deviation, and then use the one-sample t-test to determine if the observed mean is statistically different from 150 grams.
  • 14.
    Paired Sample T-test •A paired sample t-test, also known as a dependent sample t-test, is used to compare the means of two related groups to determine if there is a statistically significant difference between them. This test is typically applied in situations where the same subjects are measured before and after a treatment or under two different conditions. • Formulate Hypotheses: • Null Hypothesis (H₀): The mean difference between the paired observations is zero (no difference). • Alternative Hypothesis (H₁): The mean difference between the paired observations is not zero (there is a difference). • Calculate the Test Statistic:
  • 15.
    •Determine the p-value: •Comparethe calculated t-value to the t-distribution with n−1n-1n−1 degrees of freedom to find the p-value. •Decision: •If the p-value is less than the significance level (e.g., 0.05), reject the null hypothesis, indicating that there is a significant difference between the paired means. •A researcher wants to test whether a new teaching method improves student performance. They administer a test to students before and after using the new method. The paired sample t-test is then used to compare the test scores before and after the intervention, determining whether the teaching method had a statistically significant effect on student performance.