Download as PDF, PPTX


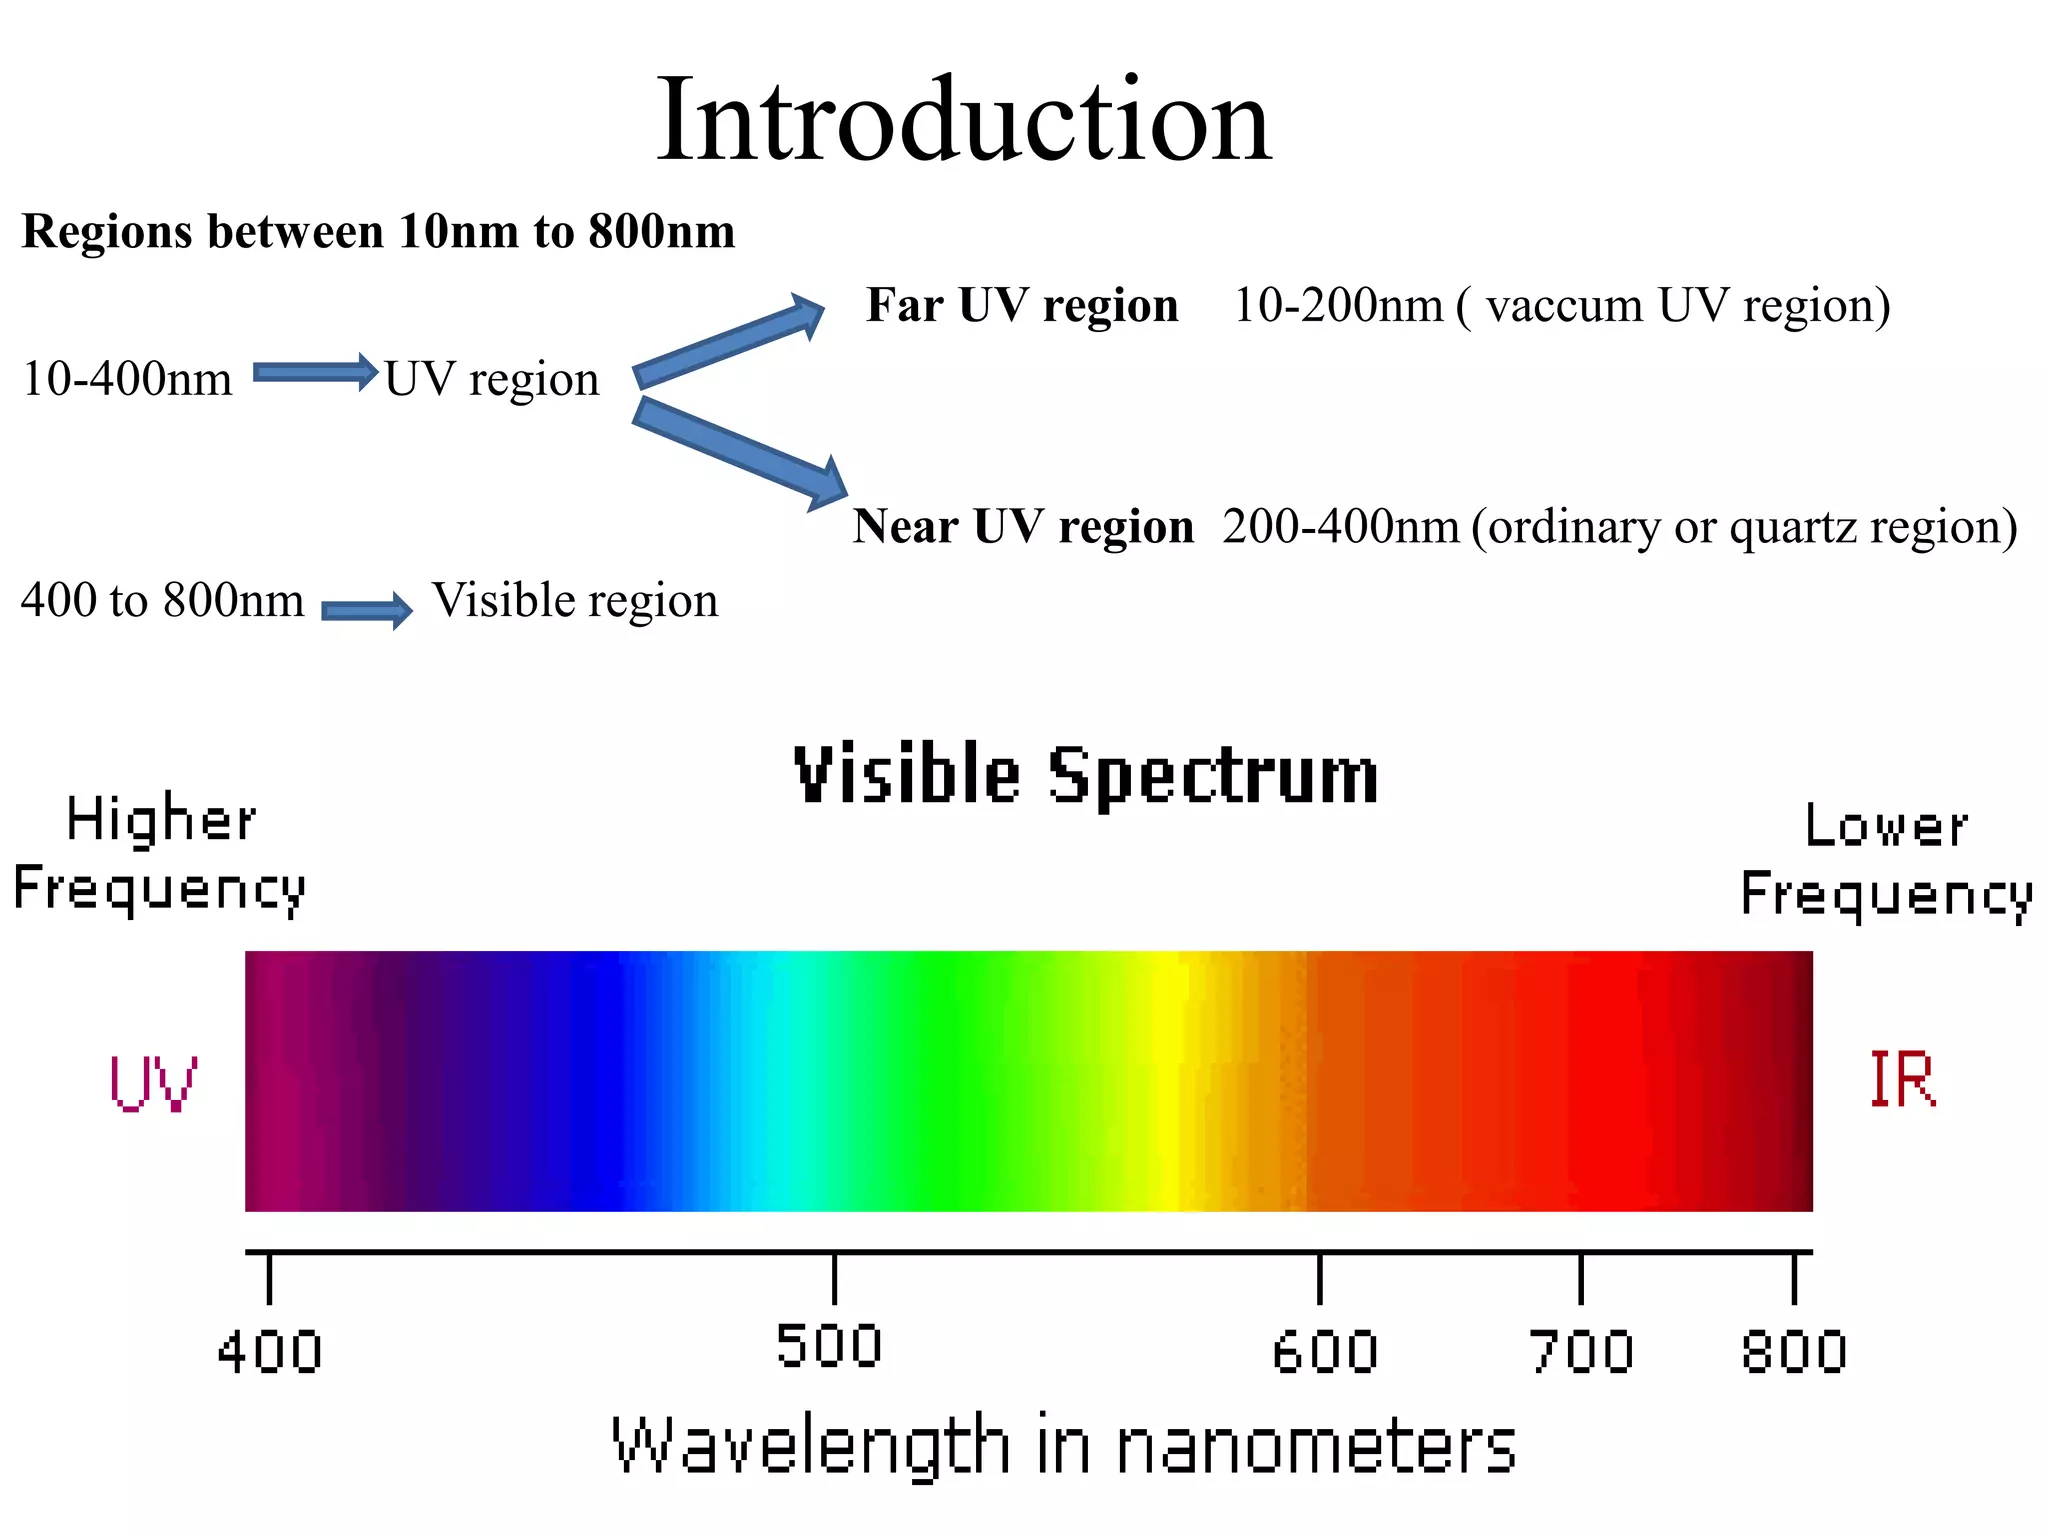


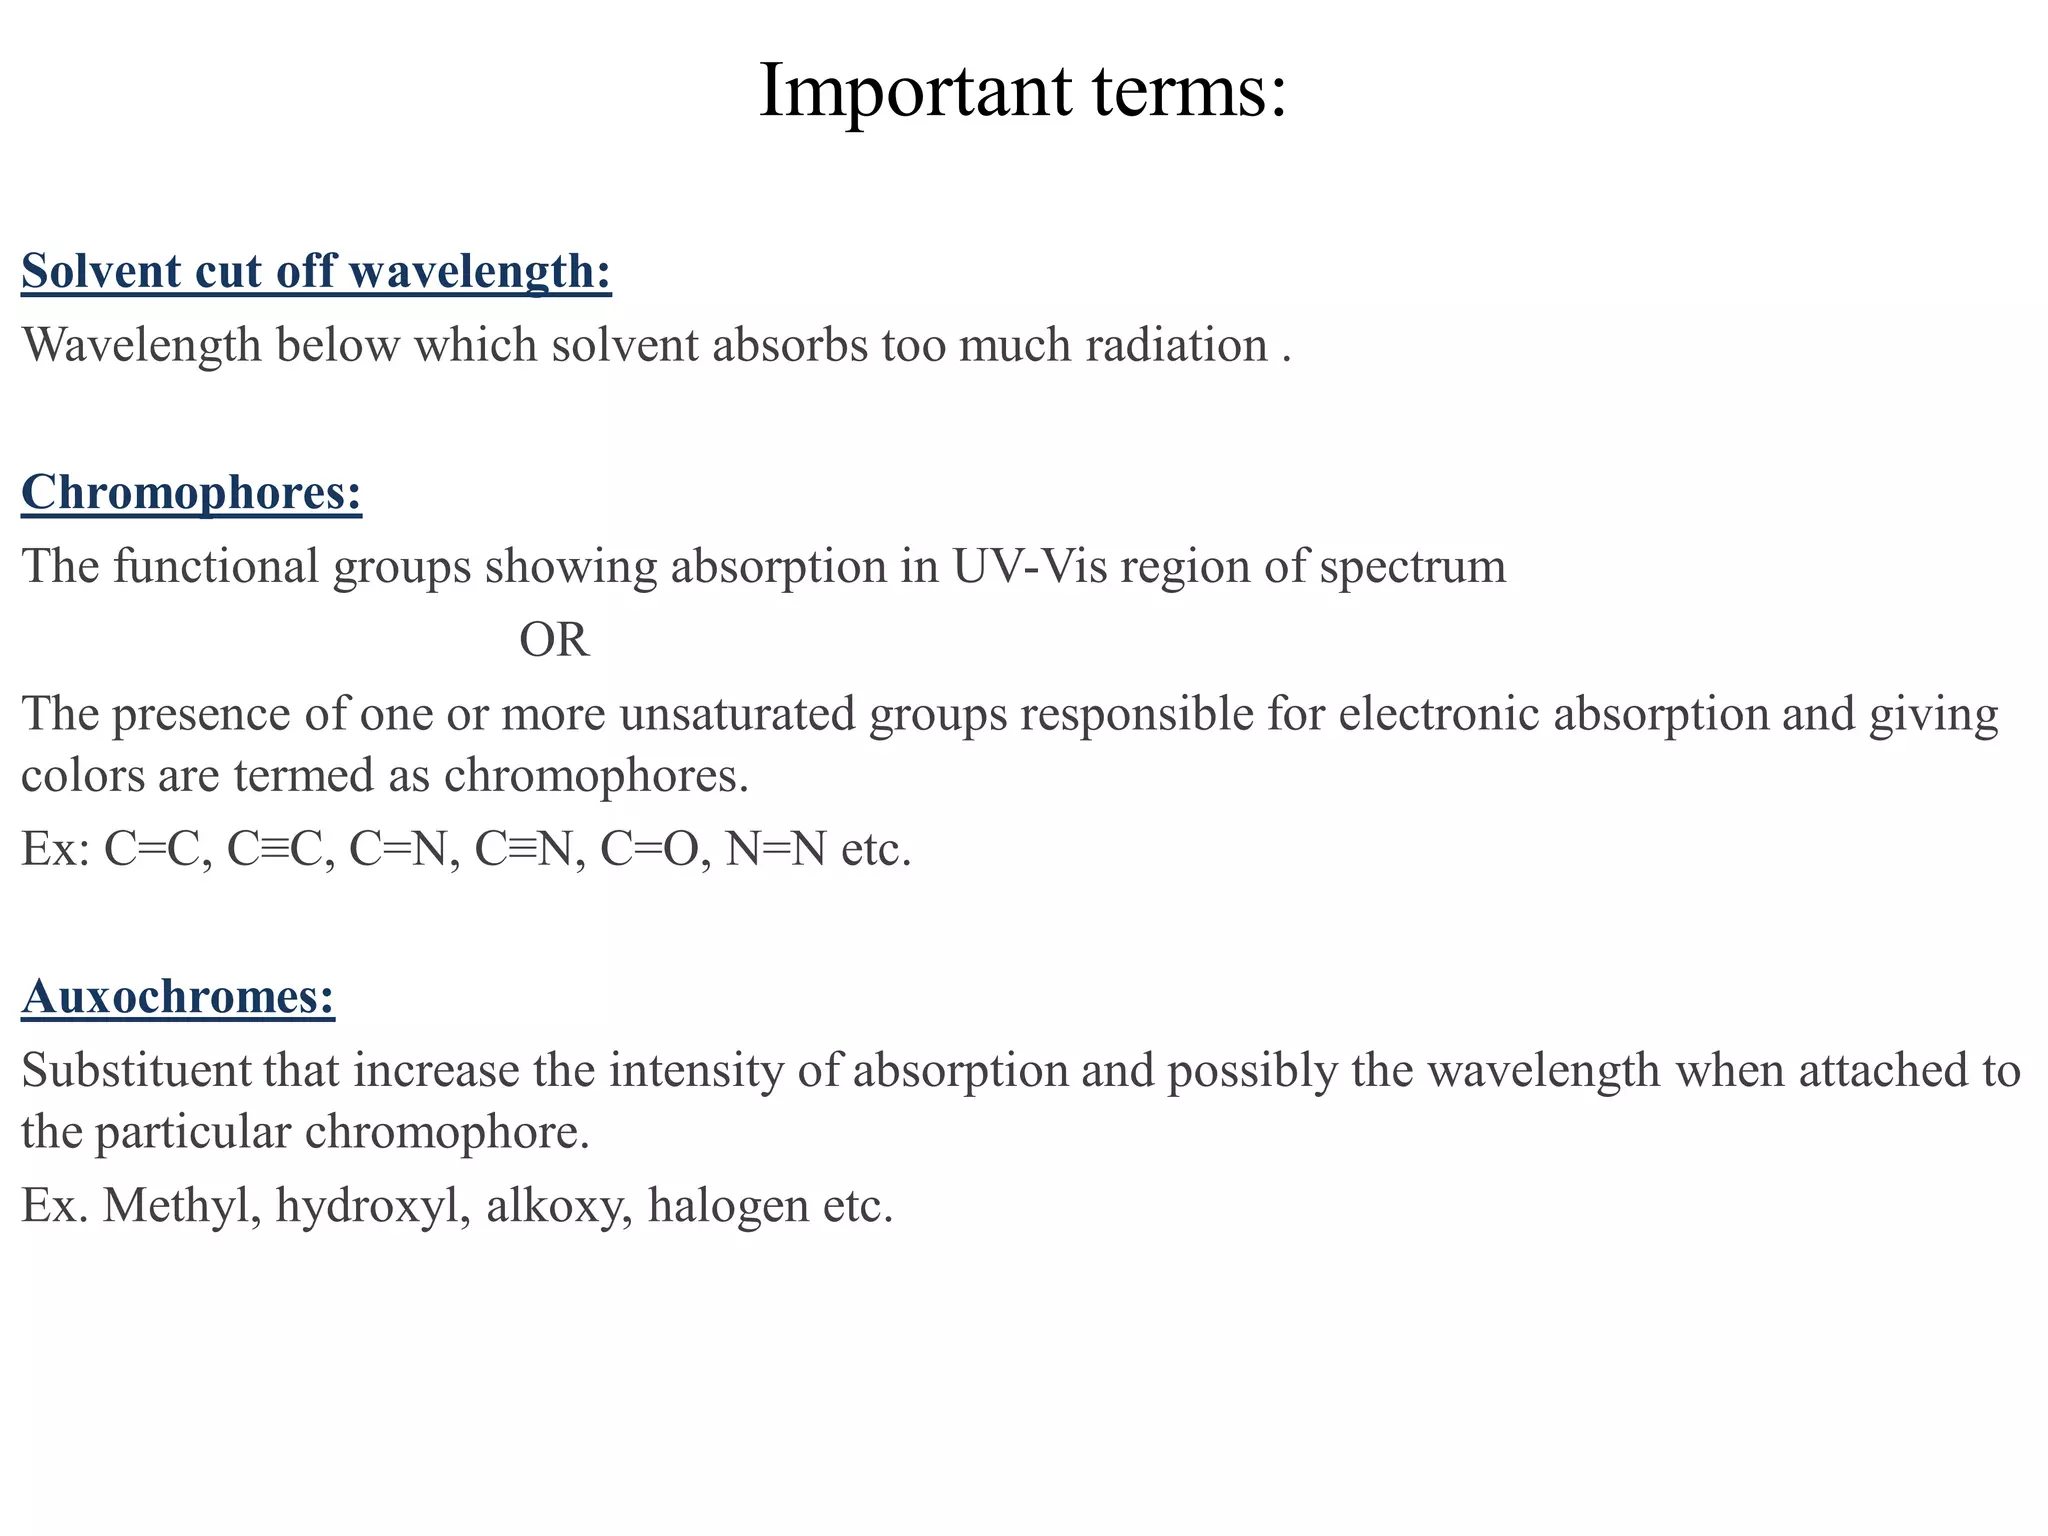


UV-Vis spectroscopy measures absorption of ultraviolet and visible light by molecules. It works on the principle of Beer-Lambert law, where absorption is directly proportional to concentration and path length of light through the sample. The instrument consists of a light source, monochromator, sample holder, and detector. Electronic transitions between molecular orbitals that can be detected by UV-Vis spectroscopy include σ-σ*, n-σ*, π-π*, and n-π* transitions. Sample preparation and choice of solvent are important factors to consider. UV-Vis spectroscopy has applications in qualitative and quantitative analysis, identification of compounds, and studying kinetics and equilibria.


