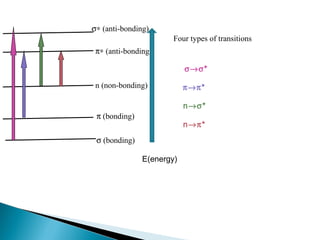
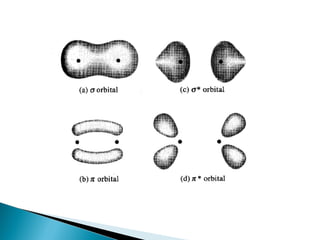
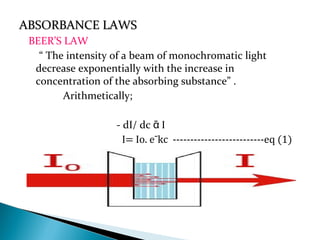
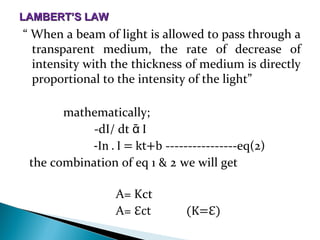
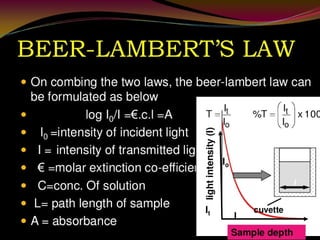
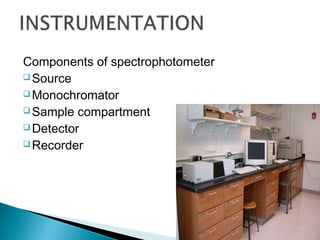
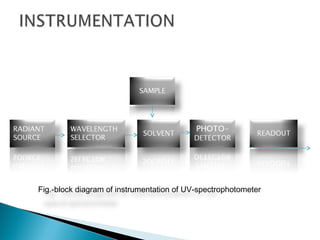
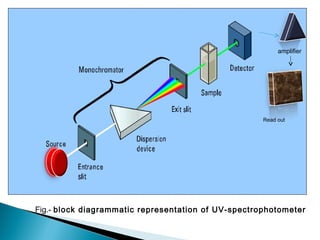
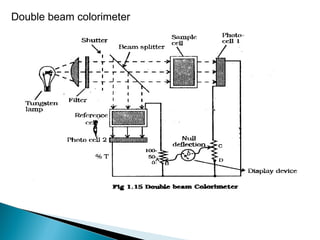
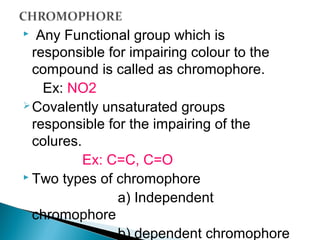
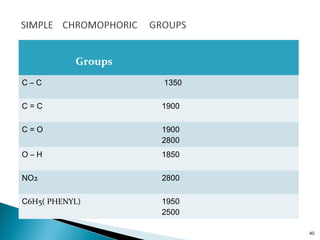
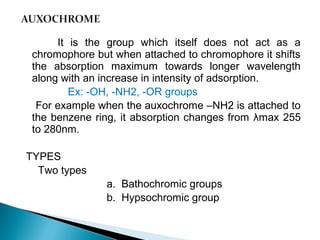
SlideShare a Scribd company logo
1 of 50
Ultra-violet visible
spectroscopy
PRESENTED BY
SHAIK IMRAN
14AB1S0406
UNDER THE
GUIDANCE OF:
CH.DEVADASU
M.PHM.
DEPARTMENT OF PA &
 DEFINITION
 UV RADIATION
 PRINCIPLE OF UV-VIS SPECTROMETRY
 THE ABSORPTION SPECTRUM
 TYPES OF TRANSITIONS
 ABSORBANCE LAWS
 INSTRUMENTATION
 EFFECT OF CHROMOPHORE
 SOLVENT EFFECTS
 APPLICATIONS
Ultraviolet and visible (UV-Vis)
absorption spectroscopy is the
measurement of the attenuation of a
beam of light after it passes through a
sample or after reflection from a sample
surface. Absorption measurements can
be at a single wavelength or over an
extended spectral range.
1. Detection of functional groups.
2. Detection of impurities
3. Qualitative analysis
4. Quantitative analysis
5. Single compound without chromophore
6. Drugs with chromophoric reagent
7. It helps to show the relationship between
different groups, it is useful to detect the
conjugation of the compounds
The region beyond red is called infra-red while
that beyond violet is called as ultra –violet. The
wavelength range of uv radiation starts at blue
end of visible light(4000A) & ends at 2000A.̊
 Ultraviolet absorption spectra arise from transition of electron with in a molecule from a lower level to a
higher level.
 A molecule absorb ultraviolet radiation of frequency (𝜗), the electron in that molecule undergo transition
from lower to higher energy level.
The energy can be calculated by the equation,
E=h𝜗 erg
E₁-E = h𝜗ₒ
Etotal=Eelectronic+Evibrotional+Erotational
The energies decreases in the following order:
Electronic ⪢Vibrational ⪢ Rotational
Thus the energy of the radiation in the visible range is generally: 36 to 72 kcal/mole while that
in the ultraviolet range goes as high as 143 kcal/mole
When a sample is exposed to light energy that matches
the energy difference between a possible electronic
transition within the molecule, a fraction of the light energy
would be absorbed by the molecule and the electrons
would be promoted to the higher energy state orbital. A
spectrometer records the degree of absorption by a
sample at different wavelengths and the resulting plot of
absorbance (A) versus wavelength (λ) is known as a
spectrum.
The significant features:
 λmax (wavelength at which there is a maximum
absorption)
 єmax (The intensity of maximum absorption)
 UV-visible spectrum of isoprene showing maximum absorption at 222 nm.
Every time a molecule has a bond, the atoms in a
bond have their atomic orbitals merged to form
molecular orbitals which can be occupied by
electrons of different energy levels. Ground state
molecular orbitals can be excited to anti-bonding
molecular orbitals.
These electrons when imparted with energy in the
form of light radiation get excited from the highest
occupied molecular orbital (HOMO) to the lowest
unoccupied molecular orbital (LUMO) and the
resulting species is known as the excited state or
anti-bonding state.
TYPES OF TRANSITIONS:
In U.V spectroscopy molecule undergo
electronic transition involving σ, π and n
electrons.
 Four types of electronic transition are
possible.
i. σ σ* transition⇾
ii. n σ* transition⇾
iii. n π* transition⇾
iv. π π* transition⇾
13
 An electron in a bonding σ orbital of a molecule
is excited to the corresponding anti-bonding
orbital by the absorption of radiation.
 To induce a σ ⇾ σ* transition it required LARGE
ENERGY. Ex: Methane
 Methane contain only single C-H bonds it undergo
only σ ⇾ σ* transition only, it gives absorption
maximum at 125nm.
In this type saturated compounds containing atoms
with unshared electron pairs are undergo n ⇾ σ*
transition.
It require less energy than the σ ⇾ σ* type.
Most of the absorption peaks appearing below
200nm.
In the presence of polar solvents the absorption
maximum tend to shift shorter wavelength
Ex: Water , ethanol.
 In this the peaks in U.V region relatively small.
Ex: Methlychloride , Oxygen, Nitrogen.
Most organic compounds are undergo transitions
for n ⇾ π* and π π* transition.⇾
 Because energies required for processes bring
the absorption peaks into spectral region.
 Both transition require the presence of an
unsaturated functional group to the ∏ orbitals.´ ´
 Ex: For π π* Alkenes, carbonyl⇾ ⧐
compounds, alkynes
 For n π* carbonyl compounds.⇾ ⧐
σ (bonding)
π (bonding)
n (non-bonding)
σ∗ (anti-bonding)
π∗ (anti-bonding)
Four types of transitions
π→π*
n→σ*
n→π*
σ→σ*
E(energy)
BEER’S LAW
“ The intensity of a beam of monochromatic light
decrease exponentially with the increase in
concentration of the absorbing substance” .
Arithmetically;
- dI/ dc Iᾱ
I= Io. eˉkc --------------------------eq (1)
ABSORBANCE LAWSABSORBANCE LAWS
“ When a beam of light is allowed to pass through a
transparent medium, the rate of decrease of
intensity with the thickness of medium is directly
proportional to the intensity of the light”
mathematically;
-dI/ dt Iᾱ
-In . I = kt+b ----------------eq(2)
the combination of eq 1 & 2 we will get
A= Kct
A= ℇct (K=ℇ)
LAMBERT’S LAWLAMBERT’S LAW
 The real limitation of the beer’s law is successfully
in describing the absorption behavior of dilute
solution only.
 In this regarding it may be considered as a
limiting law.
 As degree of interaction depends upon the
contraction, the occurrence of this phenomenon
causes deviations from linear relationship
between absorbance and contraction.
LIMITATION OF LAWSLIMITATION OF LAWS
Components of spectrophotometer
 Source
 Monochromator
 Sample compartment
 Detector
 Recorder
Fig.-block diagram of instrumentation of UV-spectrophotometer
Fig.- block diagrammatic representation of UV-spectrophotometer
amplifier
Read out
It is important that the power of the radiation source does
not change abruptly over its wavelength range. The
electrical excitation of deuterium or hydrogen at low
pressure produces a continuous UV spectrum.
Both Deuterium and Hydrogen lamps emit radiation in
the range 160 - 375 nm.
Problem-
 Due to evaporation of tungsten life period decreases.
 It is overcome by using tungsten-halogen lamp.
 Halogen gas prevents evaporation of tungsten.
For ultra violet region-
Hydrogen discharge lamp
 consist of two electrode contain in deuterium filled silica
envelop.
UV-Vis spectrophotometer have both deuterium & tungsten
lamps.
 Selection of lamp is made by moving lamp mounting or
mirror to cause the light fall on Monochromator.
Deuterium lamps:-
 Radiation emitted is 3-5 times more than the hydrogen
discharge lamps.
Xenon discharge lamp:-
 Xenon stored under pressure in 10-30 atmosphere.
All Monochromators contain the following component parts;
• An entrance slit
• A collimating lens
• A dispersing device (a prism or a grating)
• A focusing lens
• An exit slit
 Filters –
a)Glass filters- Made from pieces of colored glass which
transmit limited wave length range of spectrum. Wide band
width 150nm.
b)Gelatin filters- Consist of mixture of dyes placed in gelatin
& sandwiched between glass plates. Band width 25nm.
c)Inter ferometric filters- Band width 15nm
Prisms-
-Prism bends the monochromatic light.
-Amount of deviation depends on wavelength
-They produce non linear dispersion.
Fig.-mechanism of working of prism.
A variety of sample cells available for UV region. The choice
of sample cell is based on
a) the path length, shape, size
b) the transmission characteristics at the desired
wavelength
c) the relative expense
 The cell holding the sample should be transparent to the
wavelength region to be recorded. Quartz or fused silica
cuvettes are required for spectroscopy in the UV region.
Silicate glasses can be used for the manufacture of cuvettes
for use between 350 and 2000nm. The thickness of the cell
is generally 1 cm. cells may be rectangular in shape or
cylindrical with flat ends.
Three common types of detectors are used
I. Barrier layer cell
II. Photo cell detector
III. Photomultiplier , Photo voltaic cells
barrier layer cells
It consist of flat Cu or Fe electrode on which semiconductor such
as selenium is deposited. on the selenium a thin layer of silver or
gold is sputtered over the surface.
 Photomultiplier tube
It is generally used as detector in UV- spectrophotometer It is the
combination of photodiode & electron multiplier.
It consist of evacuated tube contains photo- cathode. 9-16 electrodes
known as dynodes.
Advantage of double beam spectrophotometer:- It is not necessary to
continually replace the blank with the sample or to adjust the auto zero.
The ratio of the powers of the sample & reference is constantly obtained.
It has rapid scanning over the wide wavelength region because of the
above two factors.
samplereferenc
e
detector
I0
I0 I0
I
log(I0/I) = A
200
λ, nm
monochromator/
beam splitter optics
UV-VIS sources
Single beam spectrophotometerSingle beam spectrophotometer
Double beam colorimeter
 Any Functional group which is
responsible for impairing colour to the
compound is called as chromophore.
Ex: NO2
Covalently unsaturated groups
responsible for the impairing of the
colures.
Ex: C=C, C=O
 Two types of chromophore
a) Independent
chromophore
b) dependent chromophore
40
Groups
λmax
C – C 1350
C = C 1900
C = O 1900
2800
O – H 1850
NO2 2800
C6H5( PHENYL) 1950
2500
It is the group which itself does not act as a
chromophore but when attached to chromophore it shifts
the absorption maximum towards longer wavelength
along with an increase in intensity of adsorption.
Ex: -OH, -NH2, -OR groups
For example when the auxochrome –NH2 is attached to
the benzene ring, it absorption changes from λmax 255
to 280nm.
TYPES
Two types
a. Bathochromic groups
b. Hypsochromic group
BATHOCHROMIC GROUPS
Those groups which deepen the colour of
chromogen are called bathochromic groups.
Deepening of colour means displacement
to longer wavelength.
yellow orange red purple⇾ ⇾ ⇾ ⇾
violet blue green⇾ ⇾
Those groups which diminish or lighten the colour of the chromogen
are called hypsochromic groups.
 They cause displacement to shorter wavelength.
Ex:- acetylation of –OH or –NH2 groups, -OCOCH3 and –
NHCOCH3
200 nm 700 nm
ε
Hypochromic
Hypsochromic
Hyperchromic
Bathochromic
SOLVENT EFFECTS - INTENSITYSOLVENT EFFECTS - INTENSITY
Solvents can induce significant changes in the intensity of peaks.
Hyperchromic – Increase in absorption intensity.
Hypochromic – Decrease in absorption intensity.
Solvent λmax εmax
Hexane 260 2000
Chloroform 263 4500
Ethanol 260 4000
Water 260 4000
Ethanol - HCl (1:1) 262 5200
Absorption characteristics of 2-methylpyridine
 π -> π* transitions leads to more polar excited state that is more easily
stabilized by polar solvent associations (H-bonds). The π* state is more polar
and stabilized more in polar solvent relative to nonpolar one, thus in going
from nonpolar to polar solvent there is a red shift or bathochromic shift
(increase in λmax
, decrease in ΔE).
 For n -> π* transition, the n state is much more easily stabilized by polar
solvent effects (H-bonds and association), so in going from nonpolar to polar
solvent there is a blue shift or hypsochromic shift (decrease in λmax
, increase in
ΔE).
APPLICATIONS:
A. APPLICATIONS IN ORGANIC COMPOUNDS
1.It is helps to show the relationship between different groups, it is useful to
detect the conjugation of the compounds
2.Detection of geometrical isomers, In case of geometrical isomers compounds,
that trans isomers exhibits λmax at slightly longer wavelength and have larger
extinction coefficient then the cis isomers .
3.Detection of functional groups, it is possible to detect the presence of certain
functional groups with the help of UV Spectrum.
GENERAL APPLICATIONS:
1.Qualitative analysis, UV absorption spectroscopy can characterizes those type
of compounds which absorb UV radiation. Identification is done by comparing the
absorption spectrum with the spectra of known compound.
2. It is useful in Quantitative analysis of the compounds.
3. Detection of impurities, UV absorption spectroscopy is the one of the best
method for detecting impurities in organic compounds.
Tautomeric equilibrium, UV spectroscopy can be used to determine the
percentage of various keto and enol forms present in tautomeric equilibrium.
5. Chemical kinetics, UV spectroscopy can be used to study the kinetics of
reactions.
6. Molecular weight determination, molecular weights of compounds can be
measured by spectroscopy.
7. Analysis of inorganic compounds.
8. Measuring concentration of solution, absorption band can also used to
determine the concentration of compounds in a solution.
9. Inorganic chemistry, absorption spectra have been used in connection with
many problems in inorganic chemistry.
10. It is useful to determine the structure of the chloral.
QUALITATIVE ANALYSIS
Pharmacopoeial identification of drug
(1) By using absorbance & wavelength
(2) By taking absorption ratio
(3) Limit test (b)Structural analysis
Quantitative analysis
Quantitative analysis A)By using beer’s law and using absorptivity value By using
reference standard Multiple standard method
B)Single compound analysis direct analysis Using separation method After
extraction after chromatographic separation Using column chromatography Using
HPLC
Indirect analysis
a)Single compound without chromophore
b) Drugs with chromophoric reagent
1.For analyte which absorb weakly in UV region
2.For avoiding interference
3.Improve selectivity of assay 
4. Determination of composition of complex Mole ratio method Continuous
variation method ( job curve method )
5 . Study of kinetics
Disadvantages:
 Samples should be in solution. Mixture of substances poses difficult to
analyse and requires prior separation.
Interference from the sample’s matrix makes the measurement difficult .
Uvspectroscopyup 140119003106-phpapp01

More Related Content

What's hot

Column in gas chromatography
Column in gas chromatographyColumn in gas chromatography
Column in gas chromatographyKomalShambharakar
 
Ultraviolet spectroscopy (UV)
Ultraviolet spectroscopy (UV)Ultraviolet spectroscopy (UV)
Ultraviolet spectroscopy (UV)Mona Ismail
 
Uv visible spectroscopy ppt
Uv visible spectroscopy pptUv visible spectroscopy ppt
Uv visible spectroscopy pptAlexa Jacob
 
Infrared spectroscopy
Infrared spectroscopyInfrared spectroscopy
Infrared spectroscopyZainab&Sons
 
Spectrofluorimetry
Spectrofluorimetry Spectrofluorimetry
Spectrofluorimetry kabil07
 
'estimation of quinine sulphate by fluorescence spectroscopy with recordings...
 'estimation of quinine sulphate by fluorescence spectroscopy with recordings... 'estimation of quinine sulphate by fluorescence spectroscopy with recordings...
'estimation of quinine sulphate by fluorescence spectroscopy with recordings...Priya Bardhan Ray
 
Visible and ultraviolet spectroscopy
Visible and ultraviolet spectroscopyVisible and ultraviolet spectroscopy
Visible and ultraviolet spectroscopyRawat DA Greatt
 
1H NMR Spectroscopy
1H NMR Spectroscopy1H NMR Spectroscopy
1H NMR SpectroscopyTushar Naik
 
INTERPRETATION OF MASS SPECTROSCOPY
INTERPRETATION OF MASS SPECTROSCOPYINTERPRETATION OF MASS SPECTROSCOPY
INTERPRETATION OF MASS SPECTROSCOPYvidya chowdhary
 
Uv visible spectroscopy
Uv visible spectroscopyUv visible spectroscopy
Uv visible spectroscopyNarjis Shahid
 
FOURIER TRANSFORM - INFRARED SPECTROSCOPY
FOURIER TRANSFORM - INFRARED SPECTROSCOPYFOURIER TRANSFORM - INFRARED SPECTROSCOPY
FOURIER TRANSFORM - INFRARED SPECTROSCOPYSalmanLatif14
 
Atmospheric Pressure Chemical Ionization
Atmospheric Pressure Chemical IonizationAtmospheric Pressure Chemical Ionization
Atmospheric Pressure Chemical IonizationVISHAL THAKUR
 
INSTRUMENTAL ANALYSIS INTRODUCTION
INSTRUMENTAL ANALYSIS INTRODUCTIONINSTRUMENTAL ANALYSIS INTRODUCTION
INSTRUMENTAL ANALYSIS INTRODUCTIONHamunyare Ndwabe
 
UV SPECTROSCOPY [ULTRA-VIOLET SPECTROSCOPY]
UV SPECTROSCOPY [ULTRA-VIOLET SPECTROSCOPY]UV SPECTROSCOPY [ULTRA-VIOLET SPECTROSCOPY]
UV SPECTROSCOPY [ULTRA-VIOLET SPECTROSCOPY]Shikha Popali
 
IR interpretation and sample handling
 IR interpretation and sample handling  IR interpretation and sample handling
IR interpretation and sample handling Afzaye Rasul
 

What's hot (20)

Column in gas chromatography
Column in gas chromatographyColumn in gas chromatography
Column in gas chromatography
 
Ultraviolet spectroscopy (UV)
Ultraviolet spectroscopy (UV)Ultraviolet spectroscopy (UV)
Ultraviolet spectroscopy (UV)
 
Uv visible spectroscopy ppt
Uv visible spectroscopy pptUv visible spectroscopy ppt
Uv visible spectroscopy ppt
 
Infrared spectroscopy
Infrared spectroscopyInfrared spectroscopy
Infrared spectroscopy
 
Spectrofluorimetry
Spectrofluorimetry Spectrofluorimetry
Spectrofluorimetry
 
MASS SPECTROMETRY=.pdf
MASS SPECTROMETRY=.pdfMASS SPECTROMETRY=.pdf
MASS SPECTROMETRY=.pdf
 
Interferences in AAS
Interferences in AASInterferences in AAS
Interferences in AAS
 
'estimation of quinine sulphate by fluorescence spectroscopy with recordings...
 'estimation of quinine sulphate by fluorescence spectroscopy with recordings... 'estimation of quinine sulphate by fluorescence spectroscopy with recordings...
'estimation of quinine sulphate by fluorescence spectroscopy with recordings...
 
Visible and ultraviolet spectroscopy
Visible and ultraviolet spectroscopyVisible and ultraviolet spectroscopy
Visible and ultraviolet spectroscopy
 
DETECTORS IN HPLC
DETECTORS IN HPLCDETECTORS IN HPLC
DETECTORS IN HPLC
 
1H NMR Spectroscopy
1H NMR Spectroscopy1H NMR Spectroscopy
1H NMR Spectroscopy
 
INTERPRETATION OF MASS SPECTROSCOPY
INTERPRETATION OF MASS SPECTROSCOPYINTERPRETATION OF MASS SPECTROSCOPY
INTERPRETATION OF MASS SPECTROSCOPY
 
Uv visible spectroscopy
Uv visible spectroscopyUv visible spectroscopy
Uv visible spectroscopy
 
FOURIER TRANSFORM - INFRARED SPECTROSCOPY
FOURIER TRANSFORM - INFRARED SPECTROSCOPYFOURIER TRANSFORM - INFRARED SPECTROSCOPY
FOURIER TRANSFORM - INFRARED SPECTROSCOPY
 
Atmospheric Pressure Chemical Ionization
Atmospheric Pressure Chemical IonizationAtmospheric Pressure Chemical Ionization
Atmospheric Pressure Chemical Ionization
 
INSTRUMENTAL ANALYSIS INTRODUCTION
INSTRUMENTAL ANALYSIS INTRODUCTIONINSTRUMENTAL ANALYSIS INTRODUCTION
INSTRUMENTAL ANALYSIS INTRODUCTION
 
UV SPECTROSCOPY [ULTRA-VIOLET SPECTROSCOPY]
UV SPECTROSCOPY [ULTRA-VIOLET SPECTROSCOPY]UV SPECTROSCOPY [ULTRA-VIOLET SPECTROSCOPY]
UV SPECTROSCOPY [ULTRA-VIOLET SPECTROSCOPY]
 
Mass Analyser
Mass AnalyserMass Analyser
Mass Analyser
 
IR interpretation and sample handling
 IR interpretation and sample handling  IR interpretation and sample handling
IR interpretation and sample handling
 
Column efficiency parameters
Column efficiency parametersColumn efficiency parameters
Column efficiency parameters
 

Similar to Uvspectroscopyup 140119003106-phpapp01

Ultra violet (UV) spectroscopy, introduction,principle instrumentation,differ...
Ultra violet (UV) spectroscopy, introduction,principle instrumentation,differ...Ultra violet (UV) spectroscopy, introduction,principle instrumentation,differ...
Ultra violet (UV) spectroscopy, introduction,principle instrumentation,differ...mariomS7
 
Ultraviolet and visible spectrophotometer and Its application in pharmaceutic...
Ultraviolet and visible spectrophotometer and Its application in pharmaceutic...Ultraviolet and visible spectrophotometer and Its application in pharmaceutic...
Ultraviolet and visible spectrophotometer and Its application in pharmaceutic...nikhil kadam
 
Seminar on Uv Visible spectroscopy by Amogh G V
Seminar on Uv Visible spectroscopy by Amogh G VSeminar on Uv Visible spectroscopy by Amogh G V
Seminar on Uv Visible spectroscopy by Amogh G VAmoghGV
 
UV visible Specrosopy and applications
UV visible Specrosopy and applicationsUV visible Specrosopy and applications
UV visible Specrosopy and applicationsNAFIHHASSANMEHABANI
 
Unit 5 Spectroscopic Techniques-converted (1) (1).pdf
Unit 5 Spectroscopic Techniques-converted (1) (1).pdfUnit 5 Spectroscopic Techniques-converted (1) (1).pdf
Unit 5 Spectroscopic Techniques-converted (1) (1).pdfSurajShinde558909
 
12 02-09-12-24-23-1390-sampathkumar
12 02-09-12-24-23-1390-sampathkumar12 02-09-12-24-23-1390-sampathkumar
12 02-09-12-24-23-1390-sampathkumarDONIKAMARKANDE
 
uv spectroscopy by HARVINDAR SINGH .M.PHARM PHARMACEUTICS
 uv spectroscopy by HARVINDAR SINGH .M.PHARM PHARMACEUTICS uv spectroscopy by HARVINDAR SINGH .M.PHARM PHARMACEUTICS
uv spectroscopy by HARVINDAR SINGH .M.PHARM PHARMACEUTICSHarevindarsingh
 
UV-Visible Spectroscopy.pptx
UV-Visible Spectroscopy.pptxUV-Visible Spectroscopy.pptx
UV-Visible Spectroscopy.pptxkhushishresth5
 
UV visible spectroscopy
UV visible spectroscopyUV visible spectroscopy
UV visible spectroscopyAkshay Patil
 
UV-Visible Spectroscopy
UV-Visible SpectroscopyUV-Visible Spectroscopy
UV-Visible SpectroscopyAshish Roge
 
UV Spectroscopy- Pharmaceutical Analysis
UV Spectroscopy- Pharmaceutical AnalysisUV Spectroscopy- Pharmaceutical Analysis
UV Spectroscopy- Pharmaceutical AnalysisPHARMACAD
 
Uv spectroscopy (Collected)
Uv spectroscopy (Collected)Uv spectroscopy (Collected)
Uv spectroscopy (Collected)Istiqur Rahman
 

Similar to Uvspectroscopyup 140119003106-phpapp01 (20)

Uvspectroscopyup
UvspectroscopyupUvspectroscopyup
Uvspectroscopyup
 
Ultra violet (UV) spectroscopy, introduction,principle instrumentation,differ...
Ultra violet (UV) spectroscopy, introduction,principle instrumentation,differ...Ultra violet (UV) spectroscopy, introduction,principle instrumentation,differ...
Ultra violet (UV) spectroscopy, introduction,principle instrumentation,differ...
 
Ultraviolet and visible spectrophotometer and Its application in pharmaceutic...
Ultraviolet and visible spectrophotometer and Its application in pharmaceutic...Ultraviolet and visible spectrophotometer and Its application in pharmaceutic...
Ultraviolet and visible spectrophotometer and Its application in pharmaceutic...
 
Seminar on Uv Visible spectroscopy by Amogh G V
Seminar on Uv Visible spectroscopy by Amogh G VSeminar on Uv Visible spectroscopy by Amogh G V
Seminar on Uv Visible spectroscopy by Amogh G V
 
uv.pptx
uv.pptxuv.pptx
uv.pptx
 
UV visible Specrosopy and applications
UV visible Specrosopy and applicationsUV visible Specrosopy and applications
UV visible Specrosopy and applications
 
UV Visible Spectrometry
UV Visible SpectrometryUV Visible Spectrometry
UV Visible Spectrometry
 
Unit 5 Spectroscopic Techniques-converted (1) (1).pdf
Unit 5 Spectroscopic Techniques-converted (1) (1).pdfUnit 5 Spectroscopic Techniques-converted (1) (1).pdf
Unit 5 Spectroscopic Techniques-converted (1) (1).pdf
 
12 02-09-12-24-23-1390-sampathkumar
12 02-09-12-24-23-1390-sampathkumar12 02-09-12-24-23-1390-sampathkumar
12 02-09-12-24-23-1390-sampathkumar
 
Spectroscopy of uv visible
Spectroscopy of uv visibleSpectroscopy of uv visible
Spectroscopy of uv visible
 
UV Spectroscopy
UV Spectroscopy UV Spectroscopy
UV Spectroscopy
 
uv spectroscopy by HARVINDAR SINGH .M.PHARM PHARMACEUTICS
 uv spectroscopy by HARVINDAR SINGH .M.PHARM PHARMACEUTICS uv spectroscopy by HARVINDAR SINGH .M.PHARM PHARMACEUTICS
uv spectroscopy by HARVINDAR SINGH .M.PHARM PHARMACEUTICS
 
UV-Visible Spectroscopy.pptx
UV-Visible Spectroscopy.pptxUV-Visible Spectroscopy.pptx
UV-Visible Spectroscopy.pptx
 
UV visible spectroscopy
UV visible spectroscopyUV visible spectroscopy
UV visible spectroscopy
 
Uv-vis Spectroscopy
Uv-vis SpectroscopyUv-vis Spectroscopy
Uv-vis Spectroscopy
 
UV-Visible Spectroscopy
UV-Visible SpectroscopyUV-Visible Spectroscopy
UV-Visible Spectroscopy
 
UV Spectroscopy- Pharmaceutical Analysis
UV Spectroscopy- Pharmaceutical AnalysisUV Spectroscopy- Pharmaceutical Analysis
UV Spectroscopy- Pharmaceutical Analysis
 
UV SPECTROSCOPY ppt.pptx
UV SPECTROSCOPY ppt.pptxUV SPECTROSCOPY ppt.pptx
UV SPECTROSCOPY ppt.pptx
 
UV SPECTROSCOPY ppt.pptx
UV SPECTROSCOPY ppt.pptxUV SPECTROSCOPY ppt.pptx
UV SPECTROSCOPY ppt.pptx
 
Uv spectroscopy (Collected)
Uv spectroscopy (Collected)Uv spectroscopy (Collected)
Uv spectroscopy (Collected)
 

Recently uploaded

Presentation by Andreas Schleicher Tackling the School Absenteeism Crisis 30 ...
Presentation by Andreas Schleicher Tackling the School Absenteeism Crisis 30 ...Presentation by Andreas Schleicher Tackling the School Absenteeism Crisis 30 ...
Presentation by Andreas Schleicher Tackling the School Absenteeism Crisis 30 ...EduSkills OECD
 
How to Configure Email Server in Odoo 17
How to Configure Email Server in Odoo 17How to Configure Email Server in Odoo 17
How to Configure Email Server in Odoo 17Celine George
 
Interactive Powerpoint_How to Master effective communication
Interactive Powerpoint_How to Master effective communicationInteractive Powerpoint_How to Master effective communication
Interactive Powerpoint_How to Master effective communicationnomboosow
 
Presiding Officer Training module 2024 lok sabha elections
Presiding Officer Training module 2024 lok sabha electionsPresiding Officer Training module 2024 lok sabha elections
Presiding Officer Training module 2024 lok sabha electionsanshu789521
 
POINT- BIOCHEMISTRY SEM 2 ENZYMES UNIT 5.pptx
POINT- BIOCHEMISTRY SEM 2 ENZYMES UNIT 5.pptxPOINT- BIOCHEMISTRY SEM 2 ENZYMES UNIT 5.pptx
POINT- BIOCHEMISTRY SEM 2 ENZYMES UNIT 5.pptxSayali Powar
 
Organic Name Reactions for the students and aspirants of Chemistry12th.pptx
Organic Name Reactions  for the students and aspirants of Chemistry12th.pptxOrganic Name Reactions  for the students and aspirants of Chemistry12th.pptx
Organic Name Reactions for the students and aspirants of Chemistry12th.pptxVS Mahajan Coaching Centre
 
Accessible design: Minimum effort, maximum impact
Accessible design: Minimum effort, maximum impactAccessible design: Minimum effort, maximum impact
Accessible design: Minimum effort, maximum impactdawncurless
 
Paris 2024 Olympic Geographies - an activity
Paris 2024 Olympic Geographies - an activityParis 2024 Olympic Geographies - an activity
Paris 2024 Olympic Geographies - an activityGeoBlogs
 
How to Make a Pirate ship Primary Education.pptx
How to Make a Pirate ship Primary Education.pptxHow to Make a Pirate ship Primary Education.pptx
How to Make a Pirate ship Primary Education.pptxmanuelaromero2013
 
Science 7 - LAND and SEA BREEZE and its Characteristics
Science 7 - LAND and SEA BREEZE and its CharacteristicsScience 7 - LAND and SEA BREEZE and its Characteristics
Science 7 - LAND and SEA BREEZE and its CharacteristicsKarinaGenton
 
The Most Excellent Way | 1 Corinthians 13
The Most Excellent Way | 1 Corinthians 13The Most Excellent Way | 1 Corinthians 13
The Most Excellent Way | 1 Corinthians 13Steve Thomason
 
Separation of Lanthanides/ Lanthanides and Actinides
Separation of Lanthanides/ Lanthanides and ActinidesSeparation of Lanthanides/ Lanthanides and Actinides
Separation of Lanthanides/ Lanthanides and ActinidesFatimaKhan178732
 
CARE OF CHILD IN INCUBATOR..........pptx
CARE OF CHILD IN INCUBATOR..........pptxCARE OF CHILD IN INCUBATOR..........pptx
CARE OF CHILD IN INCUBATOR..........pptxGaneshChakor2
 
Introduction to ArtificiaI Intelligence in Higher Education
Introduction to ArtificiaI Intelligence in Higher EducationIntroduction to ArtificiaI Intelligence in Higher Education
Introduction to ArtificiaI Intelligence in Higher Educationpboyjonauth
 
SOCIAL AND HISTORICAL CONTEXT - LFTVD.pptx
SOCIAL AND HISTORICAL CONTEXT - LFTVD.pptxSOCIAL AND HISTORICAL CONTEXT - LFTVD.pptx
SOCIAL AND HISTORICAL CONTEXT - LFTVD.pptxiammrhaywood
 
Solving Puzzles Benefits Everyone (English).pptx
Solving Puzzles Benefits Everyone (English).pptxSolving Puzzles Benefits Everyone (English).pptx
Solving Puzzles Benefits Everyone (English).pptxOH TEIK BIN
 
Software Engineering Methodologies (overview)
Software Engineering Methodologies (overview)Software Engineering Methodologies (overview)
Software Engineering Methodologies (overview)eniolaolutunde
 

Recently uploaded (20)

Presentation by Andreas Schleicher Tackling the School Absenteeism Crisis 30 ...
Presentation by Andreas Schleicher Tackling the School Absenteeism Crisis 30 ...Presentation by Andreas Schleicher Tackling the School Absenteeism Crisis 30 ...
Presentation by Andreas Schleicher Tackling the School Absenteeism Crisis 30 ...
 
Model Call Girl in Bikash Puri Delhi reach out to us at 🔝9953056974🔝
Model Call Girl in Bikash Puri  Delhi reach out to us at 🔝9953056974🔝Model Call Girl in Bikash Puri  Delhi reach out to us at 🔝9953056974🔝
Model Call Girl in Bikash Puri Delhi reach out to us at 🔝9953056974🔝
 
How to Configure Email Server in Odoo 17
How to Configure Email Server in Odoo 17How to Configure Email Server in Odoo 17
How to Configure Email Server in Odoo 17
 
Interactive Powerpoint_How to Master effective communication
Interactive Powerpoint_How to Master effective communicationInteractive Powerpoint_How to Master effective communication
Interactive Powerpoint_How to Master effective communication
 
Presiding Officer Training module 2024 lok sabha elections
Presiding Officer Training module 2024 lok sabha electionsPresiding Officer Training module 2024 lok sabha elections
Presiding Officer Training module 2024 lok sabha elections
 
POINT- BIOCHEMISTRY SEM 2 ENZYMES UNIT 5.pptx
POINT- BIOCHEMISTRY SEM 2 ENZYMES UNIT 5.pptxPOINT- BIOCHEMISTRY SEM 2 ENZYMES UNIT 5.pptx
POINT- BIOCHEMISTRY SEM 2 ENZYMES UNIT 5.pptx
 
Organic Name Reactions for the students and aspirants of Chemistry12th.pptx
Organic Name Reactions  for the students and aspirants of Chemistry12th.pptxOrganic Name Reactions  for the students and aspirants of Chemistry12th.pptx
Organic Name Reactions for the students and aspirants of Chemistry12th.pptx
 
Código Creativo y Arte de Software | Unidad 1
Código Creativo y Arte de Software | Unidad 1Código Creativo y Arte de Software | Unidad 1
Código Creativo y Arte de Software | Unidad 1
 
Accessible design: Minimum effort, maximum impact
Accessible design: Minimum effort, maximum impactAccessible design: Minimum effort, maximum impact
Accessible design: Minimum effort, maximum impact
 
Paris 2024 Olympic Geographies - an activity
Paris 2024 Olympic Geographies - an activityParis 2024 Olympic Geographies - an activity
Paris 2024 Olympic Geographies - an activity
 
How to Make a Pirate ship Primary Education.pptx
How to Make a Pirate ship Primary Education.pptxHow to Make a Pirate ship Primary Education.pptx
How to Make a Pirate ship Primary Education.pptx
 
Science 7 - LAND and SEA BREEZE and its Characteristics
Science 7 - LAND and SEA BREEZE and its CharacteristicsScience 7 - LAND and SEA BREEZE and its Characteristics
Science 7 - LAND and SEA BREEZE and its Characteristics
 
The Most Excellent Way | 1 Corinthians 13
The Most Excellent Way | 1 Corinthians 13The Most Excellent Way | 1 Corinthians 13
The Most Excellent Way | 1 Corinthians 13
 
Separation of Lanthanides/ Lanthanides and Actinides
Separation of Lanthanides/ Lanthanides and ActinidesSeparation of Lanthanides/ Lanthanides and Actinides
Separation of Lanthanides/ Lanthanides and Actinides
 
TataKelola dan KamSiber Kecerdasan Buatan v022.pdf
TataKelola dan KamSiber Kecerdasan Buatan v022.pdfTataKelola dan KamSiber Kecerdasan Buatan v022.pdf
TataKelola dan KamSiber Kecerdasan Buatan v022.pdf
 
CARE OF CHILD IN INCUBATOR..........pptx
CARE OF CHILD IN INCUBATOR..........pptxCARE OF CHILD IN INCUBATOR..........pptx
CARE OF CHILD IN INCUBATOR..........pptx
 
Introduction to ArtificiaI Intelligence in Higher Education
Introduction to ArtificiaI Intelligence in Higher EducationIntroduction to ArtificiaI Intelligence in Higher Education
Introduction to ArtificiaI Intelligence in Higher Education
 
SOCIAL AND HISTORICAL CONTEXT - LFTVD.pptx
SOCIAL AND HISTORICAL CONTEXT - LFTVD.pptxSOCIAL AND HISTORICAL CONTEXT - LFTVD.pptx
SOCIAL AND HISTORICAL CONTEXT - LFTVD.pptx
 
Solving Puzzles Benefits Everyone (English).pptx
Solving Puzzles Benefits Everyone (English).pptxSolving Puzzles Benefits Everyone (English).pptx
Solving Puzzles Benefits Everyone (English).pptx
 
Software Engineering Methodologies (overview)
Software Engineering Methodologies (overview)Software Engineering Methodologies (overview)
Software Engineering Methodologies (overview)
 

Uvspectroscopyup 140119003106-phpapp01

  • 1. Ultra-violet visible spectroscopy PRESENTED BY SHAIK IMRAN 14AB1S0406 UNDER THE GUIDANCE OF: CH.DEVADASU M.PHM. DEPARTMENT OF PA &
  • 2.  DEFINITION  UV RADIATION  PRINCIPLE OF UV-VIS SPECTROMETRY  THE ABSORPTION SPECTRUM  TYPES OF TRANSITIONS  ABSORBANCE LAWS  INSTRUMENTATION  EFFECT OF CHROMOPHORE  SOLVENT EFFECTS  APPLICATIONS
  • 3. Ultraviolet and visible (UV-Vis) absorption spectroscopy is the measurement of the attenuation of a beam of light after it passes through a sample or after reflection from a sample surface. Absorption measurements can be at a single wavelength or over an extended spectral range.
  • 4. 1. Detection of functional groups. 2. Detection of impurities 3. Qualitative analysis 4. Quantitative analysis 5. Single compound without chromophore 6. Drugs with chromophoric reagent 7. It helps to show the relationship between different groups, it is useful to detect the conjugation of the compounds
  • 5. The region beyond red is called infra-red while that beyond violet is called as ultra –violet. The wavelength range of uv radiation starts at blue end of visible light(4000A) & ends at 2000A.̊
  • 6.  Ultraviolet absorption spectra arise from transition of electron with in a molecule from a lower level to a higher level.  A molecule absorb ultraviolet radiation of frequency (𝜗), the electron in that molecule undergo transition from lower to higher energy level. The energy can be calculated by the equation, E=h𝜗 erg
  • 7. E₁-E = h𝜗ₒ Etotal=Eelectronic+Evibrotional+Erotational The energies decreases in the following order: Electronic ⪢Vibrational ⪢ Rotational
  • 8. Thus the energy of the radiation in the visible range is generally: 36 to 72 kcal/mole while that in the ultraviolet range goes as high as 143 kcal/mole
  • 9. When a sample is exposed to light energy that matches the energy difference between a possible electronic transition within the molecule, a fraction of the light energy would be absorbed by the molecule and the electrons would be promoted to the higher energy state orbital. A spectrometer records the degree of absorption by a sample at different wavelengths and the resulting plot of absorbance (A) versus wavelength (λ) is known as a spectrum. The significant features:  λmax (wavelength at which there is a maximum absorption)  єmax (The intensity of maximum absorption)
  • 10.
  • 11.  UV-visible spectrum of isoprene showing maximum absorption at 222 nm.
  • 12. Every time a molecule has a bond, the atoms in a bond have their atomic orbitals merged to form molecular orbitals which can be occupied by electrons of different energy levels. Ground state molecular orbitals can be excited to anti-bonding molecular orbitals. These electrons when imparted with energy in the form of light radiation get excited from the highest occupied molecular orbital (HOMO) to the lowest unoccupied molecular orbital (LUMO) and the resulting species is known as the excited state or anti-bonding state.
  • 13. TYPES OF TRANSITIONS: In U.V spectroscopy molecule undergo electronic transition involving σ, π and n electrons.  Four types of electronic transition are possible. i. σ σ* transition⇾ ii. n σ* transition⇾ iii. n π* transition⇾ iv. π π* transition⇾ 13
  • 14.  An electron in a bonding σ orbital of a molecule is excited to the corresponding anti-bonding orbital by the absorption of radiation.  To induce a σ ⇾ σ* transition it required LARGE ENERGY. Ex: Methane  Methane contain only single C-H bonds it undergo only σ ⇾ σ* transition only, it gives absorption maximum at 125nm.
  • 15. In this type saturated compounds containing atoms with unshared electron pairs are undergo n ⇾ σ* transition. It require less energy than the σ ⇾ σ* type. Most of the absorption peaks appearing below 200nm. In the presence of polar solvents the absorption maximum tend to shift shorter wavelength Ex: Water , ethanol.  In this the peaks in U.V region relatively small. Ex: Methlychloride , Oxygen, Nitrogen.
  • 16. Most organic compounds are undergo transitions for n ⇾ π* and π π* transition.⇾  Because energies required for processes bring the absorption peaks into spectral region.  Both transition require the presence of an unsaturated functional group to the ∏ orbitals.´ ´  Ex: For π π* Alkenes, carbonyl⇾ ⧐ compounds, alkynes  For n π* carbonyl compounds.⇾ ⧐
  • 17. σ (bonding) π (bonding) n (non-bonding) σ∗ (anti-bonding) π∗ (anti-bonding) Four types of transitions π→π* n→σ* n→π* σ→σ* E(energy)
  • 18.
  • 19. BEER’S LAW “ The intensity of a beam of monochromatic light decrease exponentially with the increase in concentration of the absorbing substance” . Arithmetically; - dI/ dc Iᾱ I= Io. eˉkc --------------------------eq (1) ABSORBANCE LAWSABSORBANCE LAWS
  • 20. “ When a beam of light is allowed to pass through a transparent medium, the rate of decrease of intensity with the thickness of medium is directly proportional to the intensity of the light” mathematically; -dI/ dt Iᾱ -In . I = kt+b ----------------eq(2) the combination of eq 1 & 2 we will get A= Kct A= ℇct (K=ℇ) LAMBERT’S LAWLAMBERT’S LAW
  • 21.
  • 22.  The real limitation of the beer’s law is successfully in describing the absorption behavior of dilute solution only.  In this regarding it may be considered as a limiting law.  As degree of interaction depends upon the contraction, the occurrence of this phenomenon causes deviations from linear relationship between absorbance and contraction. LIMITATION OF LAWSLIMITATION OF LAWS
  • 23. Components of spectrophotometer  Source  Monochromator  Sample compartment  Detector  Recorder
  • 24. Fig.-block diagram of instrumentation of UV-spectrophotometer
  • 25. Fig.- block diagrammatic representation of UV-spectrophotometer amplifier Read out
  • 26. It is important that the power of the radiation source does not change abruptly over its wavelength range. The electrical excitation of deuterium or hydrogen at low pressure produces a continuous UV spectrum. Both Deuterium and Hydrogen lamps emit radiation in the range 160 - 375 nm. Problem-  Due to evaporation of tungsten life period decreases.  It is overcome by using tungsten-halogen lamp.  Halogen gas prevents evaporation of tungsten.
  • 27. For ultra violet region- Hydrogen discharge lamp  consist of two electrode contain in deuterium filled silica envelop. UV-Vis spectrophotometer have both deuterium & tungsten lamps.  Selection of lamp is made by moving lamp mounting or mirror to cause the light fall on Monochromator. Deuterium lamps:-  Radiation emitted is 3-5 times more than the hydrogen discharge lamps. Xenon discharge lamp:-  Xenon stored under pressure in 10-30 atmosphere.
  • 28. All Monochromators contain the following component parts; • An entrance slit • A collimating lens • A dispersing device (a prism or a grating) • A focusing lens • An exit slit
  • 29.  Filters – a)Glass filters- Made from pieces of colored glass which transmit limited wave length range of spectrum. Wide band width 150nm. b)Gelatin filters- Consist of mixture of dyes placed in gelatin & sandwiched between glass plates. Band width 25nm. c)Inter ferometric filters- Band width 15nm Prisms- -Prism bends the monochromatic light. -Amount of deviation depends on wavelength -They produce non linear dispersion.
  • 31. A variety of sample cells available for UV region. The choice of sample cell is based on a) the path length, shape, size b) the transmission characteristics at the desired wavelength c) the relative expense  The cell holding the sample should be transparent to the wavelength region to be recorded. Quartz or fused silica cuvettes are required for spectroscopy in the UV region. Silicate glasses can be used for the manufacture of cuvettes for use between 350 and 2000nm. The thickness of the cell is generally 1 cm. cells may be rectangular in shape or cylindrical with flat ends.
  • 32.
  • 33. Three common types of detectors are used I. Barrier layer cell II. Photo cell detector III. Photomultiplier , Photo voltaic cells barrier layer cells It consist of flat Cu or Fe electrode on which semiconductor such as selenium is deposited. on the selenium a thin layer of silver or gold is sputtered over the surface.
  • 34.  Photomultiplier tube It is generally used as detector in UV- spectrophotometer It is the combination of photodiode & electron multiplier. It consist of evacuated tube contains photo- cathode. 9-16 electrodes known as dynodes.
  • 35.
  • 36. Advantage of double beam spectrophotometer:- It is not necessary to continually replace the blank with the sample or to adjust the auto zero. The ratio of the powers of the sample & reference is constantly obtained. It has rapid scanning over the wide wavelength region because of the above two factors. samplereferenc e detector I0 I0 I0 I log(I0/I) = A 200 λ, nm monochromator/ beam splitter optics UV-VIS sources
  • 37. Single beam spectrophotometerSingle beam spectrophotometer
  • 39.  Any Functional group which is responsible for impairing colour to the compound is called as chromophore. Ex: NO2 Covalently unsaturated groups responsible for the impairing of the colures. Ex: C=C, C=O  Two types of chromophore a) Independent chromophore b) dependent chromophore
  • 40. 40 Groups λmax C – C 1350 C = C 1900 C = O 1900 2800 O – H 1850 NO2 2800 C6H5( PHENYL) 1950 2500
  • 41. It is the group which itself does not act as a chromophore but when attached to chromophore it shifts the absorption maximum towards longer wavelength along with an increase in intensity of adsorption. Ex: -OH, -NH2, -OR groups For example when the auxochrome –NH2 is attached to the benzene ring, it absorption changes from λmax 255 to 280nm. TYPES Two types a. Bathochromic groups b. Hypsochromic group
  • 42. BATHOCHROMIC GROUPS Those groups which deepen the colour of chromogen are called bathochromic groups. Deepening of colour means displacement to longer wavelength. yellow orange red purple⇾ ⇾ ⇾ ⇾ violet blue green⇾ ⇾
  • 43. Those groups which diminish or lighten the colour of the chromogen are called hypsochromic groups.  They cause displacement to shorter wavelength. Ex:- acetylation of –OH or –NH2 groups, -OCOCH3 and – NHCOCH3 200 nm 700 nm ε Hypochromic Hypsochromic Hyperchromic Bathochromic
  • 44. SOLVENT EFFECTS - INTENSITYSOLVENT EFFECTS - INTENSITY Solvents can induce significant changes in the intensity of peaks. Hyperchromic – Increase in absorption intensity. Hypochromic – Decrease in absorption intensity. Solvent λmax εmax Hexane 260 2000 Chloroform 263 4500 Ethanol 260 4000 Water 260 4000 Ethanol - HCl (1:1) 262 5200 Absorption characteristics of 2-methylpyridine
  • 45.  π -> π* transitions leads to more polar excited state that is more easily stabilized by polar solvent associations (H-bonds). The π* state is more polar and stabilized more in polar solvent relative to nonpolar one, thus in going from nonpolar to polar solvent there is a red shift or bathochromic shift (increase in λmax , decrease in ΔE).  For n -> π* transition, the n state is much more easily stabilized by polar solvent effects (H-bonds and association), so in going from nonpolar to polar solvent there is a blue shift or hypsochromic shift (decrease in λmax , increase in ΔE).
  • 46. APPLICATIONS: A. APPLICATIONS IN ORGANIC COMPOUNDS 1.It is helps to show the relationship between different groups, it is useful to detect the conjugation of the compounds 2.Detection of geometrical isomers, In case of geometrical isomers compounds, that trans isomers exhibits λmax at slightly longer wavelength and have larger extinction coefficient then the cis isomers . 3.Detection of functional groups, it is possible to detect the presence of certain functional groups with the help of UV Spectrum. GENERAL APPLICATIONS: 1.Qualitative analysis, UV absorption spectroscopy can characterizes those type of compounds which absorb UV radiation. Identification is done by comparing the absorption spectrum with the spectra of known compound. 2. It is useful in Quantitative analysis of the compounds. 3. Detection of impurities, UV absorption spectroscopy is the one of the best method for detecting impurities in organic compounds.
  • 47. Tautomeric equilibrium, UV spectroscopy can be used to determine the percentage of various keto and enol forms present in tautomeric equilibrium. 5. Chemical kinetics, UV spectroscopy can be used to study the kinetics of reactions. 6. Molecular weight determination, molecular weights of compounds can be measured by spectroscopy. 7. Analysis of inorganic compounds. 8. Measuring concentration of solution, absorption band can also used to determine the concentration of compounds in a solution. 9. Inorganic chemistry, absorption spectra have been used in connection with many problems in inorganic chemistry. 10. It is useful to determine the structure of the chloral.
  • 48. QUALITATIVE ANALYSIS Pharmacopoeial identification of drug (1) By using absorbance & wavelength (2) By taking absorption ratio (3) Limit test (b)Structural analysis Quantitative analysis Quantitative analysis A)By using beer’s law and using absorptivity value By using reference standard Multiple standard method B)Single compound analysis direct analysis Using separation method After extraction after chromatographic separation Using column chromatography Using HPLC Indirect analysis a)Single compound without chromophore b) Drugs with chromophoric reagent 1.For analyte which absorb weakly in UV region 2.For avoiding interference
  • 49. 3.Improve selectivity of assay  4. Determination of composition of complex Mole ratio method Continuous variation method ( job curve method ) 5 . Study of kinetics Disadvantages:  Samples should be in solution. Mixture of substances poses difficult to analyse and requires prior separation. Interference from the sample’s matrix makes the measurement difficult .