Downloaded 292 times


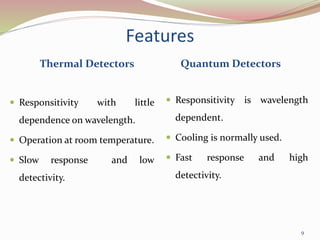


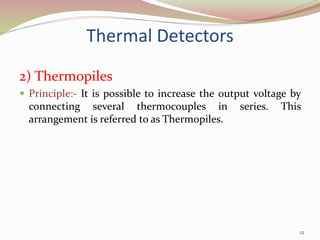


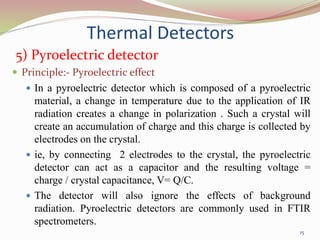
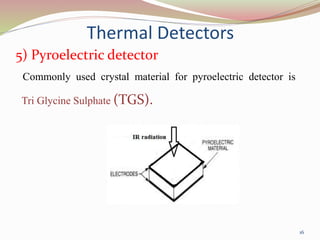


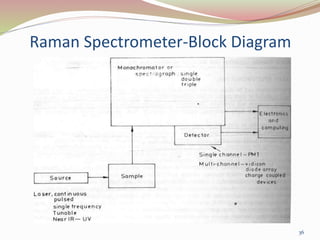


The document describes the components and working of infrared (IR) spectrometers and Fourier transform infrared (FTIR) spectrometers. It discusses various IR sources like the Nernst glower, Globar, and tungsten filament lamp. It also describes optical components like entrance and exit slits, and detectors like thermal detectors and quantum detectors. The key advantages of FTIR spectrometers are provided, including higher resolution and throughput compared to dispersive instruments. Applications of IR and Raman spectroscopy in areas like drug analysis, fiber analysis, and biological analysis are also mentioned.


![FOURIER -TRANSFORM INFRARED SPECTROMETER [FTIR]](https://cdn.slidesharecdn.com/ss_thumbnails/ftir-160604063055-thumbnail.jpg?width=640&height=640&fit=bounds)