
Downloaded 182 times
![Here’s the spectrum for ethene. [In this case the wavelength is plotted
versus transmittance, the inverse of absorbance (high absorbance = low transmittance,
and vice versa). ]
Note that the wavelength of maximum transmittance is at 174 nm. We call
this λmax , pronounced “lambda max”. Very little light passes through the sample at this
wavelength, because the wavelength corresponds very closely to ΔE for the π to π*
transition.](https://image.slidesharecdn.com/uvspectroscopy-180518043930/85/Uv-spectroscopy-9-320.jpg)
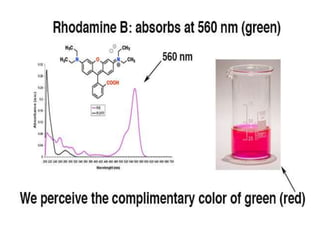
![How Does λmax Relate To The Color We
Perceive?
How does the wavelength of maximum absorbance (λmax)
relate to the actual color?
First, a refresher from the last post. We see the
complementary colour of the major color that is
absorbed. A molecule that absorbs in the blue will
appear orange, because we perceive the colors that
are reflected, and orange is the complementary color of
blue.
For example, this molecule, Rhodamine B [note 2] absorbs
at about 560 nm (green) and appears red , the
complimentary color of green.](https://image.slidesharecdn.com/uvspectroscopy-180518043930/85/Uv-spectroscopy-15-320.jpg)
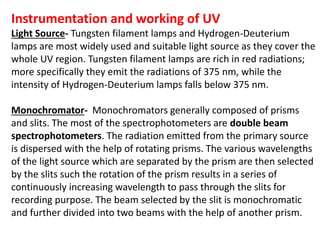
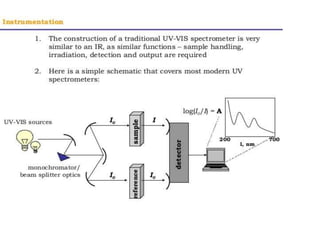
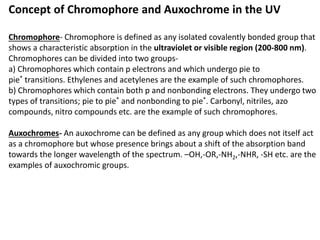
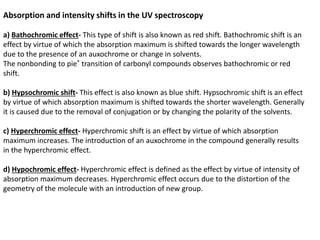
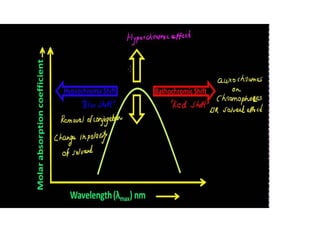
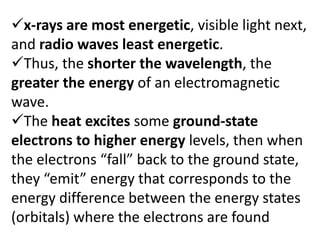
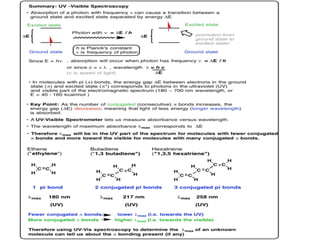
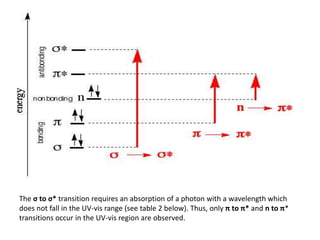
This document provides an overview of UV-Visible spectroscopy. Some key points: - UV-Vis spectroscopy involves promoting electrons from the ground state to excited states using electromagnetic radiation in the ultraviolet and visible regions. - Different types of electronic transitions are possible including π-π*, n-π*, and σ-σ* transitions. The π-π* and n-π* transitions fall within the UV-Vis range. - The wavelength of maximum absorbance (λmax) provides information about the energy gap between orbitals. Conjugated systems have longer λmax values and smaller energy gaps. - Instruments use light sources, monochromators, sample and reference cells, and


![UV SPECTROSCOPY [ULTRA-VIOLET SPECTROSCOPY]](https://cdn.slidesharecdn.com/ss_thumbnails/40-191218142647-thumbnail.jpg?width=640&height=640&fit=bounds)


![CASE_PRESENTATION_ON_subdural_hematoma(SDH)[1 FINAL PPT]-1.pptx](https://cdn.slidesharecdn.com/ss_thumbnails/casepresentationonsubduralhematomasdh1finalppt-1-260129172522-d405d375-thumbnail.jpg?width=640&height=640&fit=bounds)


