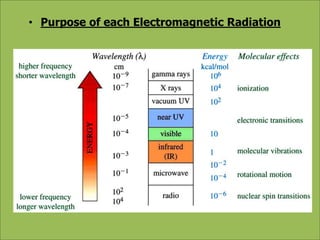
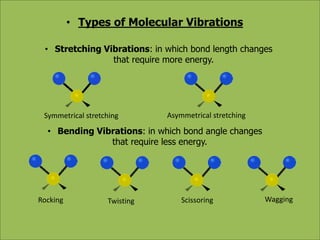
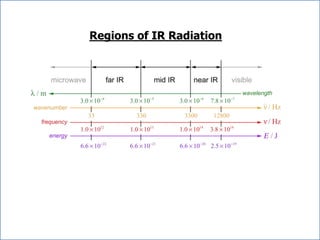
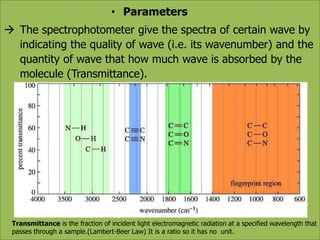
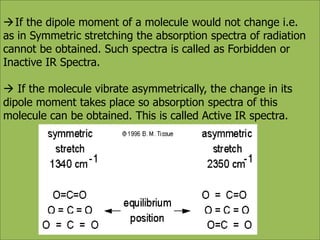
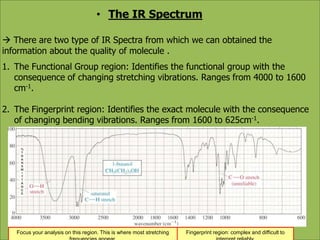
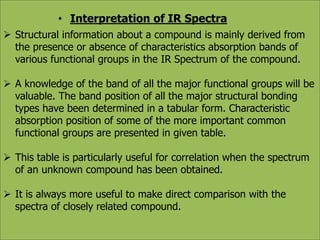
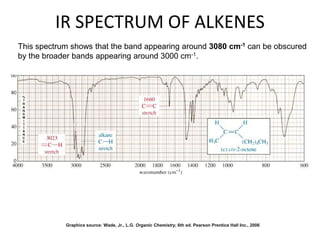
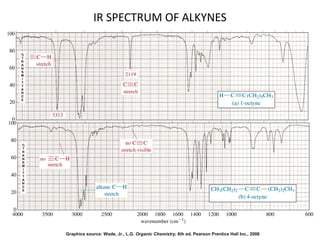
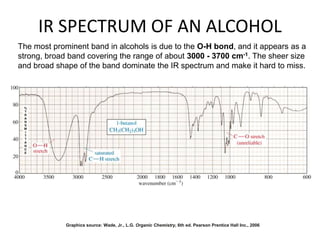
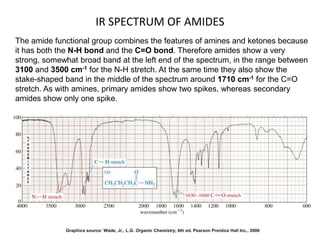
SlideShare a Scribd company logo
1 of 34
INFRARED SPERCTROSCOPY 
STRUCTURE DETERMINATION OF ORGANIC 
COMPOUNDS THROUGH IR SPECTROSCOPY 
By: S. YOUSUF RAZA ZAIDI 
RESEARCH COMPLEX 
ALLAMA IQBAL OPEN UNIVERSITY 
ISLAMABAD, PAKISTAN
Structure Determination of Organic 
Compounds through Infrared Spectroscopy 
Outline 
 Electromagnetic radiation. 
 Purpose of each electromagnetic radiation. 
 Types of Vibrations. 
 Introduction to IR Spectroscopy. 
 IR region (Far, Middle & Near). 
 Requirement of molecule i.e. it must change dipole. 
 Regions of IR Spectra i.e. fingerprint & functional group 
 Interpretation of IR Spectra 
 Hooke’s law 
Presented By: 
Syed Yousuf Raza Zaidi
• Electromagnetic Radiation 
The source from where we get the light is Sun or Sunlight. 
Sunlight is a form of the electromagnetic radiation given off 
by the Sun. 
Radiation from the Sun, which is more popularly known as 
sunlight, is a mixture of electromagnetic waves ranging from 
Broadcast waves, Radio, Microwave, Infrared (IR), 
Ultraviolet rays (UV), Visible region, Gamma rays and Cosmic 
rays.
Electromagnetic radiation (EM radiation or EMR) is a 
form of radiant energy, propagating through space via 
electromagnetic waves and/or particles called photons coming 
from the sun.
SUN
• Purpose of each Electromagnetic Radiation
• Types of Molecular Vibrations 
• Stretching Vibrations: in which bond length changes 
that require more energy. 
Symmetrical stretching Asymmetrical stretching 
• Bending Vibrations: in which bond angle changes 
that require less energy. 
Rocking Twisting Scissoring Wagging
• Spectroscopy 
Spectroscopy is the study of the interaction 
between matter and radiated energy or radiation. 
• Infrared Spectroscopy 
Infrared Spectroscopy (IR spectroscopy) is 
the spectroscopy that deals with the interaction of only 
infrared region of the electromagnetic spectrum with 
the matter.
Regions of IR Radiation
 IR Spectroscopy is a qualitative analytical technique that 
helps to indicate mainly the functional group of a molecule. 
 When the IR radiation irradiated to the molecule the part of 
molecule which is functional absorbs it, as a result of this 
absorbance the molecular vibration increases. 
 After the excitation of molecular vibration, these molecules 
comes back to their original state by releasing that energy 
of certain wave number which is recorded as transmittance 
on the spectrophotometer.
• Parameters 
 The spectrophotometer give the spectra of certain wave by 
indicating the quality of wave (i.e. its wavenumber) and the 
quantity of wave that how much wave is absorbed by the 
molecule (Transmittance). 
Transmittance is the fraction of incident light electromagnetic radiation at a specified wavelength that 
passes through a sample.(Lambert-Beer Law) It is a ratio so it has no unit.
 IR light or electromagnetic radiation is actually thermal 
radiation. Its means that all of the heat which feel to us or 
coming into the earth from sun is nothing but IR radiation. 
 IR is low energy, low frequency and long wavelength 
radiation with low wave number that can only cause an 
increase in molecular vibrations (i.e. stretching & bending). 
 So by triggering molecular vibrations through irradiation 
with infrared light provides mostly information about the 
presence or absence of certain functional groups.
• Requirement of molecule 
In order to absorb the electromagnetic radiation for a molecule 
the frequency of the incident radiation matches the natural 
frequency of the vibration, the IR photon is absorbed and the 
amplitude of the vibration increases. 
The dipole moment of the molecule must change as a result of 
a molecular vibration. The change in the dipole moment allows 
interaction with the alternating electrical component of the IR 
radiation wave. Symmetric molecules (or bonds) do not absorb 
IR radiation since there is no dipole moment.
If the dipole moment of a molecule would not change i.e. 
as in Symmetric stretching the absorption spectra of radiation 
cannot be obtained. Such spectra is called as Forbidden or 
Inactive IR Spectra. 
 If the molecule vibrate asymmetrically, the change in its 
dipole moment takes place so absorption spectra of this 
molecule can be obtained. This is called Active IR spectra.
• The IR Spectrum 
 There are two type of IR Spectra from which we can obtained the 
information about the quality of molecule . 
1. The Functional Group region: Identifies the functional group with the 
consequence of changing stretching vibrations. Ranges from 4000 to 1600 
cm-1. 
2. The Fingerprint region: Identifies the exact molecule with the consequence 
of changing bending vibrations. Ranges from 1600 to 625cm-1. 
Focus your analysis on this region. This is where most stretching 
frequencies appear. 
Fingerprint region: complex and difficult to 
interpret reliably.
• Interpretation of IR Spectra 
 Structural information about a compound is mainly derived from 
the presence or absence of characteristics absorption bands of 
various functional groups in the IR Spectrum of the compound. 
 A knowledge of the band of all the major functional groups will be 
valuable. The band position of all the major structural bonding 
types have been determined in a tabular form. Characteristic 
absorption position of some of the more important common 
functional groups are presented in given table. 
 This table is particularly useful for correlation when the spectrum 
of an unknown compound has been obtained. 
 It is always more useful to make direct comparison with the 
spectra of closely related compound.
s=strong, m=medium, w=weak, v=variable.
We can also calculate an approximate value of the 
stretching vibrational frequency of a bond by treating 
the two atoms and their connecting bond, to first 
approximation, as two balls connected by a spring, 
acting as a simple harmonic oscillator for which the 
Hooke’s Law may be applied. 
According to Hooke’s Law , The Stretching frequency 
is related to the masses of the atom and the force 
constant(a measure of resistance of a bond to 
stretching) of a bond by the following equation
• Hooke’s Law
FUNCTIONAL GROUPS AND IR 
TABLES 
The remainder of this presentation will be focused on the IR 
identification of various functional groups such as alkenes, alcohols, 
ketones, carboxylic acids, etc. Basic knowledge of the structures and 
polarities of these groups is assumed. If you need a refresher please 
turn to your organic chemistry textbook. The inside cover of the Wade 
textbook has a table of functional groups, and they are discussed in 
detail in ch. 2, pages 68 – 74 of the 6th edition. 
A table relating IR frequencies to specific covalent bonds can be 
found on p. 851 of your laboratory textbook. Pages 852 – 866 contain 
a more detailed discussion of each type of bond, much like the 
discussion in this presentation.
IR SPECTRUM OF ALKANES 
Alkanes have no functional groups. Their IR spectrum displays only C-C and C-H 
bond vibrations. Of these the most useful are the C-H bands, which appear 
around 3000 cm-1. Since most organic molecules have such bonds, most organic 
molecules will display those bands in their spectrum. 
Graphics source: Wade, Jr., L.G. Organic Chemistry, 5th ed. Pearson Education Inc., 2003
IR SPECTRUM OF ALKENES 
Besides the presence of C-H bonds, alkenes also show sharp, medium bands 
corresponding to the C=C bond stretching vibration at about 1600-1700 cm-1. 
Some alkenes might also show a band for the =C-H bond stretch, appearing 
around 3080 cm-1 as shown below. However, this band could be obscured by the 
broader bands appearing around 3000 cm-1 (see next slide) 
Graphics source: Wade, Jr., L.G. Organic Chemistry, 5th ed. Pearson Education Inc., 2003
IR SPECTRUM OF ALKENES 
This spectrum shows that the band appearing around 3080 cm-1 can be obscured 
by the broader bands appearing around 3000 cm-1. 
Graphics source: Wade, Jr., L.G. Organic Chemistry, 6th ed. Pearson Prentice Hall Inc., 2006
IR SPECTRUM OF ALKYNES 
The most prominent band in alkynes corresponds to the carbon-carbon 
triple bond. It shows as a sharp, weak band at about 2100 cm-1. The 
reason it’s weak is because the triple bond is not very polar. In some 
cases, such as in highly symmetrical alkynes, it may not show at all due to 
the low polarity of the triple bond associated with those alkynes. 
Terminal alkynes, that is to say those where the triple bond is at the end of 
a carbon chain, have C-H bonds involving the sp carbon (the carbon that 
forms part of the triple bond). Therefore they may also show a sharp, weak 
band at about 3300 cm-1 corresponding to the C-H stretch. 
Internal alkynes, that is those where the triple bond is in the middle of a 
carbon chain, do not have C-H bonds to the sp carbon and therefore lack 
the aforementioned band. 
The following slide shows a comparison between an unsymmetrical 
terminal alkyne (1-octyne) and a symmetrical internal alkyne (4-octyne).
IR SPECTRUM OF ALKYNES 
Graphics source: Wade, Jr., L.G. Organic Chemistry, 6th ed. Pearson Prentice Hall Inc., 2006
IR SPECTRUM OF A NITRILE 
In a manner very similar to alkynes, nitriles show a prominent band around 2250 
cm-1 caused by the CN triple bond. This band has a sharp, pointed shape just 
like the alkyne C-C triple bond, but because the CN triple bond is more polar, this 
band is stronger than in alkynes. 
Graphics source: Wade, Jr., L.G. Organic Chemistry, 6th ed. Pearson Prentice Hall Inc., 2006
IR SPECTRUM OF AN ALCOHOL 
The most prominent band in alcohols is due to the O-H bond, and it appears as a 
strong, broad band covering the range of about 3000 - 3700 cm-1. The sheer size 
and broad shape of the band dominate the IR spectrum and make it hard to miss. 
Graphics source: Wade, Jr., L.G. Organic Chemistry, 6th ed. Pearson Prentice Hall Inc., 2006
IR SPECTRUM OF ALDEHYDES AND KETONES 
Carbonyl compounds are those that contain the C=O functional group. In 
aldehydes, this group is at the end of a carbon chain, whereas in ketones it’s in 
the middle of the chain. As a result, the carbon in the C=O bond of aldehydes is 
also bonded to another carbon and a hydrogen, whereas the same carbon in a 
ketone is bonded to two other carbons. 
Aldehydes and ketones show a strong, prominent, stake-shaped band around 
1710 - 1720 cm-1 (right in the middle of the spectrum). This band is due to the 
highly polar C=O bond. Because of its position, shape, and size, it is hard to 
miss. 
Because aldehydes also contain a C-H bond to the sp2 carbon of the C=O bond, 
they also show a pair of medium strength bands positioned about 2700 and 2800 
cm-1. These bands are missing in the spectrum of a ketone because the sp2 
carbon of the ketone lacks the C-H bond. 
The following slide shows a spectrum of an aldehyde and a ketone. Study the 
similarities and the differences so that you can distinguish between the two.
IR SPECTRUM OF ALDEHYDES AND KETONES 
Graphics source: Wade, Jr., L.G. Organic Chemistry, 6th ed. Pearson Prentice Hall Inc., 2006
IR SPECTRUM OF A CARBOXYLIC 
ACID A carboxylic acid functional group combines the features of alcohols and ketones 
because it has both the O-H bond and the C=O bond. Therefore carboxylic acids 
show a very strong and broad band covering a wide range between 2800 and 
3500 cm-1 for the O-H stretch. At the same time they also show the stake-shaped 
band in the middle of the spectrum around 1710 cm-1 corresponding to the C=O 
stretch. 
Graphics source: Wade, Jr., L.G. Organic Chemistry, 6th ed. Pearson Prentice Hall Inc., 2006
IR SPECTRA OF AMINES 
The most characteristic band in amines is due to the N-H bond stretch, and it appears as a 
weak to medium, somewhat broad band (but not as broad as the O-H band of alcohols). This 
band is positioned at the left end of the spectrum, in the range of about 3200 - 3600 cm-1. 
Primary amines have two N-H bonds, therefore they typically show two spikes that make this 
band resemble a molar tooth. Secondary amines have only one N-H bond, which makes 
them show only one spike, resembling a canine tooth. Finally, tertiary amines have no N-H 
bonds, and therefore this band is absent from the IR spectrum altogether. The spectrum 
below shows a secondary amine. 
Graphics source: Wade, Jr., L.G. Organic Chemistry, 6th ed. Pearson Prentice Hall Inc., 2006
IR SPECTRUM OF AMIDES 
The amide functional group combines the features of amines and ketones because 
it has both the N-H bond and the C=O bond. Therefore amides show a very 
strong, somewhat broad band at the left end of the spectrum, in the range between 
3100 and 3500 cm-1 for the N-H stretch. At the same time they also show the 
stake-shaped band in the middle of the spectrum around 1710 cm-1 for the C=O 
stretch. As with amines, primary amides show two spikes, whereas secondary 
amides show only one spike. 
Graphics source: Wade, Jr., L.G. Organic Chemistry, 6th ed. Pearson Prentice Hall Inc., 2006
References 
http://www.utdallas.edu/~biewerm/12IR.pdf 
http://www.chem.ucla.edu/~webspectra/irtable.html 
http://en.wikipedia.org/wiki/Infrared_spectroscopy 
http://orgchem.colorado.edu/Spectroscopy/irtutor/IRtheory. 
pdf 
http://chemwiki.ucdavis.edu/Organic_Chemistry/Organic_Ch 
emistry_With_a_Biological_Emphasis/Chapter__4%3A_Struct 
ure_Determination_I/Section_4.2%3A__Infrared_spectroscop 
y

More Related Content

What's hot

Infrared spectroscopy
Infrared spectroscopyInfrared spectroscopy
Infrared spectroscopyAsma Ashraf
 
13 C NMR Spectroscopy by Dr Anthony Melvin Crasto
13 C NMR Spectroscopy by Dr Anthony Melvin Crasto13 C NMR Spectroscopy by Dr Anthony Melvin Crasto
13 C NMR Spectroscopy by Dr Anthony Melvin CrastoAnthony Melvin Crasto Ph.D
 
PRINCIPLES of FT-NMR & 13C NMR
PRINCIPLES of FT-NMR & 13C NMRPRINCIPLES of FT-NMR & 13C NMR
PRINCIPLES of FT-NMR & 13C NMRAditya Sharma
 
Overtone & fermi resonance in IR
Overtone & fermi resonance in IROvertone & fermi resonance in IR
Overtone & fermi resonance in IRMahgull Syed
 
Nuclear magnetic resonance (NMR) spectroscopy
Nuclear magnetic resonance (NMR) spectroscopyNuclear magnetic resonance (NMR) spectroscopy
Nuclear magnetic resonance (NMR) spectroscopyVK VIKRAM VARMA
 
Relaxation in NMR
Relaxation in NMR Relaxation in NMR
Relaxation in NMR RM42
 
NMR spectroscopy- Spin-lattice & spin-spin relaxation, signal splitting & sig...
NMR spectroscopy- Spin-lattice & spin-spin relaxation, signal splitting & sig...NMR spectroscopy- Spin-lattice & spin-spin relaxation, signal splitting & sig...
NMR spectroscopy- Spin-lattice & spin-spin relaxation, signal splitting & sig...AYESHA NAZEER
 
Introduction and Principle of IR spectroscopy
Introduction and Principle of IR spectroscopyIntroduction and Principle of IR spectroscopy
Introduction and Principle of IR spectroscopyRajaram Kshetri
 
Nmr spectroscopy
Nmr spectroscopyNmr spectroscopy
Nmr spectroscopyAsma Ashraf
 
Spin spin splitting (n+1 Rule) NMR spectroscopy
Spin spin splitting (n+1 Rule) NMR spectroscopySpin spin splitting (n+1 Rule) NMR spectroscopy
Spin spin splitting (n+1 Rule) NMR spectroscopyHumnaMehmood
 

What's hot (20)

FT NMR
FT NMRFT NMR
FT NMR
 
Infrared spectroscopy
Infrared spectroscopyInfrared spectroscopy
Infrared spectroscopy
 
13 C NMR Spectroscopy by Dr Anthony Melvin Crasto
13 C NMR Spectroscopy by Dr Anthony Melvin Crasto13 C NMR Spectroscopy by Dr Anthony Melvin Crasto
13 C NMR Spectroscopy by Dr Anthony Melvin Crasto
 
Ir spectroscopy ppt
Ir spectroscopy pptIr spectroscopy ppt
Ir spectroscopy ppt
 
Two dimensional nmr
Two dimensional nmrTwo dimensional nmr
Two dimensional nmr
 
Nmr 2
Nmr 2Nmr 2
Nmr 2
 
PRINCIPLES of FT-NMR & 13C NMR
PRINCIPLES of FT-NMR & 13C NMRPRINCIPLES of FT-NMR & 13C NMR
PRINCIPLES of FT-NMR & 13C NMR
 
Overtone & fermi resonance in IR
Overtone & fermi resonance in IROvertone & fermi resonance in IR
Overtone & fermi resonance in IR
 
Mass Spectroscopy
Mass Spectroscopy Mass Spectroscopy
Mass Spectroscopy
 
Nuclear magnetic resonance (NMR) spectroscopy
Nuclear magnetic resonance (NMR) spectroscopyNuclear magnetic resonance (NMR) spectroscopy
Nuclear magnetic resonance (NMR) spectroscopy
 
Relaxation in NMR
Relaxation in NMR Relaxation in NMR
Relaxation in NMR
 
NMR spectroscopy- Spin-lattice & spin-spin relaxation, signal splitting & sig...
NMR spectroscopy- Spin-lattice & spin-spin relaxation, signal splitting & sig...NMR spectroscopy- Spin-lattice & spin-spin relaxation, signal splitting & sig...
NMR spectroscopy- Spin-lattice & spin-spin relaxation, signal splitting & sig...
 
Nmr instrumentation
Nmr  instrumentationNmr  instrumentation
Nmr instrumentation
 
Introduction and Principle of IR spectroscopy
Introduction and Principle of IR spectroscopyIntroduction and Principle of IR spectroscopy
Introduction and Principle of IR spectroscopy
 
Double resonance
Double resonanceDouble resonance
Double resonance
 
Noesy [autosaved]
Noesy [autosaved]Noesy [autosaved]
Noesy [autosaved]
 
NMR applications
NMR applicationsNMR applications
NMR applications
 
Nmr spectroscopy
Nmr spectroscopyNmr spectroscopy
Nmr spectroscopy
 
Spin spin splitting (n+1 Rule) NMR spectroscopy
Spin spin splitting (n+1 Rule) NMR spectroscopySpin spin splitting (n+1 Rule) NMR spectroscopy
Spin spin splitting (n+1 Rule) NMR spectroscopy
 
Fourier-Transform Nuclear Magnetic Resonance Instrumentation (FT-NMR).
Fourier-Transform Nuclear Magnetic Resonance Instrumentation (FT-NMR).Fourier-Transform Nuclear Magnetic Resonance Instrumentation (FT-NMR).
Fourier-Transform Nuclear Magnetic Resonance Instrumentation (FT-NMR).
 

Viewers also liked

Infrared spectroscopy
Infrared spectroscopyInfrared spectroscopy
Infrared spectroscopyNida Ashraf
 
Basics of infrared spectroscopy
Basics of infrared spectroscopyBasics of infrared spectroscopy
Basics of infrared spectroscopyNijas Mohamed
 
Sampling of solids in IR spectroscopy
Sampling of solids in IR spectroscopySampling of solids in IR spectroscopy
Sampling of solids in IR spectroscopyManoj Kumar Tekuri
 
Applications of IR (Infrared) Spectroscopy in Pharmaceutical Industry
Applications of IR (Infrared) Spectroscopy in Pharmaceutical IndustryApplications of IR (Infrared) Spectroscopy in Pharmaceutical Industry
Applications of IR (Infrared) Spectroscopy in Pharmaceutical Industrywonderingsoul114
 
I R spectroscopy & its application
I R spectroscopy & its application I R spectroscopy & its application
I R spectroscopy & its application Amit Agnihotri
 
Infrared presentation
Infrared presentationInfrared presentation
Infrared presentationShiv Kumar
 
Factors affecting vibrational frequencies in IR
Factors affecting vibrational frequencies in IRFactors affecting vibrational frequencies in IR
Factors affecting vibrational frequencies in IRRashmi Raveendran
 
2D NMR ORGANIC SPECTROSCOPY by DR ANTHONY CRASTO
2D NMR ORGANIC SPECTROSCOPY by DR ANTHONY CRASTO2D NMR ORGANIC SPECTROSCOPY by DR ANTHONY CRASTO
2D NMR ORGANIC SPECTROSCOPY by DR ANTHONY CRASTOAnthony Melvin Crasto Ph.D
 
Nephlerometry and turbidimetry
Nephlerometry and turbidimetryNephlerometry and turbidimetry
Nephlerometry and turbidimetryBasil "Lexi" Bruno
 
Nephlometry & turbidimetry
Nephlometry &  turbidimetryNephlometry &  turbidimetry
Nephlometry & turbidimetryshaisejacob
 
Uv visible spectroscopy ppt
Uv visible spectroscopy pptUv visible spectroscopy ppt
Uv visible spectroscopy pptAlexa Jacob
 
UV Spectroscopy Introduction
UV Spectroscopy IntroductionUV Spectroscopy Introduction
UV Spectroscopy IntroductionBhakti Desai
 
Visible and ultraviolet spectroscopy
Visible and ultraviolet spectroscopyVisible and ultraviolet spectroscopy
Visible and ultraviolet spectroscopyRawat DA Greatt
 
advantages n limitations of quantitative ir spectroscopy
advantages n limitations of quantitative ir spectroscopyadvantages n limitations of quantitative ir spectroscopy
advantages n limitations of quantitative ir spectroscopyAnzar Sk
 
UV-visible spectroscopy
UV-visible spectroscopyUV-visible spectroscopy
UV-visible spectroscopyaaaaalok
 
Uv spectroscopy
Uv spectroscopy Uv spectroscopy
Uv spectroscopy Rokon khan
 
Ultraviolet spectroscopy (UV)
Ultraviolet spectroscopy (UV)Ultraviolet spectroscopy (UV)
Ultraviolet spectroscopy (UV)Mona Ismail
 
SEMINAR ON UV SPECTROSCOPY
SEMINAR ON UV SPECTROSCOPYSEMINAR ON UV SPECTROSCOPY
SEMINAR ON UV SPECTROSCOPYNITIN KANWALE
 
Introduction and applications of FT- IR spectroscopy
Introduction and applications of FT- IR spectroscopyIntroduction and applications of FT- IR spectroscopy
Introduction and applications of FT- IR spectroscopyKANDASAMY K
 

Viewers also liked (20)

Infrared spectroscopy
Infrared spectroscopyInfrared spectroscopy
Infrared spectroscopy
 
Basics of infrared spectroscopy
Basics of infrared spectroscopyBasics of infrared spectroscopy
Basics of infrared spectroscopy
 
Sampling of solids in IR spectroscopy
Sampling of solids in IR spectroscopySampling of solids in IR spectroscopy
Sampling of solids in IR spectroscopy
 
Applications of IR (Infrared) Spectroscopy in Pharmaceutical Industry
Applications of IR (Infrared) Spectroscopy in Pharmaceutical IndustryApplications of IR (Infrared) Spectroscopy in Pharmaceutical Industry
Applications of IR (Infrared) Spectroscopy in Pharmaceutical Industry
 
Application of ir
Application of irApplication of ir
Application of ir
 
I R spectroscopy & its application
I R spectroscopy & its application I R spectroscopy & its application
I R spectroscopy & its application
 
Infrared presentation
Infrared presentationInfrared presentation
Infrared presentation
 
Factors affecting vibrational frequencies in IR
Factors affecting vibrational frequencies in IRFactors affecting vibrational frequencies in IR
Factors affecting vibrational frequencies in IR
 
2D NMR ORGANIC SPECTROSCOPY by DR ANTHONY CRASTO
2D NMR ORGANIC SPECTROSCOPY by DR ANTHONY CRASTO2D NMR ORGANIC SPECTROSCOPY by DR ANTHONY CRASTO
2D NMR ORGANIC SPECTROSCOPY by DR ANTHONY CRASTO
 
Nephlerometry and turbidimetry
Nephlerometry and turbidimetryNephlerometry and turbidimetry
Nephlerometry and turbidimetry
 
Nephlometry & turbidimetry
Nephlometry &  turbidimetryNephlometry &  turbidimetry
Nephlometry & turbidimetry
 
Uv visible spectroscopy ppt
Uv visible spectroscopy pptUv visible spectroscopy ppt
Uv visible spectroscopy ppt
 
UV Spectroscopy Introduction
UV Spectroscopy IntroductionUV Spectroscopy Introduction
UV Spectroscopy Introduction
 
Visible and ultraviolet spectroscopy
Visible and ultraviolet spectroscopyVisible and ultraviolet spectroscopy
Visible and ultraviolet spectroscopy
 
advantages n limitations of quantitative ir spectroscopy
advantages n limitations of quantitative ir spectroscopyadvantages n limitations of quantitative ir spectroscopy
advantages n limitations of quantitative ir spectroscopy
 
UV-visible spectroscopy
UV-visible spectroscopyUV-visible spectroscopy
UV-visible spectroscopy
 
Uv spectroscopy
Uv spectroscopy Uv spectroscopy
Uv spectroscopy
 
Ultraviolet spectroscopy (UV)
Ultraviolet spectroscopy (UV)Ultraviolet spectroscopy (UV)
Ultraviolet spectroscopy (UV)
 
SEMINAR ON UV SPECTROSCOPY
SEMINAR ON UV SPECTROSCOPYSEMINAR ON UV SPECTROSCOPY
SEMINAR ON UV SPECTROSCOPY
 
Introduction and applications of FT- IR spectroscopy
Introduction and applications of FT- IR spectroscopyIntroduction and applications of FT- IR spectroscopy
Introduction and applications of FT- IR spectroscopy
 

Similar to IR SPECTROSCOPY

Similar to IR SPECTROSCOPY (20)

Infrared spectroscopy
Infrared spectroscopyInfrared spectroscopy
Infrared spectroscopy
 
Ir spectroscopy
Ir spectroscopyIr spectroscopy
Ir spectroscopy
 
IR Spectroscopy.pptx
IR Spectroscopy.pptxIR Spectroscopy.pptx
IR Spectroscopy.pptx
 
Theory of IR spectroscopy
Theory of IR spectroscopyTheory of IR spectroscopy
Theory of IR spectroscopy
 
Sna spectroscopy infrared spectroscopy
Sna spectroscopy infrared spectroscopySna spectroscopy infrared spectroscopy
Sna spectroscopy infrared spectroscopy
 
infrared_spectroscopy
infrared_spectroscopyinfrared_spectroscopy
infrared_spectroscopy
 
2.ir jntu pharmacy
2.ir jntu pharmacy2.ir jntu pharmacy
2.ir jntu pharmacy
 
Infrared Spectroscopy (IR)
Infrared Spectroscopy (IR)Infrared Spectroscopy (IR)
Infrared Spectroscopy (IR)
 
IR Spectroscopy_2022.pptx
IR Spectroscopy_2022.pptxIR Spectroscopy_2022.pptx
IR Spectroscopy_2022.pptx
 
1.IR.pptx
1.IR.pptx1.IR.pptx
1.IR.pptx
 
Infrared (IR) Spectroscopy
Infrared (IR) SpectroscopyInfrared (IR) Spectroscopy
Infrared (IR) Spectroscopy
 
Ir spectroscopy slide
Ir spectroscopy slideIr spectroscopy slide
Ir spectroscopy slide
 
12 02-09-12-24-23-1390-sampathkumar
12 02-09-12-24-23-1390-sampathkumar12 02-09-12-24-23-1390-sampathkumar
12 02-09-12-24-23-1390-sampathkumar
 
Ir spectroscopy slide
Ir spectroscopy slideIr spectroscopy slide
Ir spectroscopy slide
 
IR Spectra Interpretation
IR Spectra InterpretationIR Spectra Interpretation
IR Spectra Interpretation
 
Ir spectroscopy
Ir spectroscopyIr spectroscopy
Ir spectroscopy
 
Field Ion - Infrared- Raman Spectroscopy
Field Ion - Infrared- Raman SpectroscopyField Ion - Infrared- Raman Spectroscopy
Field Ion - Infrared- Raman Spectroscopy
 
Basics of Infrared Spectroscopy : Theory, principles and applications
Basics of Infrared Spectroscopy : Theory, principles and applicationsBasics of Infrared Spectroscopy : Theory, principles and applications
Basics of Infrared Spectroscopy : Theory, principles and applications
 
Chapter 8-Spectroscopy.pptx
Chapter 8-Spectroscopy.pptxChapter 8-Spectroscopy.pptx
Chapter 8-Spectroscopy.pptx
 
IR SPECTROSCOPY 23.02.17
IR SPECTROSCOPY 23.02.17IR SPECTROSCOPY 23.02.17
IR SPECTROSCOPY 23.02.17
 

Recently uploaded

Is RISC-V ready for HPC workload? Maybe?
Is RISC-V ready for HPC workload? Maybe?Is RISC-V ready for HPC workload? Maybe?
Is RISC-V ready for HPC workload? Maybe?Patrick Diehl
 
‏‏VIRUS - 123455555555555555555555555555555555555555
‏‏VIRUS -  123455555555555555555555555555555555555555‏‏VIRUS -  123455555555555555555555555555555555555555
‏‏VIRUS - 123455555555555555555555555555555555555555kikilily0909
 
Speech, hearing, noise, intelligibility.pptx
Speech, hearing, noise, intelligibility.pptxSpeech, hearing, noise, intelligibility.pptx
Speech, hearing, noise, intelligibility.pptxpriyankatabhane
 
Microphone- characteristics,carbon microphone, dynamic microphone.pptx
Microphone- characteristics,carbon microphone, dynamic microphone.pptxMicrophone- characteristics,carbon microphone, dynamic microphone.pptx
Microphone- characteristics,carbon microphone, dynamic microphone.pptxpriyankatabhane
 
THE ROLE OF PHARMACOGNOSY IN TRADITIONAL AND MODERN SYSTEM OF MEDICINE.pptx
THE ROLE OF PHARMACOGNOSY IN TRADITIONAL AND MODERN SYSTEM OF MEDICINE.pptxTHE ROLE OF PHARMACOGNOSY IN TRADITIONAL AND MODERN SYSTEM OF MEDICINE.pptx
THE ROLE OF PHARMACOGNOSY IN TRADITIONAL AND MODERN SYSTEM OF MEDICINE.pptxNandakishor Bhaurao Deshmukh
 
Evidences of Evolution General Biology 2
Evidences of Evolution General Biology 2Evidences of Evolution General Biology 2
Evidences of Evolution General Biology 2John Carlo Rollon
 
Manassas R - Parkside Middle School 🌎🏫
Manassas R - Parkside Middle School 🌎🏫Manassas R - Parkside Middle School 🌎🏫
Manassas R - Parkside Middle School 🌎🏫qfactory1
 
Call Girls in Munirka Delhi 💯Call Us 🔝9953322196🔝 💯Escort.
Call Girls in Munirka Delhi 💯Call Us 🔝9953322196🔝 💯Escort.Call Girls in Munirka Delhi 💯Call Us 🔝9953322196🔝 💯Escort.
Call Girls in Munirka Delhi 💯Call Us 🔝9953322196🔝 💯Escort.aasikanpl
 
Neurodevelopmental disorders according to the dsm 5 tr
Neurodevelopmental disorders according to the dsm 5 trNeurodevelopmental disorders according to the dsm 5 tr
Neurodevelopmental disorders according to the dsm 5 trssuser06f238
 
Call Girls in Mayapuri Delhi 💯Call Us 🔝9953322196🔝 💯Escort.
Call Girls in Mayapuri Delhi 💯Call Us 🔝9953322196🔝 💯Escort.Call Girls in Mayapuri Delhi 💯Call Us 🔝9953322196🔝 💯Escort.
Call Girls in Mayapuri Delhi 💯Call Us 🔝9953322196🔝 💯Escort.aasikanpl
 
BIOETHICS IN RECOMBINANT DNA TECHNOLOGY.
BIOETHICS IN RECOMBINANT DNA TECHNOLOGY.BIOETHICS IN RECOMBINANT DNA TECHNOLOGY.
BIOETHICS IN RECOMBINANT DNA TECHNOLOGY.PraveenaKalaiselvan1
 
SOLUBLE PATTERN RECOGNITION RECEPTORS.pptx
SOLUBLE PATTERN RECOGNITION RECEPTORS.pptxSOLUBLE PATTERN RECOGNITION RECEPTORS.pptx
SOLUBLE PATTERN RECOGNITION RECEPTORS.pptxkessiyaTpeter
 
Recombinant DNA technology( Transgenic plant and animal)
Recombinant DNA technology( Transgenic plant and animal)Recombinant DNA technology( Transgenic plant and animal)
Recombinant DNA technology( Transgenic plant and animal)DHURKADEVIBASKAR
 
zoogeography of pakistan.pptx fauna of Pakistan
zoogeography of pakistan.pptx fauna of Pakistanzoogeography of pakistan.pptx fauna of Pakistan
zoogeography of pakistan.pptx fauna of Pakistanzohaibmir069
 
STOPPED FLOW METHOD & APPLICATION MURUGAVENI B.pptx
STOPPED FLOW METHOD & APPLICATION MURUGAVENI B.pptxSTOPPED FLOW METHOD & APPLICATION MURUGAVENI B.pptx
STOPPED FLOW METHOD & APPLICATION MURUGAVENI B.pptxMurugaveni B
 
Pests of soyabean_Binomics_IdentificationDr.UPR.pdf
Pests of soyabean_Binomics_IdentificationDr.UPR.pdfPests of soyabean_Binomics_IdentificationDr.UPR.pdf
Pests of soyabean_Binomics_IdentificationDr.UPR.pdfPirithiRaju
 
Pests of jatropha_Bionomics_identification_Dr.UPR.pdf
Pests of jatropha_Bionomics_identification_Dr.UPR.pdfPests of jatropha_Bionomics_identification_Dr.UPR.pdf
Pests of jatropha_Bionomics_identification_Dr.UPR.pdfPirithiRaju
 
Forest laws, Indian forest laws, why they are important
Forest laws, Indian forest laws, why they are importantForest laws, Indian forest laws, why they are important
Forest laws, Indian forest laws, why they are importantadityabhardwaj282
 

Recently uploaded (20)

Is RISC-V ready for HPC workload? Maybe?
Is RISC-V ready for HPC workload? Maybe?Is RISC-V ready for HPC workload? Maybe?
Is RISC-V ready for HPC workload? Maybe?
 
‏‏VIRUS - 123455555555555555555555555555555555555555
‏‏VIRUS -  123455555555555555555555555555555555555555‏‏VIRUS -  123455555555555555555555555555555555555555
‏‏VIRUS - 123455555555555555555555555555555555555555
 
Speech, hearing, noise, intelligibility.pptx
Speech, hearing, noise, intelligibility.pptxSpeech, hearing, noise, intelligibility.pptx
Speech, hearing, noise, intelligibility.pptx
 
Microphone- characteristics,carbon microphone, dynamic microphone.pptx
Microphone- characteristics,carbon microphone, dynamic microphone.pptxMicrophone- characteristics,carbon microphone, dynamic microphone.pptx
Microphone- characteristics,carbon microphone, dynamic microphone.pptx
 
THE ROLE OF PHARMACOGNOSY IN TRADITIONAL AND MODERN SYSTEM OF MEDICINE.pptx
THE ROLE OF PHARMACOGNOSY IN TRADITIONAL AND MODERN SYSTEM OF MEDICINE.pptxTHE ROLE OF PHARMACOGNOSY IN TRADITIONAL AND MODERN SYSTEM OF MEDICINE.pptx
THE ROLE OF PHARMACOGNOSY IN TRADITIONAL AND MODERN SYSTEM OF MEDICINE.pptx
 
Evidences of Evolution General Biology 2
Evidences of Evolution General Biology 2Evidences of Evolution General Biology 2
Evidences of Evolution General Biology 2
 
Hot Sexy call girls in Moti Nagar,🔝 9953056974 🔝 escort Service
Hot Sexy call girls in  Moti Nagar,🔝 9953056974 🔝 escort ServiceHot Sexy call girls in  Moti Nagar,🔝 9953056974 🔝 escort Service
Hot Sexy call girls in Moti Nagar,🔝 9953056974 🔝 escort Service
 
Manassas R - Parkside Middle School 🌎🏫
Manassas R - Parkside Middle School 🌎🏫Manassas R - Parkside Middle School 🌎🏫
Manassas R - Parkside Middle School 🌎🏫
 
Call Girls in Munirka Delhi 💯Call Us 🔝9953322196🔝 💯Escort.
Call Girls in Munirka Delhi 💯Call Us 🔝9953322196🔝 💯Escort.Call Girls in Munirka Delhi 💯Call Us 🔝9953322196🔝 💯Escort.
Call Girls in Munirka Delhi 💯Call Us 🔝9953322196🔝 💯Escort.
 
Neurodevelopmental disorders according to the dsm 5 tr
Neurodevelopmental disorders according to the dsm 5 trNeurodevelopmental disorders according to the dsm 5 tr
Neurodevelopmental disorders according to the dsm 5 tr
 
Call Girls in Mayapuri Delhi 💯Call Us 🔝9953322196🔝 💯Escort.
Call Girls in Mayapuri Delhi 💯Call Us 🔝9953322196🔝 💯Escort.Call Girls in Mayapuri Delhi 💯Call Us 🔝9953322196🔝 💯Escort.
Call Girls in Mayapuri Delhi 💯Call Us 🔝9953322196🔝 💯Escort.
 
Engler and Prantl system of classification in plant taxonomy
Engler and Prantl system of classification in plant taxonomyEngler and Prantl system of classification in plant taxonomy
Engler and Prantl system of classification in plant taxonomy
 
BIOETHICS IN RECOMBINANT DNA TECHNOLOGY.
BIOETHICS IN RECOMBINANT DNA TECHNOLOGY.BIOETHICS IN RECOMBINANT DNA TECHNOLOGY.
BIOETHICS IN RECOMBINANT DNA TECHNOLOGY.
 
SOLUBLE PATTERN RECOGNITION RECEPTORS.pptx
SOLUBLE PATTERN RECOGNITION RECEPTORS.pptxSOLUBLE PATTERN RECOGNITION RECEPTORS.pptx
SOLUBLE PATTERN RECOGNITION RECEPTORS.pptx
 
Recombinant DNA technology( Transgenic plant and animal)
Recombinant DNA technology( Transgenic plant and animal)Recombinant DNA technology( Transgenic plant and animal)
Recombinant DNA technology( Transgenic plant and animal)
 
zoogeography of pakistan.pptx fauna of Pakistan
zoogeography of pakistan.pptx fauna of Pakistanzoogeography of pakistan.pptx fauna of Pakistan
zoogeography of pakistan.pptx fauna of Pakistan
 
STOPPED FLOW METHOD & APPLICATION MURUGAVENI B.pptx
STOPPED FLOW METHOD & APPLICATION MURUGAVENI B.pptxSTOPPED FLOW METHOD & APPLICATION MURUGAVENI B.pptx
STOPPED FLOW METHOD & APPLICATION MURUGAVENI B.pptx
 
Pests of soyabean_Binomics_IdentificationDr.UPR.pdf
Pests of soyabean_Binomics_IdentificationDr.UPR.pdfPests of soyabean_Binomics_IdentificationDr.UPR.pdf
Pests of soyabean_Binomics_IdentificationDr.UPR.pdf
 
Pests of jatropha_Bionomics_identification_Dr.UPR.pdf
Pests of jatropha_Bionomics_identification_Dr.UPR.pdfPests of jatropha_Bionomics_identification_Dr.UPR.pdf
Pests of jatropha_Bionomics_identification_Dr.UPR.pdf
 
Forest laws, Indian forest laws, why they are important
Forest laws, Indian forest laws, why they are importantForest laws, Indian forest laws, why they are important
Forest laws, Indian forest laws, why they are important
 

IR SPECTROSCOPY

  • 1. INFRARED SPERCTROSCOPY STRUCTURE DETERMINATION OF ORGANIC COMPOUNDS THROUGH IR SPECTROSCOPY By: S. YOUSUF RAZA ZAIDI RESEARCH COMPLEX ALLAMA IQBAL OPEN UNIVERSITY ISLAMABAD, PAKISTAN
  • 2. Structure Determination of Organic Compounds through Infrared Spectroscopy Outline  Electromagnetic radiation.  Purpose of each electromagnetic radiation.  Types of Vibrations.  Introduction to IR Spectroscopy.  IR region (Far, Middle & Near).  Requirement of molecule i.e. it must change dipole.  Regions of IR Spectra i.e. fingerprint & functional group  Interpretation of IR Spectra  Hooke’s law Presented By: Syed Yousuf Raza Zaidi
  • 3. • Electromagnetic Radiation The source from where we get the light is Sun or Sunlight. Sunlight is a form of the electromagnetic radiation given off by the Sun. Radiation from the Sun, which is more popularly known as sunlight, is a mixture of electromagnetic waves ranging from Broadcast waves, Radio, Microwave, Infrared (IR), Ultraviolet rays (UV), Visible region, Gamma rays and Cosmic rays.
  • 4. Electromagnetic radiation (EM radiation or EMR) is a form of radiant energy, propagating through space via electromagnetic waves and/or particles called photons coming from the sun.
  • 5. SUN
  • 6. • Purpose of each Electromagnetic Radiation
  • 7. • Types of Molecular Vibrations • Stretching Vibrations: in which bond length changes that require more energy. Symmetrical stretching Asymmetrical stretching • Bending Vibrations: in which bond angle changes that require less energy. Rocking Twisting Scissoring Wagging
  • 8. • Spectroscopy Spectroscopy is the study of the interaction between matter and radiated energy or radiation. • Infrared Spectroscopy Infrared Spectroscopy (IR spectroscopy) is the spectroscopy that deals with the interaction of only infrared region of the electromagnetic spectrum with the matter.
  • 9.
  • 10. Regions of IR Radiation
  • 11.  IR Spectroscopy is a qualitative analytical technique that helps to indicate mainly the functional group of a molecule.  When the IR radiation irradiated to the molecule the part of molecule which is functional absorbs it, as a result of this absorbance the molecular vibration increases.  After the excitation of molecular vibration, these molecules comes back to their original state by releasing that energy of certain wave number which is recorded as transmittance on the spectrophotometer.
  • 12. • Parameters  The spectrophotometer give the spectra of certain wave by indicating the quality of wave (i.e. its wavenumber) and the quantity of wave that how much wave is absorbed by the molecule (Transmittance). Transmittance is the fraction of incident light electromagnetic radiation at a specified wavelength that passes through a sample.(Lambert-Beer Law) It is a ratio so it has no unit.
  • 13.  IR light or electromagnetic radiation is actually thermal radiation. Its means that all of the heat which feel to us or coming into the earth from sun is nothing but IR radiation.  IR is low energy, low frequency and long wavelength radiation with low wave number that can only cause an increase in molecular vibrations (i.e. stretching & bending).  So by triggering molecular vibrations through irradiation with infrared light provides mostly information about the presence or absence of certain functional groups.
  • 14. • Requirement of molecule In order to absorb the electromagnetic radiation for a molecule the frequency of the incident radiation matches the natural frequency of the vibration, the IR photon is absorbed and the amplitude of the vibration increases. The dipole moment of the molecule must change as a result of a molecular vibration. The change in the dipole moment allows interaction with the alternating electrical component of the IR radiation wave. Symmetric molecules (or bonds) do not absorb IR radiation since there is no dipole moment.
  • 15. If the dipole moment of a molecule would not change i.e. as in Symmetric stretching the absorption spectra of radiation cannot be obtained. Such spectra is called as Forbidden or Inactive IR Spectra.  If the molecule vibrate asymmetrically, the change in its dipole moment takes place so absorption spectra of this molecule can be obtained. This is called Active IR spectra.
  • 16. • The IR Spectrum  There are two type of IR Spectra from which we can obtained the information about the quality of molecule . 1. The Functional Group region: Identifies the functional group with the consequence of changing stretching vibrations. Ranges from 4000 to 1600 cm-1. 2. The Fingerprint region: Identifies the exact molecule with the consequence of changing bending vibrations. Ranges from 1600 to 625cm-1. Focus your analysis on this region. This is where most stretching frequencies appear. Fingerprint region: complex and difficult to interpret reliably.
  • 17. • Interpretation of IR Spectra  Structural information about a compound is mainly derived from the presence or absence of characteristics absorption bands of various functional groups in the IR Spectrum of the compound.  A knowledge of the band of all the major functional groups will be valuable. The band position of all the major structural bonding types have been determined in a tabular form. Characteristic absorption position of some of the more important common functional groups are presented in given table.  This table is particularly useful for correlation when the spectrum of an unknown compound has been obtained.  It is always more useful to make direct comparison with the spectra of closely related compound.
  • 19. We can also calculate an approximate value of the stretching vibrational frequency of a bond by treating the two atoms and their connecting bond, to first approximation, as two balls connected by a spring, acting as a simple harmonic oscillator for which the Hooke’s Law may be applied. According to Hooke’s Law , The Stretching frequency is related to the masses of the atom and the force constant(a measure of resistance of a bond to stretching) of a bond by the following equation
  • 21. FUNCTIONAL GROUPS AND IR TABLES The remainder of this presentation will be focused on the IR identification of various functional groups such as alkenes, alcohols, ketones, carboxylic acids, etc. Basic knowledge of the structures and polarities of these groups is assumed. If you need a refresher please turn to your organic chemistry textbook. The inside cover of the Wade textbook has a table of functional groups, and they are discussed in detail in ch. 2, pages 68 – 74 of the 6th edition. A table relating IR frequencies to specific covalent bonds can be found on p. 851 of your laboratory textbook. Pages 852 – 866 contain a more detailed discussion of each type of bond, much like the discussion in this presentation.
  • 22. IR SPECTRUM OF ALKANES Alkanes have no functional groups. Their IR spectrum displays only C-C and C-H bond vibrations. Of these the most useful are the C-H bands, which appear around 3000 cm-1. Since most organic molecules have such bonds, most organic molecules will display those bands in their spectrum. Graphics source: Wade, Jr., L.G. Organic Chemistry, 5th ed. Pearson Education Inc., 2003
  • 23. IR SPECTRUM OF ALKENES Besides the presence of C-H bonds, alkenes also show sharp, medium bands corresponding to the C=C bond stretching vibration at about 1600-1700 cm-1. Some alkenes might also show a band for the =C-H bond stretch, appearing around 3080 cm-1 as shown below. However, this band could be obscured by the broader bands appearing around 3000 cm-1 (see next slide) Graphics source: Wade, Jr., L.G. Organic Chemistry, 5th ed. Pearson Education Inc., 2003
  • 24. IR SPECTRUM OF ALKENES This spectrum shows that the band appearing around 3080 cm-1 can be obscured by the broader bands appearing around 3000 cm-1. Graphics source: Wade, Jr., L.G. Organic Chemistry, 6th ed. Pearson Prentice Hall Inc., 2006
  • 25. IR SPECTRUM OF ALKYNES The most prominent band in alkynes corresponds to the carbon-carbon triple bond. It shows as a sharp, weak band at about 2100 cm-1. The reason it’s weak is because the triple bond is not very polar. In some cases, such as in highly symmetrical alkynes, it may not show at all due to the low polarity of the triple bond associated with those alkynes. Terminal alkynes, that is to say those where the triple bond is at the end of a carbon chain, have C-H bonds involving the sp carbon (the carbon that forms part of the triple bond). Therefore they may also show a sharp, weak band at about 3300 cm-1 corresponding to the C-H stretch. Internal alkynes, that is those where the triple bond is in the middle of a carbon chain, do not have C-H bonds to the sp carbon and therefore lack the aforementioned band. The following slide shows a comparison between an unsymmetrical terminal alkyne (1-octyne) and a symmetrical internal alkyne (4-octyne).
  • 26. IR SPECTRUM OF ALKYNES Graphics source: Wade, Jr., L.G. Organic Chemistry, 6th ed. Pearson Prentice Hall Inc., 2006
  • 27. IR SPECTRUM OF A NITRILE In a manner very similar to alkynes, nitriles show a prominent band around 2250 cm-1 caused by the CN triple bond. This band has a sharp, pointed shape just like the alkyne C-C triple bond, but because the CN triple bond is more polar, this band is stronger than in alkynes. Graphics source: Wade, Jr., L.G. Organic Chemistry, 6th ed. Pearson Prentice Hall Inc., 2006
  • 28. IR SPECTRUM OF AN ALCOHOL The most prominent band in alcohols is due to the O-H bond, and it appears as a strong, broad band covering the range of about 3000 - 3700 cm-1. The sheer size and broad shape of the band dominate the IR spectrum and make it hard to miss. Graphics source: Wade, Jr., L.G. Organic Chemistry, 6th ed. Pearson Prentice Hall Inc., 2006
  • 29. IR SPECTRUM OF ALDEHYDES AND KETONES Carbonyl compounds are those that contain the C=O functional group. In aldehydes, this group is at the end of a carbon chain, whereas in ketones it’s in the middle of the chain. As a result, the carbon in the C=O bond of aldehydes is also bonded to another carbon and a hydrogen, whereas the same carbon in a ketone is bonded to two other carbons. Aldehydes and ketones show a strong, prominent, stake-shaped band around 1710 - 1720 cm-1 (right in the middle of the spectrum). This band is due to the highly polar C=O bond. Because of its position, shape, and size, it is hard to miss. Because aldehydes also contain a C-H bond to the sp2 carbon of the C=O bond, they also show a pair of medium strength bands positioned about 2700 and 2800 cm-1. These bands are missing in the spectrum of a ketone because the sp2 carbon of the ketone lacks the C-H bond. The following slide shows a spectrum of an aldehyde and a ketone. Study the similarities and the differences so that you can distinguish between the two.
  • 30. IR SPECTRUM OF ALDEHYDES AND KETONES Graphics source: Wade, Jr., L.G. Organic Chemistry, 6th ed. Pearson Prentice Hall Inc., 2006
  • 31. IR SPECTRUM OF A CARBOXYLIC ACID A carboxylic acid functional group combines the features of alcohols and ketones because it has both the O-H bond and the C=O bond. Therefore carboxylic acids show a very strong and broad band covering a wide range between 2800 and 3500 cm-1 for the O-H stretch. At the same time they also show the stake-shaped band in the middle of the spectrum around 1710 cm-1 corresponding to the C=O stretch. Graphics source: Wade, Jr., L.G. Organic Chemistry, 6th ed. Pearson Prentice Hall Inc., 2006
  • 32. IR SPECTRA OF AMINES The most characteristic band in amines is due to the N-H bond stretch, and it appears as a weak to medium, somewhat broad band (but not as broad as the O-H band of alcohols). This band is positioned at the left end of the spectrum, in the range of about 3200 - 3600 cm-1. Primary amines have two N-H bonds, therefore they typically show two spikes that make this band resemble a molar tooth. Secondary amines have only one N-H bond, which makes them show only one spike, resembling a canine tooth. Finally, tertiary amines have no N-H bonds, and therefore this band is absent from the IR spectrum altogether. The spectrum below shows a secondary amine. Graphics source: Wade, Jr., L.G. Organic Chemistry, 6th ed. Pearson Prentice Hall Inc., 2006
  • 33. IR SPECTRUM OF AMIDES The amide functional group combines the features of amines and ketones because it has both the N-H bond and the C=O bond. Therefore amides show a very strong, somewhat broad band at the left end of the spectrum, in the range between 3100 and 3500 cm-1 for the N-H stretch. At the same time they also show the stake-shaped band in the middle of the spectrum around 1710 cm-1 for the C=O stretch. As with amines, primary amides show two spikes, whereas secondary amides show only one spike. Graphics source: Wade, Jr., L.G. Organic Chemistry, 6th ed. Pearson Prentice Hall Inc., 2006
  • 34. References http://www.utdallas.edu/~biewerm/12IR.pdf http://www.chem.ucla.edu/~webspectra/irtable.html http://en.wikipedia.org/wiki/Infrared_spectroscopy http://orgchem.colorado.edu/Spectroscopy/irtutor/IRtheory. pdf http://chemwiki.ucdavis.edu/Organic_Chemistry/Organic_Ch emistry_With_a_Biological_Emphasis/Chapter__4%3A_Struct ure_Determination_I/Section_4.2%3A__Infrared_spectroscop y