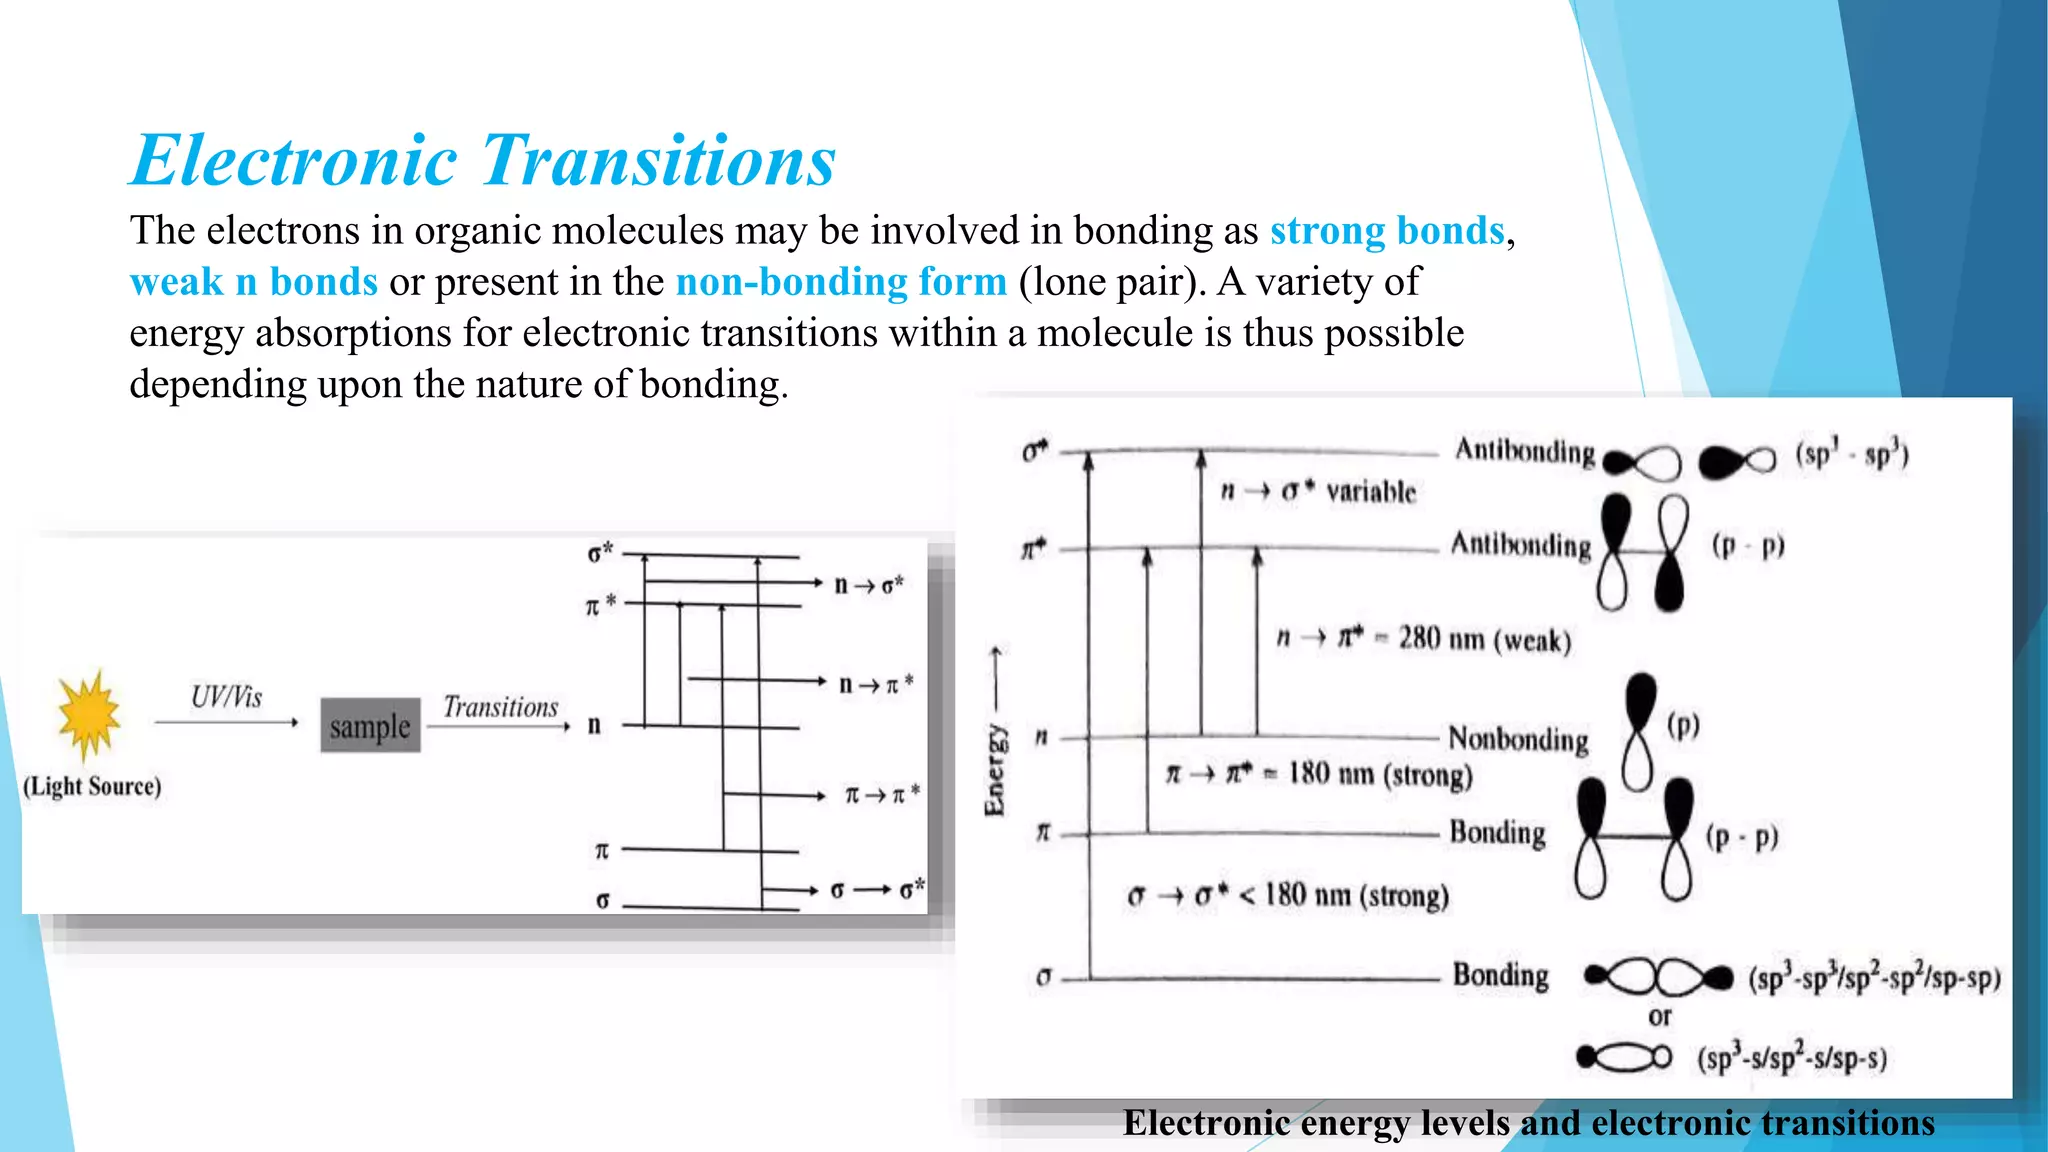
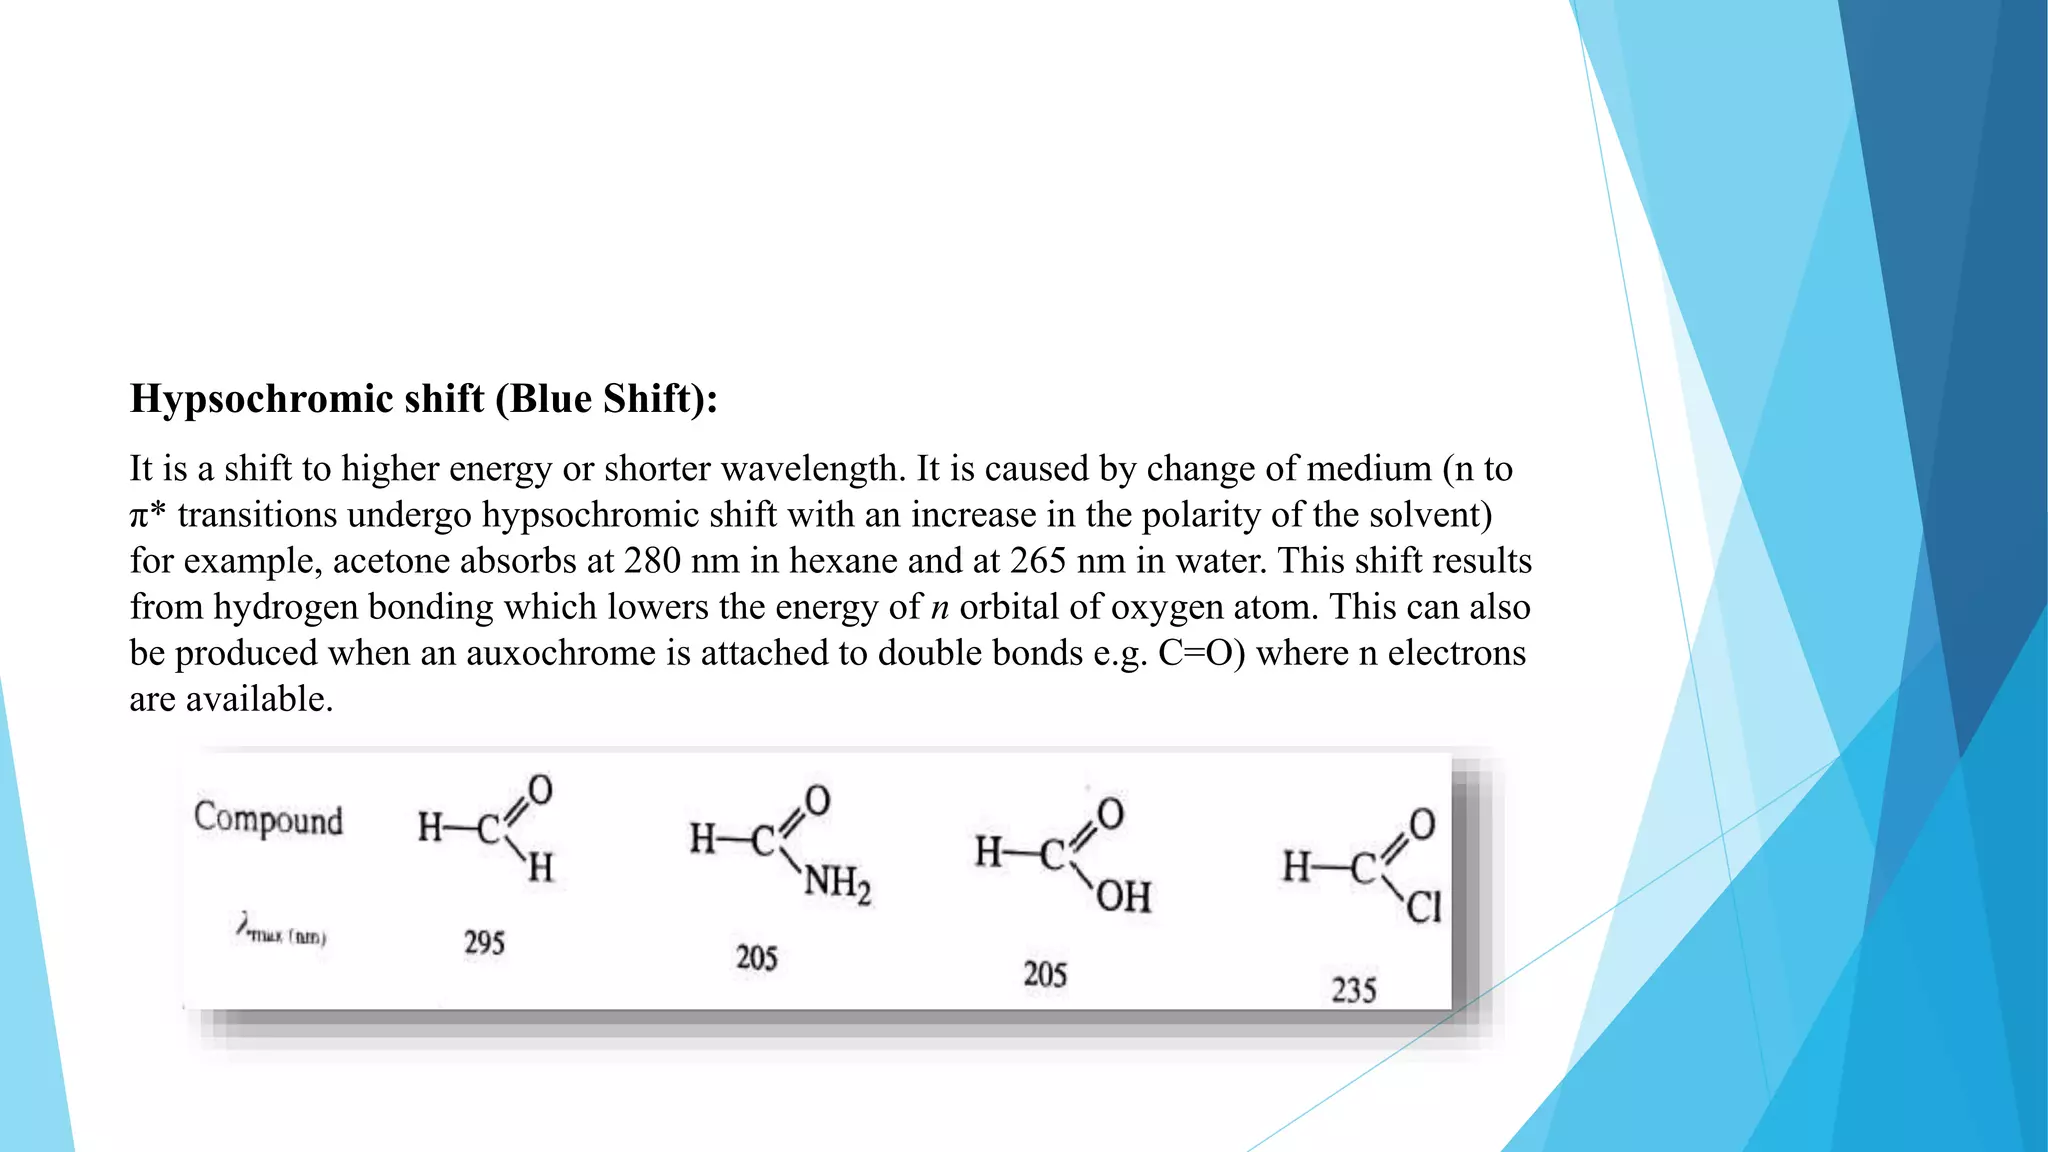
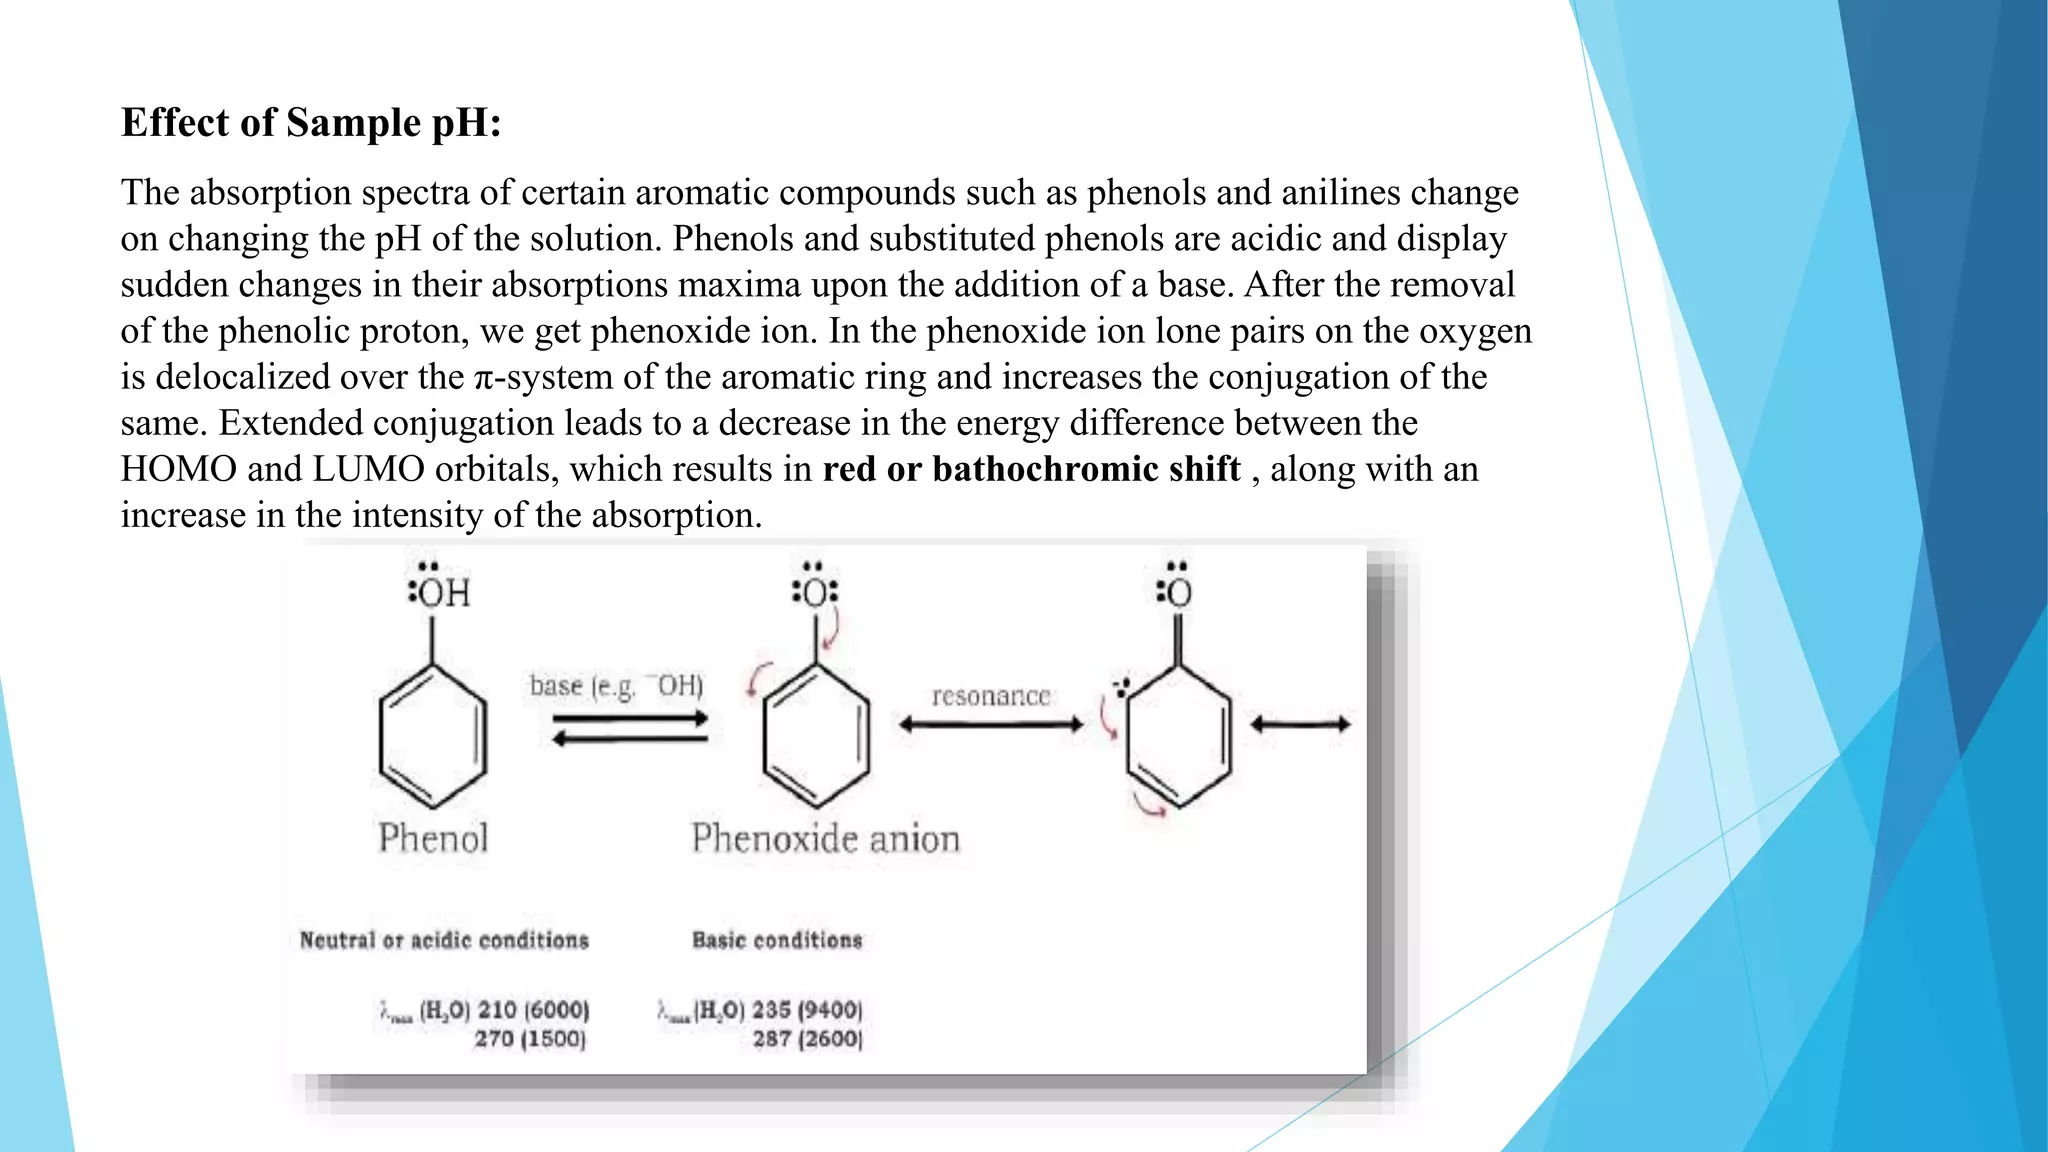
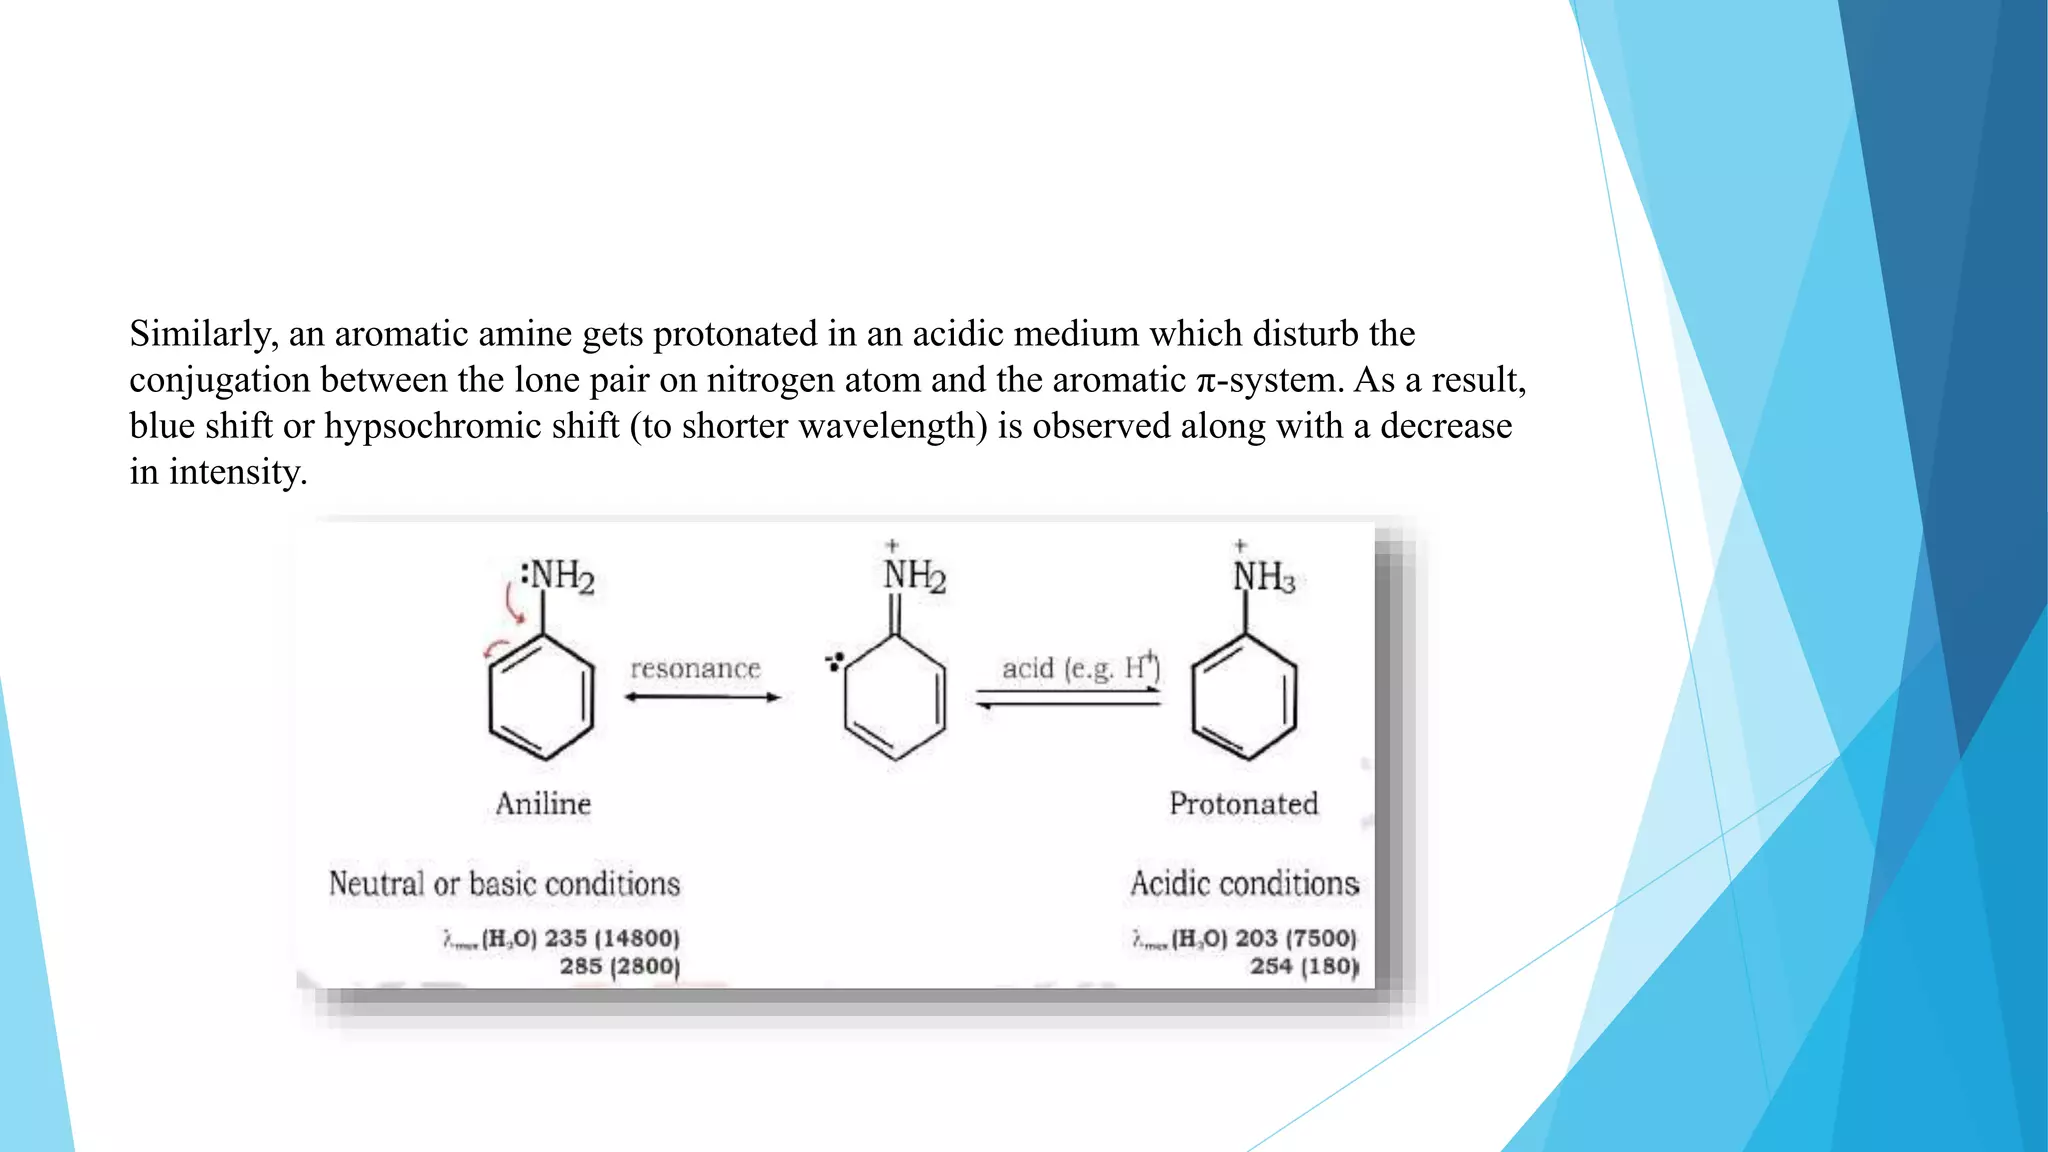
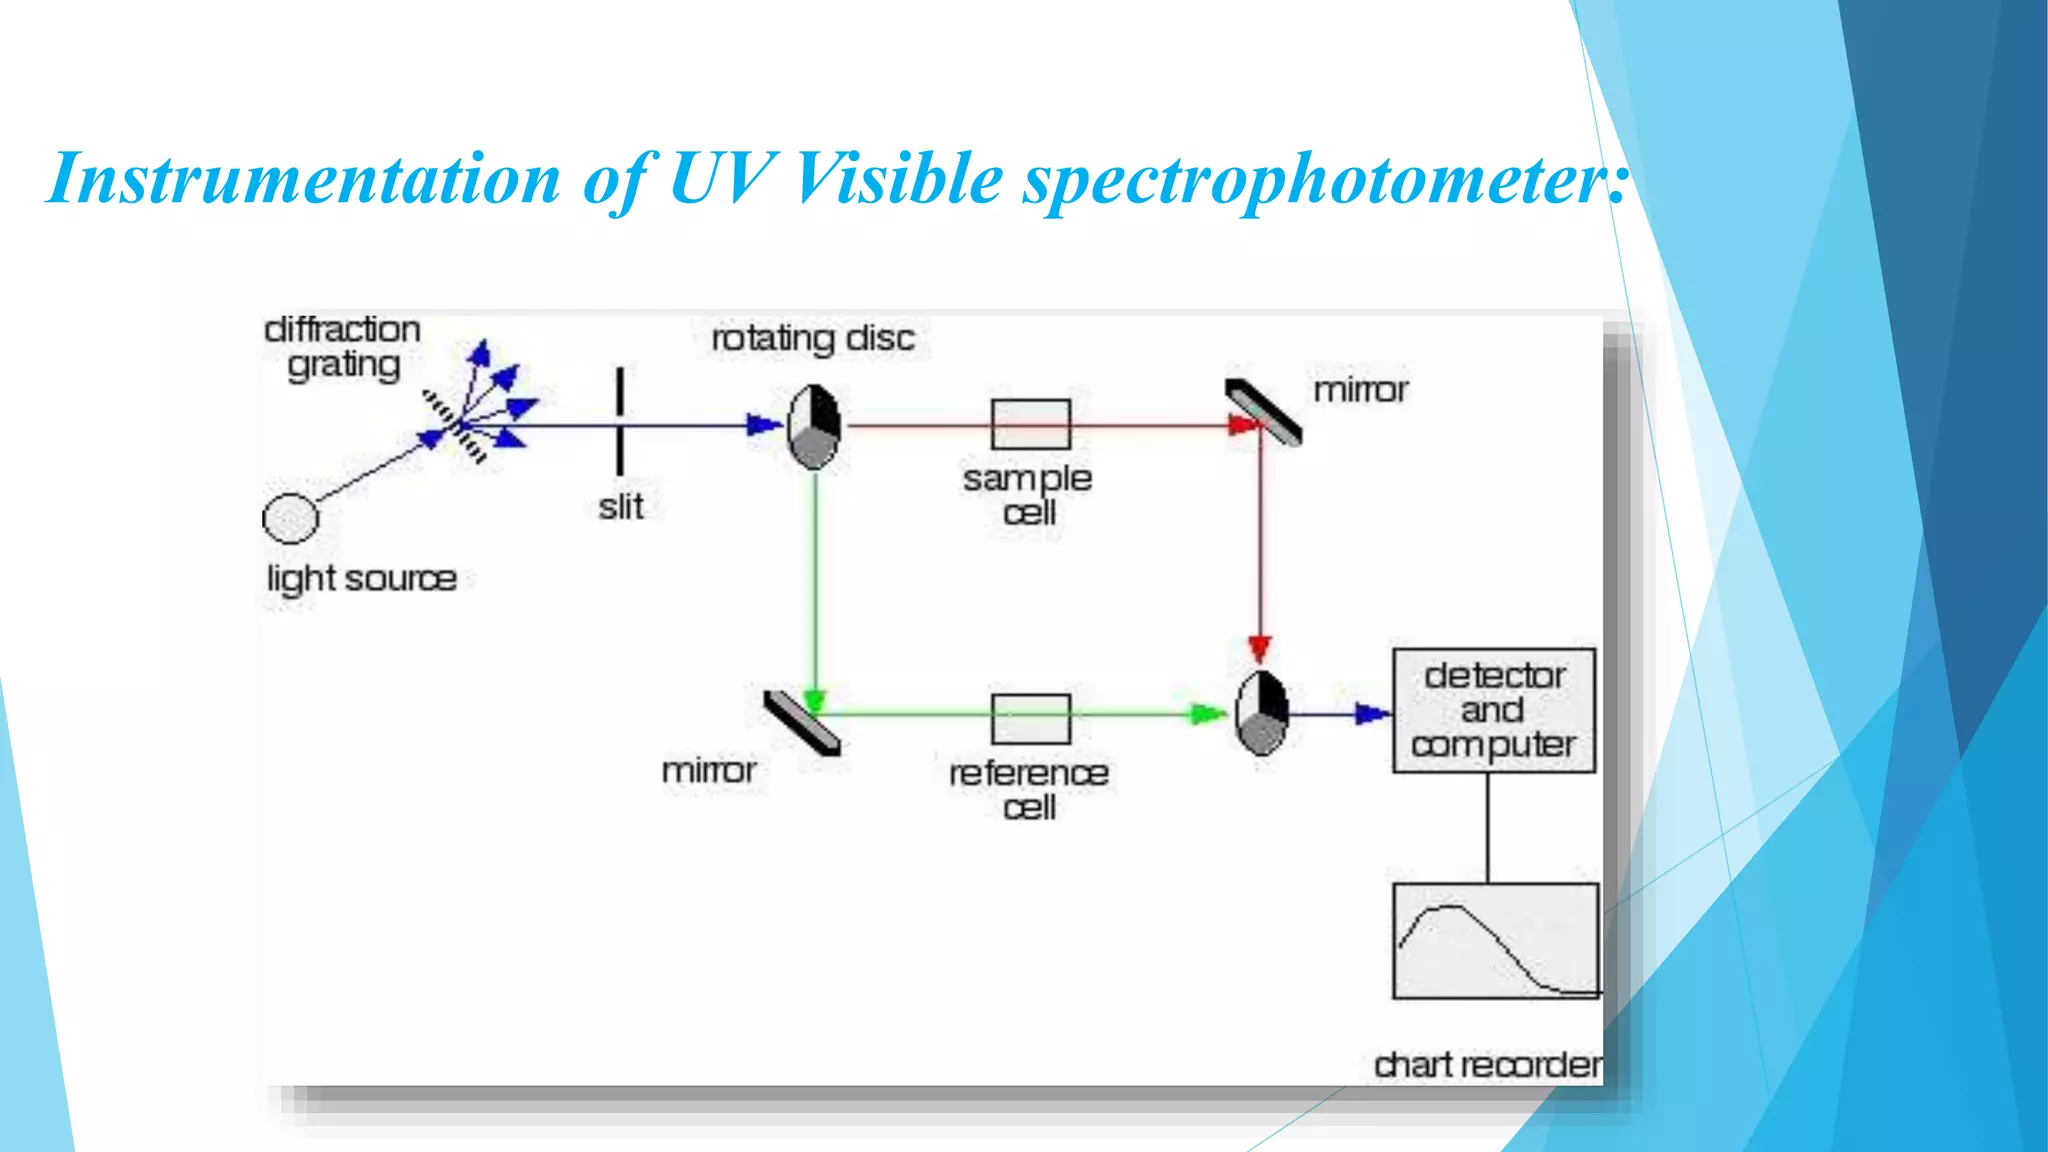
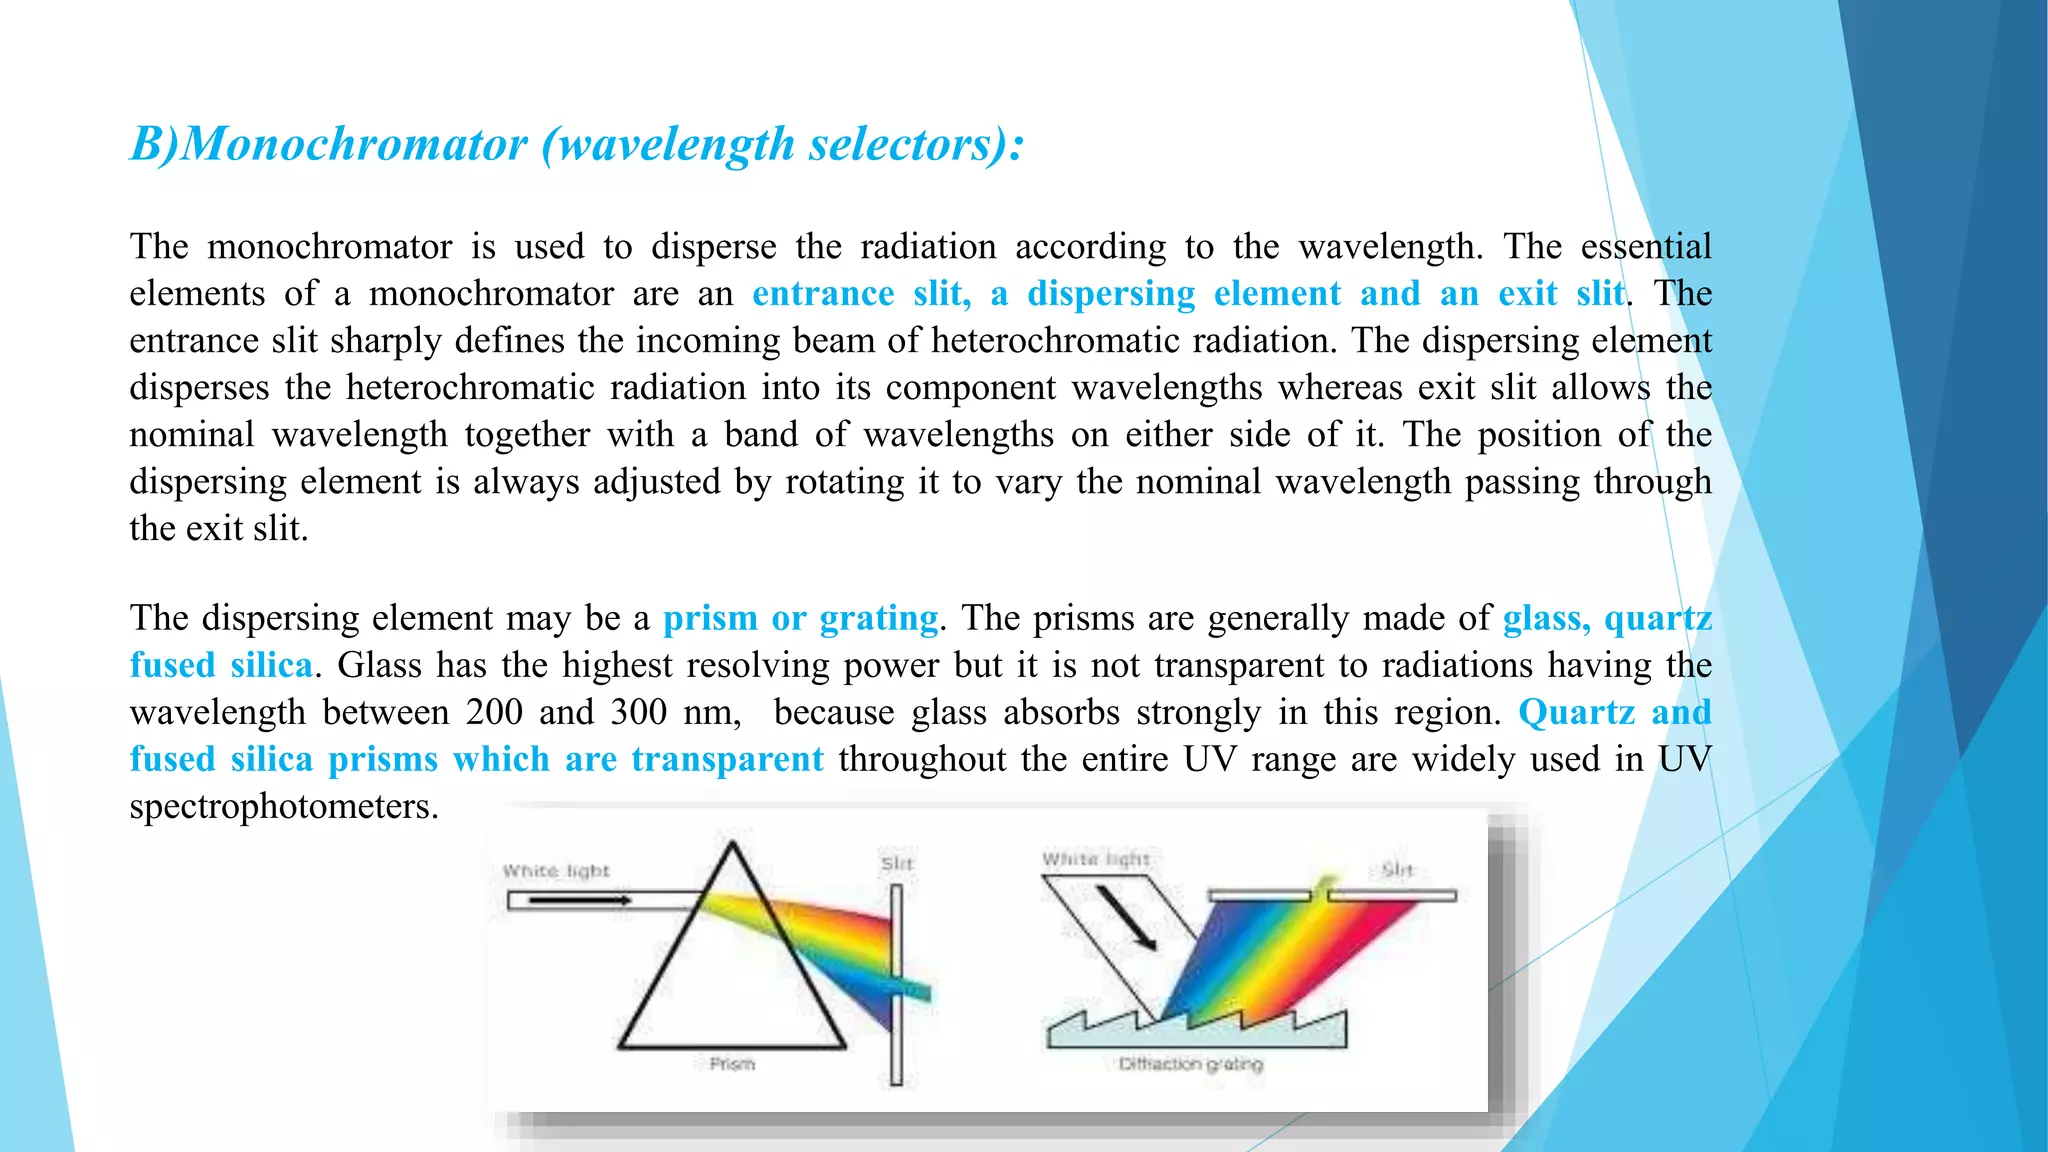
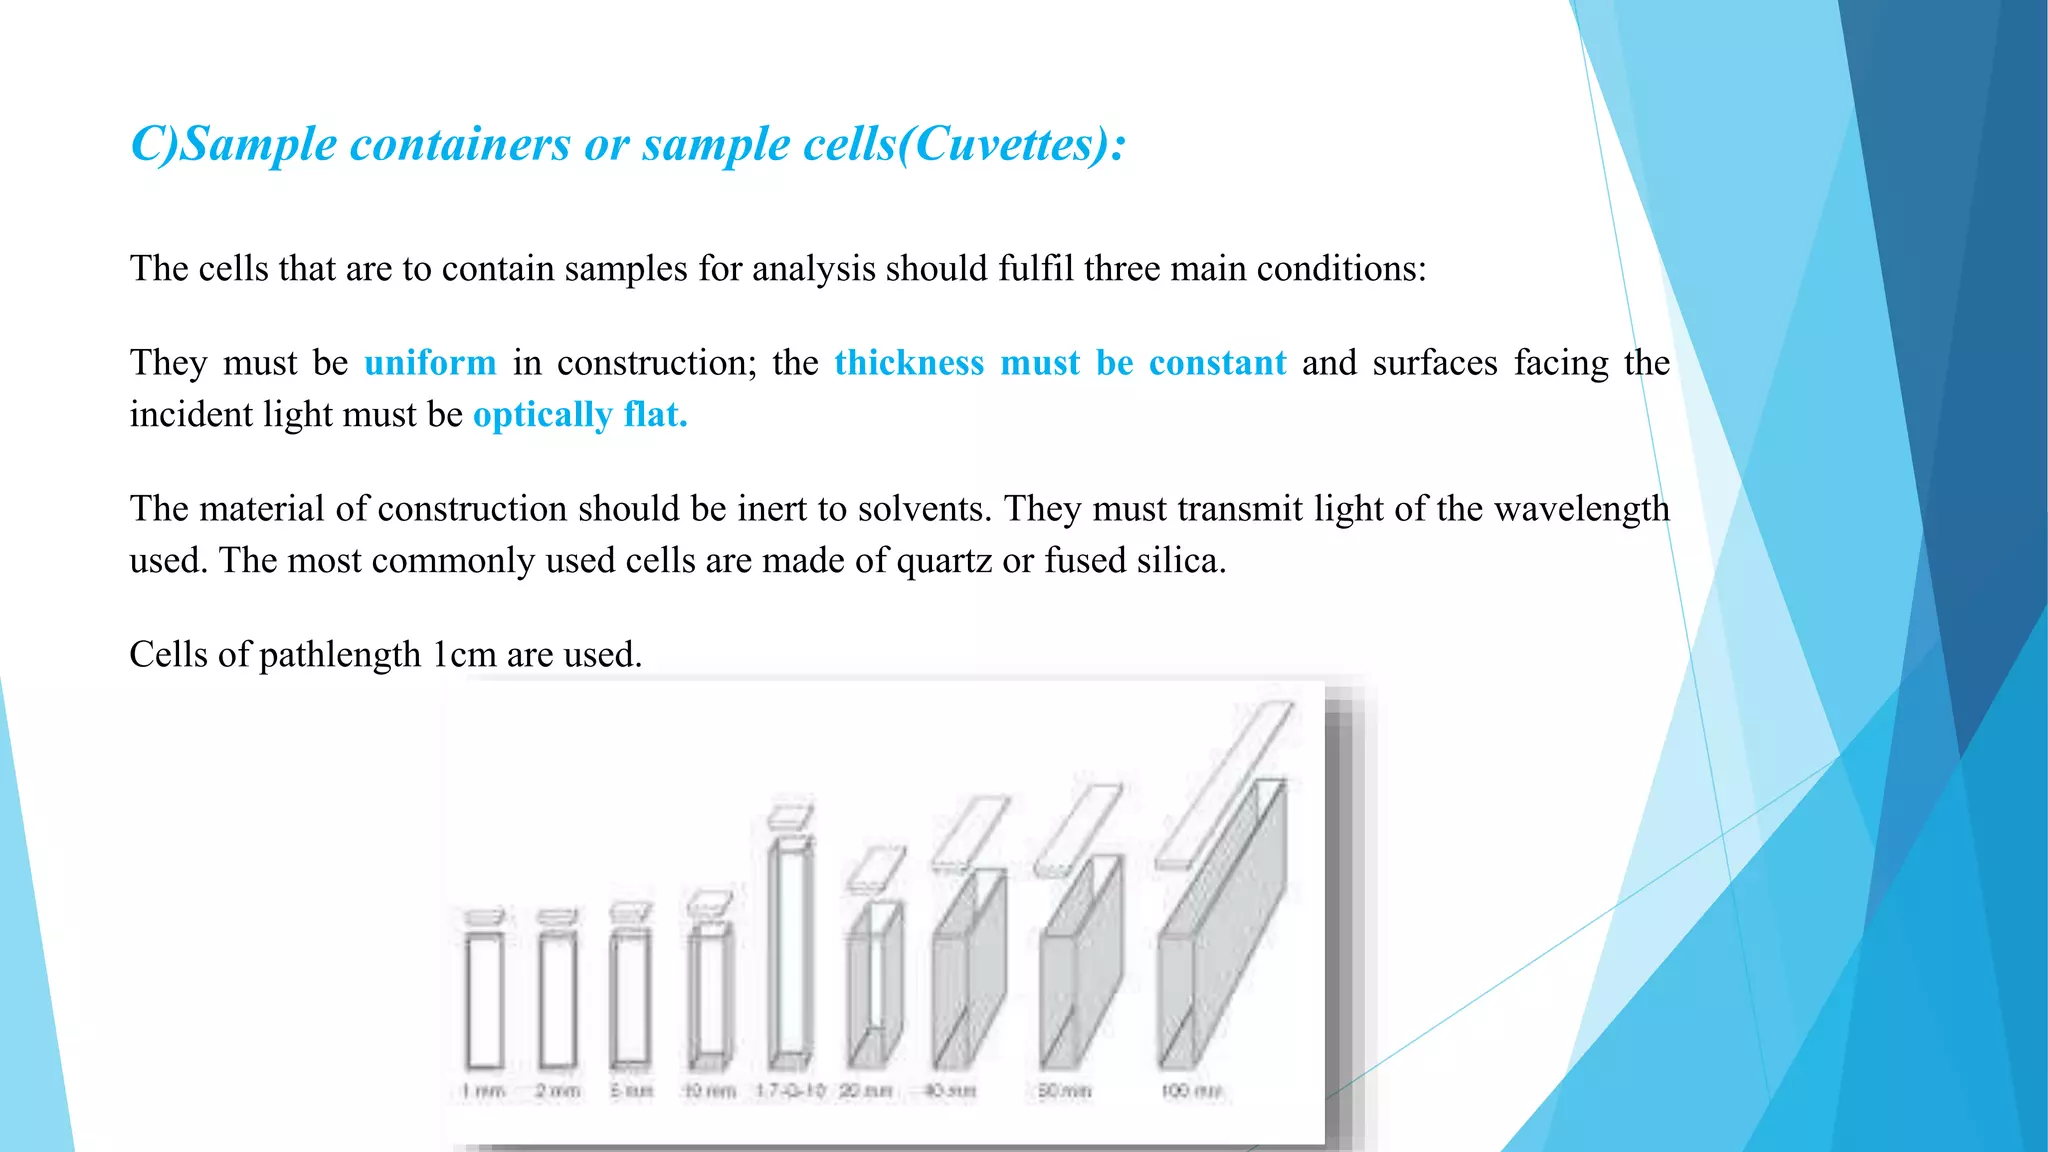
UV-Visible Spectroscopy
Presented By
Simran
M.Pharm Ist yr
GGSCOP, YNR
Contents
 Spectroscopy
 UV VIS Spectroscopy
 UV Visible Spectrum
 Principle
 Beer and Lambert’s law
 Electronic Transitions
 Types of electronic transitions
 Chromophores
 Auxochromes
 Spectral shifts
 Solvents used in UV VIS Spectroscopy
 Factors affecting the position of UV bands
 Instrumentation of UV visible Spectrophotometer
 Applications
What is Spectroscopy?
SPECTROSCOPY
Definition:
Spectroscopy is defined as the study of interaction of EMR with matter. It is used for analysis of wide
range of samples.
 It is the branch of science that deals with the study of interaction of electromagnetic radiation with
matter.
 The principle is based on the measurement of spectrum of a sample containing atoms / molecules.
Spectrum is a graph of intensity of absorbed or emitted radiation by sample verses frequency (ν) or
wavelength (λ). Spectrometer is an instrument design to measure the spectrum of a compound.
 Spectroscopy is a necessary tool for structure determination.
 Organic chemists use spectroscopy as a necessary tool.
UV VIS Spectroscopy
 Ultraviolet-visible spectroscopy or ultraviolet-visible spectrophotometry (UV-Vis or
UV/Vis) refers to absorption spectroscopy or reflectance spectroscopy in the
ultraviolet-visible spectral region. Ultraviolet-Visible (UV-VIS) Spectroscopy is an
analytical method that can measure the analyte quantity depending on the amount of
light received by the analyte.
 Ultraviolet-visible spectroscopy (UV-Vis) in the ultraviolet-visible spectral field refers
to absorption spectroscopy or reflectance spectroscopy. In the visible and neighbouring
(near-UV and near-infrared (NIR) ranges, this means that it uses light.
UV visible spectrum
FAR (OR) VACCUM UV
REGION
(10-200nm)
NEAR OR QUARTZ UV
REGION
(200-400nm)
VISIBLE REGION
(400-780nm)
 UV-Visible Spectroscopy is based on the absorption of ultraviolet light or visible
light by chemical compounds when electrons are promoted to higher energy levels,
which results in the production of distinct spectra.
 Ultraviolet absorption spectroscopy deals with the measurement of energy absorbed
when electrons are promoted to higher energy levels. Since UV and visible
spectroscopy involves electronic transitions, it is often called electronic spectroscopy.
 The ultraviolet spectrum is simply a plot of wavelength of light absorbed versus the
absorption intensity (absorbance or transmittance) and is conveniently recorded by
plotting molar absorptivity (ε) against wavelength (nm).
Principle
The principle involved in UV-Visible spectroscopy is absorption spectroscopy. The
principle of UV-Visible spectroscopy is based on the fundamental law of absorption
called Beer-Lambert’s law. This law governs the absorption of radiation by an absorbing
medium (dilute solution).
 Beer’s law:
According to Beer’s law, when a beam of monochromatic radiation passes through an
absorbing medium, the intensity radiation decreases exponentially with an increase in
the concentration of the absorbing medium.
In other words, absorbance is directly proportional to the concentration of the absorbing
substance.
 Lambert’s law:
According to Lambert’s law, the intensity of a beam monochromatic light decreases
exponentially as the light travels through a thickness of homogeneous medium
Beer’s law
The quantitative aspects of spectrophotometry are based on two laws:
Beer’s law: It states that the intensity of a beam monochromatic light decreases
exponentially with the concentration of the absorbing molecules. Beer’s law can be
expressed mathematically as
where I0 is intensity of light incident on the sample, I is intensity of light transmitted by the
sample, k is a constant and c is the concentration of the sample.
Taking logarithms,
Log( I0/I ) is a dimensionless quantity (a logarithm of a ratio of light intensities) and is
defined as absorbance. Thus Beer’s law states that absorbance is proportional to
concentration.
Lambert’s law
Lambert’s law: It states that the intensity of a beam monochromatic light decreases exponentially
as the light travels through a thickness of homogeneous medium, expressed mathematically as
l is the thickness of the medium (or path length) through which the light passes and k” is another
constant. Taking logarithms,
i.e. absorbance is proportional to path length. These two fundamental equations are so similar
that they can be combined into one relationship, the Beer–Lambert law or equation, which can
be expressed as
Here, k is yet another constant, the value of which depends on the units used for the concentration
term, c, and on the path length.
Electronic Transitions
The electrons in organic molecules may be involved in bonding as strong bonds,
weak n bonds or present in the non-bonding form (lone pair). A variety of
energy absorptions for electronic transitions within a molecule is thus possible
depending upon the nature of bonding.
Electronic energy levels and electronic transitions
Types of electronic transitions
A) Transitions between bonding and antibonding orbitals : two types
(i) σ to σ* Transition(120-200nm) : The excitation between bonding sigma and antibonding sigma
orbitals (σ to σ* transition) requires large energies. For example, methane, propane, cyclohexane etc.,
display σ to σ* transitions λͅmax for each of these compounds is below 140 nm.
(ii) π to π* Transition : The transition or promotion of an electron from a π bonding orbital to a π*
antibonding orbital. These type of transitions occur in compounds containing one or more covalently
unsaturated groups like C=C, C≡C, C=O, N=N, aromatic rings, NO2, etc. In unconjugated alkenes, this
transition occurs in the range 170-190 nm; ethylene shows λͅmax at around 171 nm.
B) Transitions between non-bonding atomic orbitals and antibonding orbitals : two types
(i) n to π* Transition : Transitions between non-bonding atomic orbitals holding unshared pair of
electrons and antibonding pi-orbitals are called n to π* transitions. Non-bonding electrons are held
more loosely than σ bonding electrons and consequently undergo transitions at comparatively longer
wavelengths. These transitions occur with compounds containing double bonds involving hetero
atoms bearing unshared pair(s) of electrons (e.g., C=S, N=O etc.).
(ii) n to σ* Transition : The excitation of an electron in an unshared pair (nonbonding
electrons) on nitrogen, oxygen, sulphur or halogens to an antibonding σ orbital is
called n to σ* transition.
This transition is of moderate intensity located around 180nm for alcohols, near 190 nm
for ethers or halogen derivatives and in the region of 220 nm for amines.
σ to π* Transition and π to σ* Transition : These electronic transition are forbidden
transitions and are theoretically possible.
Chromophores:
Originally , the term chromophore was applied to the system responsible for imparting
colour to a compound.
The term has been retained within an extended interpretation to imply any functional group
that absorbs electromagnetic radiation, whether or not a 'color' is thereby produced.
The functional group containing multiple bonds capable of absorbing radiations above
200nm due to n to π* and π to π*
examples are: C=O, C=C, C=N, N=N, C ≡ C, C ≡ N, C = S etc.
Auxochrome
The functional groups attached to a chromophore which modifies the ability of the
chromophore to absorb light, altering the wavelength or intensity of absorption.
It is an auxiliary group which interacts with the chromophore causing a bathochromic shift.
It enhances the colour imparting properties of a chromophore without being itself a
chromophore.
examples are: methyl, hydroxyl, alkoxy, halogens, and amino and substituted amino groups
(OR,NH2, NHR and NR2).
Spectral Shifts
Bathochromic shift (Red Shift):
It is a shift to lower energy or longer wavelength. It is caused by change of medium (π to
π* transitions undergo bathochromic shift with an increase in the polarity of the solvent) or
when auxochrome is attached to C=C double bond for example, ethene absorbs at λͅmax =
175 nm while 1-butene absorbs at λͅmax = 190 nm. The bathochromic shift is progressive as
the number of alkyl groups increases.
Hypsochromic shift (Blue Shift):
It is a shift to higher energy or shorter wavelength. It is caused by change of medium (n to
π* transitions undergo hypsochromic shift with an increase in the polarity of the solvent)
for example, acetone absorbs at 280 nm in hexane and at 265 nm in water. This shift results
from hydrogen bonding which lowers the energy of n orbital of oxygen atom. This can also
be produced when an auxochrome is attached to double bonds e.g. C=O) where n electrons
are available.
Hyperchromic effect:
It is the effect leading to increased absorption intensity.
If auxochrome introduces to the compound, the intensity of absorption increases.
For example, phenolate ion has more absorption intensity than phenol.
Hypochromic effect:
It is the effect leading to decreased absorption intensity, for example, benzoate ion has less
absorption intensity than benzoic acid.
Solvents used in UV VIS Spectroscopy
Solvent λ of absorption
Water 191 nm
Ether 215 nm
Methanol 203 nm
Ethanol 204 nm
Chloroform 237 nm
Carbon tetrachloride 265 nm
Benzene 280 nm
Tetrahydrofuran 220 nm
Factors affecting the position of UV bands:
Effect of solvent:
The absorption spectrum depends on the solvent in which the absorbing substance is
dissolved. The choice of solvent can shift peaks to shorter or longer wavelengths. This
depends on the nature of the interaction of the particular solvent with the environment of
the chromophore in the molecule under study.
Water and alcohols can form hydrogen bonds which results the shifting of the bands of
polar substances. Since polarities of the ground and excited state of a chromophore are
different, hence a change in the solvent polarity will stabilize the ground and excited states
to different extent causing change in the energy gap between these electronic states. Highly
pure, non-polar solvents such as saturated hydrocarbons do not interact with solute
molecules either in the ground or excited state and the absorption spectrum of a compound
in these solvents is similar to the one in a pure gaseous state.
(i) π to π* Transitions:
In case of π to π* transitions, the excited states are more polar than the ground state. If a
polar solvent is used the dipole–dipole interaction reduces the energy of the excited state
more than the ground state. Thus a polar solvent decreases the energy of π to π* transition
and hence the absorption in a polar solvent such as ethanol will be at a longer wavelength
(red shift) than in a non-polar solvent such as hexane.
(ii) n to π* transitions:
In case of n to π* transitions, the polar solvents form hydrogen bonds with the ground state
of polar molecules more readily than with their excited states. Consequently the energy of
ground state is decreased which further causes the increase in energy difference between
the ground and excited energy levels. Therefore, absorption maxima resulting from n to π*
transitions are shifted to shorter wavelengths (blue shift) with increasing solvent polarity.
Effect of Sample pH:
The absorption spectra of certain aromatic compounds such as phenols and anilines change
on changing the pH of the solution. Phenols and substituted phenols are acidic and display
sudden changes in their absorptions maxima upon the addition of a base. After the removal
of the phenolic proton, we get phenoxide ion. In the phenoxide ion lone pairs on the oxygen
is delocalized over the π-system of the aromatic ring and increases the conjugation of the
same. Extended conjugation leads to a decrease in the energy difference between the
HOMO and LUMO orbitals, which results in red or bathochromic shift , along with an
increase in the intensity of the absorption.
Similarly, an aromatic amine gets protonated in an acidic medium which disturb the
conjugation between the lone pair on nitrogen atom and the aromatic π-system. As a result,
blue shift or hypsochromic shift (to shorter wavelength) is observed along with a decrease
in intensity.
Instrumentation of UV Visible spectrophotometer:
A) Sources of radiation:
It must be stable, must provide sufficient intensity of radiation and supply
continuous radiation over the entire wavelength.
A) Hydrogen or deuterium discharge lamp:
The hydrogen discharge lamp consists of hydrogen gas under relatively
high pressure through which there is an electrical discharge. The hydrogen
molecules are excited electrically and emit UV radiation. This causes the
hydrogen to emit a continuum (broad band) rather than a simple hydrogen
line spectrum.
The lamps are stable, robust, and widely used. If deuterium (D,) is used
instead of hydrogen, the emission intensity is increased by as much as a
factor of 3 at the short-wavelength end of the UV range.
B) Tungsten filament lamp:
The tungsten lamp is similar in its functioning to an electric light
bulb. It is a tungsten filament heated electrically to white heat. It has
two shortcomings. The intensity of radiation at short wavelengths
(<350 nm) is small. Furthermore, to maintain a constant intensity, the
electrical current to the lamp must be carefully controlled. However,
the lamps are generally stable, robust, and easy to use. Typically, the
emission intensity varies with wavelength.
C) Mercury arc:
In this, the mercury vapour is under high pressure, and the excitation
of mercury atoms is done by electric discharge. The mercury arc, a
standard source for much ultraviolet work, is generally not suitable
for continuous spectral studies because of the presence of sharp lines
or bands.
D) Xenon discharge lamp:
In these lamps, xenon gas is stored under pressure in the range of 10-30 atmospheres. The
xenon lamp possesses two tungsten electrodes separated by about 8 mm. When an intense
arc is formed between two tungsten electrodes by applying a low voltage, the ultraviolet
light is produced. The intensity of ultraviolet radiation produced by xenon discharge lamp
is much greater than that of hydrogen lamp.
B)Monochromator (wavelength selectors):
The monochromator is used to disperse the radiation according to the wavelength. The essential
elements of a monochromator are an entrance slit, a dispersing element and an exit slit. The
entrance slit sharply defines the incoming beam of heterochromatic radiation. The dispersing element
disperses the heterochromatic radiation into its component wavelengths whereas exit slit allows the
nominal wavelength together with a band of wavelengths on either side of it. The position of the
dispersing element is always adjusted by rotating it to vary the nominal wavelength passing through
the exit slit.
The dispersing element may be a prism or grating. The prisms are generally made of glass, quartz
fused silica. Glass has the highest resolving power but it is not transparent to radiations having the
wavelength between 200 and 300 nm, because glass absorbs strongly in this region. Quartz and
fused silica prisms which are transparent throughout the entire UV range are widely used in UV
spectrophotometers.
C)Sample containers or sample cells(Cuvettes):
The cells that are to contain samples for analysis should fulfil three main conditions:
They must be uniform in construction; the thickness must be constant and surfaces facing the
incident light must be optically flat.
The material of construction should be inert to solvents. They must transmit light of the wavelength
used. The most commonly used cells are made of quartz or fused silica.
Cells of pathlength 1cm are used.
D) Detectors
Photomultiplier tube:
A photomultiplier tube is a combination of a photodiode
and an electron multiplying amplifier. A photomultiplier
tube consists of an evacuated tube which contains one
photo-cathode and 9-16 electrodes known as dynodes.
When radiation falls on a metal surface of the
photocathode, it emits electrons. The electrons are
attracted towards the first dynode which is kept at a
positive voltage. When the electrons strike the first
dynode, more electrons are emitted by the surface of
dynode; these emitted electrons are then attracted by a
second dynode where similar type of electron emission
takes place. The process is repeated over all the dynodes
present in the photomultiplier tube until a shower of
electrons reaches the collector. The number of electrons
reaching the collector is a measure of the intensity of
light falling on the detector. The dynodes are operated at
an optimum voltage that gives a steady signal.
Photo voltaic cell (Barrier Layer Cell):
The barrier cell consists of a semiconductor, such as selenium,
which is deposited on a strong metal base, such as iron. Then a
very thin layer of silver or gold is sputtered over the surface of
the semiconductor to act as a second collector electrode. The
radiation falling on the surface produces electrons at the
selenium silver interface. A barrier exists between the selenium
and iron which prevents the electrons from flowing into iron.
The electrons are therefore accumulated on the silver surface.
The accumulation of electrons on the silver surface produces an
electrical voltage difference between the silver surface and the
base of cell. If the external circuit has a low resistance, a
photocurrent will flow which is directly proportional to the
intensity of incident radiation beam.
Photo tube (Photocell):
It consists of a high-sensitive cathode in the form of a half-cylinder of metal
which is contained in an evacuated tube. The anode is also present in the tube
which is fixed more or less along the axis of the tube. The inside surface of
the photocell is coated with a light sensitive layer. When the light is incident
upon a photocell, the surface coating emits electrons. These are attracted and
collected by an anode. The current, which is created between the cathode and
anode, is regarded as a measure of radiation falling on the detector.
Silicon Photodiode:
A silicon photodiode is a solid-state device which converts incident light
into an electric current. It consists of a shallow diffused p-n junction,
normally a p-on-n configuration. (p-n junction is an interface or a boundary
between two semiconductor material types, namely the p-type and the n-
type, inside a semiconductor. The p-side or the positive side of the
semiconductor has an excess of holes and the n-side or the negative side has
an excess of electrons.)
Applications
1) Qualitative Analysis: Limited utility, but can predict presence or absence of certain
functional groups
2) Detection of Impurities: for example, benzene as impurity in ethanol
3) Quantitative analysis: directly or by making calibration curve
4) Pharmaceutical analysis: UV-Vis spectroscopy is an indispensable equipment in
production of pharmaceutics. Overlap of absorbance peaks in uv spectra can be used to
find out the pharmaceutical compounds using mathematical derivatives. Chlortetracycline
(antibiotic) and benzocaine (anesthetic) are identified simultaneously in veterinary powder
formulation using first mathematical derivative.
5) Determination of strength of H-bonding: It is based on shift observed in polar
solvents, for example, acetone absorbs at 279 (121kcal/mole) & 264.5 (126kcal/mole) nm
resp. in hexane and water
6) Study of Chemical reactions (Spectrophotometric titrations) : provided that
absorption spectra of reactants and products are considerably different.
7) Study of geometrical isomerism: It is established that trans isomer displays longer
wavelength absorption and higher intensity
8) Beverage analysis: Identification of particular components in drinks
Identification of anthocyanin in blueberries, blackberries, raspberries and cherries for
quality control in wine.
9) DNA & RNA analysis: Uv-Vis spectroscopy deals with the purity of nucleic acids.
Quick verification of concentration and purity of DNA and RNA.
10) A common technique for quantitative analysis of analytes in QA / QC, analytical
research and government regulatory laboratories is UV-Visible spectrophotometry.
THANK
YOU

UV Visible Spectroscopy

  • 1.
  • 2.
    Contents  Spectroscopy  UVVIS Spectroscopy  UV Visible Spectrum  Principle  Beer and Lambert’s law  Electronic Transitions  Types of electronic transitions  Chromophores  Auxochromes  Spectral shifts  Solvents used in UV VIS Spectroscopy  Factors affecting the position of UV bands  Instrumentation of UV visible Spectrophotometer  Applications
  • 3.
    What is Spectroscopy? SPECTROSCOPY Definition: Spectroscopyis defined as the study of interaction of EMR with matter. It is used for analysis of wide range of samples.  It is the branch of science that deals with the study of interaction of electromagnetic radiation with matter.  The principle is based on the measurement of spectrum of a sample containing atoms / molecules. Spectrum is a graph of intensity of absorbed or emitted radiation by sample verses frequency (ν) or wavelength (λ). Spectrometer is an instrument design to measure the spectrum of a compound.  Spectroscopy is a necessary tool for structure determination.  Organic chemists use spectroscopy as a necessary tool.
  • 4.
    UV VIS Spectroscopy Ultraviolet-visible spectroscopy or ultraviolet-visible spectrophotometry (UV-Vis or UV/Vis) refers to absorption spectroscopy or reflectance spectroscopy in the ultraviolet-visible spectral region. Ultraviolet-Visible (UV-VIS) Spectroscopy is an analytical method that can measure the analyte quantity depending on the amount of light received by the analyte.  Ultraviolet-visible spectroscopy (UV-Vis) in the ultraviolet-visible spectral field refers to absorption spectroscopy or reflectance spectroscopy. In the visible and neighbouring (near-UV and near-infrared (NIR) ranges, this means that it uses light.
  • 5.
    UV visible spectrum FAR(OR) VACCUM UV REGION (10-200nm) NEAR OR QUARTZ UV REGION (200-400nm) VISIBLE REGION (400-780nm)
  • 6.
     UV-Visible Spectroscopyis based on the absorption of ultraviolet light or visible light by chemical compounds when electrons are promoted to higher energy levels, which results in the production of distinct spectra.  Ultraviolet absorption spectroscopy deals with the measurement of energy absorbed when electrons are promoted to higher energy levels. Since UV and visible spectroscopy involves electronic transitions, it is often called electronic spectroscopy.  The ultraviolet spectrum is simply a plot of wavelength of light absorbed versus the absorption intensity (absorbance or transmittance) and is conveniently recorded by plotting molar absorptivity (ε) against wavelength (nm).
  • 7.
    Principle The principle involvedin UV-Visible spectroscopy is absorption spectroscopy. The principle of UV-Visible spectroscopy is based on the fundamental law of absorption called Beer-Lambert’s law. This law governs the absorption of radiation by an absorbing medium (dilute solution).  Beer’s law: According to Beer’s law, when a beam of monochromatic radiation passes through an absorbing medium, the intensity radiation decreases exponentially with an increase in the concentration of the absorbing medium. In other words, absorbance is directly proportional to the concentration of the absorbing substance.  Lambert’s law: According to Lambert’s law, the intensity of a beam monochromatic light decreases exponentially as the light travels through a thickness of homogeneous medium
  • 8.
    Beer’s law The quantitativeaspects of spectrophotometry are based on two laws: Beer’s law: It states that the intensity of a beam monochromatic light decreases exponentially with the concentration of the absorbing molecules. Beer’s law can be expressed mathematically as where I0 is intensity of light incident on the sample, I is intensity of light transmitted by the sample, k is a constant and c is the concentration of the sample. Taking logarithms, Log( I0/I ) is a dimensionless quantity (a logarithm of a ratio of light intensities) and is defined as absorbance. Thus Beer’s law states that absorbance is proportional to concentration.
  • 9.
    Lambert’s law Lambert’s law:It states that the intensity of a beam monochromatic light decreases exponentially as the light travels through a thickness of homogeneous medium, expressed mathematically as l is the thickness of the medium (or path length) through which the light passes and k” is another constant. Taking logarithms, i.e. absorbance is proportional to path length. These two fundamental equations are so similar that they can be combined into one relationship, the Beer–Lambert law or equation, which can be expressed as Here, k is yet another constant, the value of which depends on the units used for the concentration term, c, and on the path length.
  • 10.
    Electronic Transitions The electronsin organic molecules may be involved in bonding as strong bonds, weak n bonds or present in the non-bonding form (lone pair). A variety of energy absorptions for electronic transitions within a molecule is thus possible depending upon the nature of bonding. Electronic energy levels and electronic transitions
  • 11.
    Types of electronictransitions A) Transitions between bonding and antibonding orbitals : two types (i) σ to σ* Transition(120-200nm) : The excitation between bonding sigma and antibonding sigma orbitals (σ to σ* transition) requires large energies. For example, methane, propane, cyclohexane etc., display σ to σ* transitions λͅmax for each of these compounds is below 140 nm. (ii) π to π* Transition : The transition or promotion of an electron from a π bonding orbital to a π* antibonding orbital. These type of transitions occur in compounds containing one or more covalently unsaturated groups like C=C, C≡C, C=O, N=N, aromatic rings, NO2, etc. In unconjugated alkenes, this transition occurs in the range 170-190 nm; ethylene shows λͅmax at around 171 nm. B) Transitions between non-bonding atomic orbitals and antibonding orbitals : two types (i) n to π* Transition : Transitions between non-bonding atomic orbitals holding unshared pair of electrons and antibonding pi-orbitals are called n to π* transitions. Non-bonding electrons are held more loosely than σ bonding electrons and consequently undergo transitions at comparatively longer wavelengths. These transitions occur with compounds containing double bonds involving hetero atoms bearing unshared pair(s) of electrons (e.g., C=S, N=O etc.).
  • 12.
    (ii) n toσ* Transition : The excitation of an electron in an unshared pair (nonbonding electrons) on nitrogen, oxygen, sulphur or halogens to an antibonding σ orbital is called n to σ* transition. This transition is of moderate intensity located around 180nm for alcohols, near 190 nm for ethers or halogen derivatives and in the region of 220 nm for amines. σ to π* Transition and π to σ* Transition : These electronic transition are forbidden transitions and are theoretically possible.
  • 13.
    Chromophores: Originally , theterm chromophore was applied to the system responsible for imparting colour to a compound. The term has been retained within an extended interpretation to imply any functional group that absorbs electromagnetic radiation, whether or not a 'color' is thereby produced. The functional group containing multiple bonds capable of absorbing radiations above 200nm due to n to π* and π to π* examples are: C=O, C=C, C=N, N=N, C ≡ C, C ≡ N, C = S etc.
  • 14.
    Auxochrome The functional groupsattached to a chromophore which modifies the ability of the chromophore to absorb light, altering the wavelength or intensity of absorption. It is an auxiliary group which interacts with the chromophore causing a bathochromic shift. It enhances the colour imparting properties of a chromophore without being itself a chromophore. examples are: methyl, hydroxyl, alkoxy, halogens, and amino and substituted amino groups (OR,NH2, NHR and NR2).
  • 15.
  • 16.
    Bathochromic shift (RedShift): It is a shift to lower energy or longer wavelength. It is caused by change of medium (π to π* transitions undergo bathochromic shift with an increase in the polarity of the solvent) or when auxochrome is attached to C=C double bond for example, ethene absorbs at λͅmax = 175 nm while 1-butene absorbs at λͅmax = 190 nm. The bathochromic shift is progressive as the number of alkyl groups increases.
  • 17.
    Hypsochromic shift (BlueShift): It is a shift to higher energy or shorter wavelength. It is caused by change of medium (n to π* transitions undergo hypsochromic shift with an increase in the polarity of the solvent) for example, acetone absorbs at 280 nm in hexane and at 265 nm in water. This shift results from hydrogen bonding which lowers the energy of n orbital of oxygen atom. This can also be produced when an auxochrome is attached to double bonds e.g. C=O) where n electrons are available.
  • 18.
    Hyperchromic effect: It isthe effect leading to increased absorption intensity. If auxochrome introduces to the compound, the intensity of absorption increases. For example, phenolate ion has more absorption intensity than phenol. Hypochromic effect: It is the effect leading to decreased absorption intensity, for example, benzoate ion has less absorption intensity than benzoic acid.
  • 19.
    Solvents used inUV VIS Spectroscopy Solvent λ of absorption Water 191 nm Ether 215 nm Methanol 203 nm Ethanol 204 nm Chloroform 237 nm Carbon tetrachloride 265 nm Benzene 280 nm Tetrahydrofuran 220 nm
  • 20.
    Factors affecting theposition of UV bands: Effect of solvent: The absorption spectrum depends on the solvent in which the absorbing substance is dissolved. The choice of solvent can shift peaks to shorter or longer wavelengths. This depends on the nature of the interaction of the particular solvent with the environment of the chromophore in the molecule under study. Water and alcohols can form hydrogen bonds which results the shifting of the bands of polar substances. Since polarities of the ground and excited state of a chromophore are different, hence a change in the solvent polarity will stabilize the ground and excited states to different extent causing change in the energy gap between these electronic states. Highly pure, non-polar solvents such as saturated hydrocarbons do not interact with solute molecules either in the ground or excited state and the absorption spectrum of a compound in these solvents is similar to the one in a pure gaseous state.
  • 21.
    (i) π toπ* Transitions: In case of π to π* transitions, the excited states are more polar than the ground state. If a polar solvent is used the dipole–dipole interaction reduces the energy of the excited state more than the ground state. Thus a polar solvent decreases the energy of π to π* transition and hence the absorption in a polar solvent such as ethanol will be at a longer wavelength (red shift) than in a non-polar solvent such as hexane.
  • 22.
    (ii) n toπ* transitions: In case of n to π* transitions, the polar solvents form hydrogen bonds with the ground state of polar molecules more readily than with their excited states. Consequently the energy of ground state is decreased which further causes the increase in energy difference between the ground and excited energy levels. Therefore, absorption maxima resulting from n to π* transitions are shifted to shorter wavelengths (blue shift) with increasing solvent polarity.
  • 23.
    Effect of SamplepH: The absorption spectra of certain aromatic compounds such as phenols and anilines change on changing the pH of the solution. Phenols and substituted phenols are acidic and display sudden changes in their absorptions maxima upon the addition of a base. After the removal of the phenolic proton, we get phenoxide ion. In the phenoxide ion lone pairs on the oxygen is delocalized over the π-system of the aromatic ring and increases the conjugation of the same. Extended conjugation leads to a decrease in the energy difference between the HOMO and LUMO orbitals, which results in red or bathochromic shift , along with an increase in the intensity of the absorption.
  • 24.
    Similarly, an aromaticamine gets protonated in an acidic medium which disturb the conjugation between the lone pair on nitrogen atom and the aromatic π-system. As a result, blue shift or hypsochromic shift (to shorter wavelength) is observed along with a decrease in intensity.
  • 25.
    Instrumentation of UVVisible spectrophotometer:
  • 26.
    A) Sources ofradiation: It must be stable, must provide sufficient intensity of radiation and supply continuous radiation over the entire wavelength. A) Hydrogen or deuterium discharge lamp: The hydrogen discharge lamp consists of hydrogen gas under relatively high pressure through which there is an electrical discharge. The hydrogen molecules are excited electrically and emit UV radiation. This causes the hydrogen to emit a continuum (broad band) rather than a simple hydrogen line spectrum. The lamps are stable, robust, and widely used. If deuterium (D,) is used instead of hydrogen, the emission intensity is increased by as much as a factor of 3 at the short-wavelength end of the UV range.
  • 27.
    B) Tungsten filamentlamp: The tungsten lamp is similar in its functioning to an electric light bulb. It is a tungsten filament heated electrically to white heat. It has two shortcomings. The intensity of radiation at short wavelengths (<350 nm) is small. Furthermore, to maintain a constant intensity, the electrical current to the lamp must be carefully controlled. However, the lamps are generally stable, robust, and easy to use. Typically, the emission intensity varies with wavelength. C) Mercury arc: In this, the mercury vapour is under high pressure, and the excitation of mercury atoms is done by electric discharge. The mercury arc, a standard source for much ultraviolet work, is generally not suitable for continuous spectral studies because of the presence of sharp lines or bands.
  • 28.
    D) Xenon dischargelamp: In these lamps, xenon gas is stored under pressure in the range of 10-30 atmospheres. The xenon lamp possesses two tungsten electrodes separated by about 8 mm. When an intense arc is formed between two tungsten electrodes by applying a low voltage, the ultraviolet light is produced. The intensity of ultraviolet radiation produced by xenon discharge lamp is much greater than that of hydrogen lamp.
  • 29.
    B)Monochromator (wavelength selectors): Themonochromator is used to disperse the radiation according to the wavelength. The essential elements of a monochromator are an entrance slit, a dispersing element and an exit slit. The entrance slit sharply defines the incoming beam of heterochromatic radiation. The dispersing element disperses the heterochromatic radiation into its component wavelengths whereas exit slit allows the nominal wavelength together with a band of wavelengths on either side of it. The position of the dispersing element is always adjusted by rotating it to vary the nominal wavelength passing through the exit slit. The dispersing element may be a prism or grating. The prisms are generally made of glass, quartz fused silica. Glass has the highest resolving power but it is not transparent to radiations having the wavelength between 200 and 300 nm, because glass absorbs strongly in this region. Quartz and fused silica prisms which are transparent throughout the entire UV range are widely used in UV spectrophotometers.
  • 30.
    C)Sample containers orsample cells(Cuvettes): The cells that are to contain samples for analysis should fulfil three main conditions: They must be uniform in construction; the thickness must be constant and surfaces facing the incident light must be optically flat. The material of construction should be inert to solvents. They must transmit light of the wavelength used. The most commonly used cells are made of quartz or fused silica. Cells of pathlength 1cm are used.
  • 31.
    D) Detectors Photomultiplier tube: Aphotomultiplier tube is a combination of a photodiode and an electron multiplying amplifier. A photomultiplier tube consists of an evacuated tube which contains one photo-cathode and 9-16 electrodes known as dynodes. When radiation falls on a metal surface of the photocathode, it emits electrons. The electrons are attracted towards the first dynode which is kept at a positive voltage. When the electrons strike the first dynode, more electrons are emitted by the surface of dynode; these emitted electrons are then attracted by a second dynode where similar type of electron emission takes place. The process is repeated over all the dynodes present in the photomultiplier tube until a shower of electrons reaches the collector. The number of electrons reaching the collector is a measure of the intensity of light falling on the detector. The dynodes are operated at an optimum voltage that gives a steady signal.
  • 32.
    Photo voltaic cell(Barrier Layer Cell): The barrier cell consists of a semiconductor, such as selenium, which is deposited on a strong metal base, such as iron. Then a very thin layer of silver or gold is sputtered over the surface of the semiconductor to act as a second collector electrode. The radiation falling on the surface produces electrons at the selenium silver interface. A barrier exists between the selenium and iron which prevents the electrons from flowing into iron. The electrons are therefore accumulated on the silver surface. The accumulation of electrons on the silver surface produces an electrical voltage difference between the silver surface and the base of cell. If the external circuit has a low resistance, a photocurrent will flow which is directly proportional to the intensity of incident radiation beam.
  • 33.
    Photo tube (Photocell): Itconsists of a high-sensitive cathode in the form of a half-cylinder of metal which is contained in an evacuated tube. The anode is also present in the tube which is fixed more or less along the axis of the tube. The inside surface of the photocell is coated with a light sensitive layer. When the light is incident upon a photocell, the surface coating emits electrons. These are attracted and collected by an anode. The current, which is created between the cathode and anode, is regarded as a measure of radiation falling on the detector. Silicon Photodiode: A silicon photodiode is a solid-state device which converts incident light into an electric current. It consists of a shallow diffused p-n junction, normally a p-on-n configuration. (p-n junction is an interface or a boundary between two semiconductor material types, namely the p-type and the n- type, inside a semiconductor. The p-side or the positive side of the semiconductor has an excess of holes and the n-side or the negative side has an excess of electrons.)
  • 34.
    Applications 1) Qualitative Analysis:Limited utility, but can predict presence or absence of certain functional groups 2) Detection of Impurities: for example, benzene as impurity in ethanol 3) Quantitative analysis: directly or by making calibration curve 4) Pharmaceutical analysis: UV-Vis spectroscopy is an indispensable equipment in production of pharmaceutics. Overlap of absorbance peaks in uv spectra can be used to find out the pharmaceutical compounds using mathematical derivatives. Chlortetracycline (antibiotic) and benzocaine (anesthetic) are identified simultaneously in veterinary powder formulation using first mathematical derivative. 5) Determination of strength of H-bonding: It is based on shift observed in polar solvents, for example, acetone absorbs at 279 (121kcal/mole) & 264.5 (126kcal/mole) nm resp. in hexane and water
  • 35.
    6) Study ofChemical reactions (Spectrophotometric titrations) : provided that absorption spectra of reactants and products are considerably different. 7) Study of geometrical isomerism: It is established that trans isomer displays longer wavelength absorption and higher intensity 8) Beverage analysis: Identification of particular components in drinks Identification of anthocyanin in blueberries, blackberries, raspberries and cherries for quality control in wine. 9) DNA & RNA analysis: Uv-Vis spectroscopy deals with the purity of nucleic acids. Quick verification of concentration and purity of DNA and RNA. 10) A common technique for quantitative analysis of analytes in QA / QC, analytical research and government regulatory laboratories is UV-Visible spectrophotometry.
  • 36.