Downloaded 129 times

![UNARY PHASE DIAGRAM (ONE COMPONENT SYSTEM)
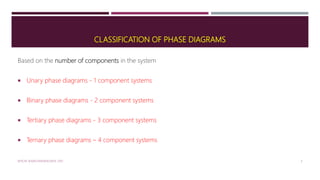
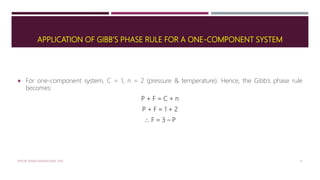
The simplest and easiest type of phase diagram to understand is that for a one-component system, in
which composition is held constant (i.e., the phase diagram is for a pure substance); this means that
pressure and temperature are the variables.
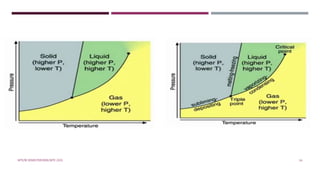
This one-component phase diagram (or unary phase diagram) [sometimes also called a pressure–
temperature (or P–T) diagram] is represented as a two-dimensional plot of pressure (ordinate, or
vertical axis) versus temperature (abscissa, or horizontal axis).
Illustration and demonstration of this phase diagram is done taking example of H₂O .
MTE/III SEMESTER/MSE/MTE 2101 7](https://image.slidesharecdn.com/lecture15-161223032443/85/Phase-Diagram-One-Component-System-7-320.jpg)


The document introduces phase diagrams, which graphically represent the relationship between temperature, pressure, and composition of engineering materials and their properties. It classifies phase diagrams based on the number of components (unary, binary, tertiary, and quaternary) and discusses Gibbs's phase rule, which calculates the coexistence of phases in equilibrium systems. The content includes details on how to interpret unary phase diagrams for one-component systems, highlighting equilibrium conditions, phase boundaries, and critical points.