Downloaded 29 times


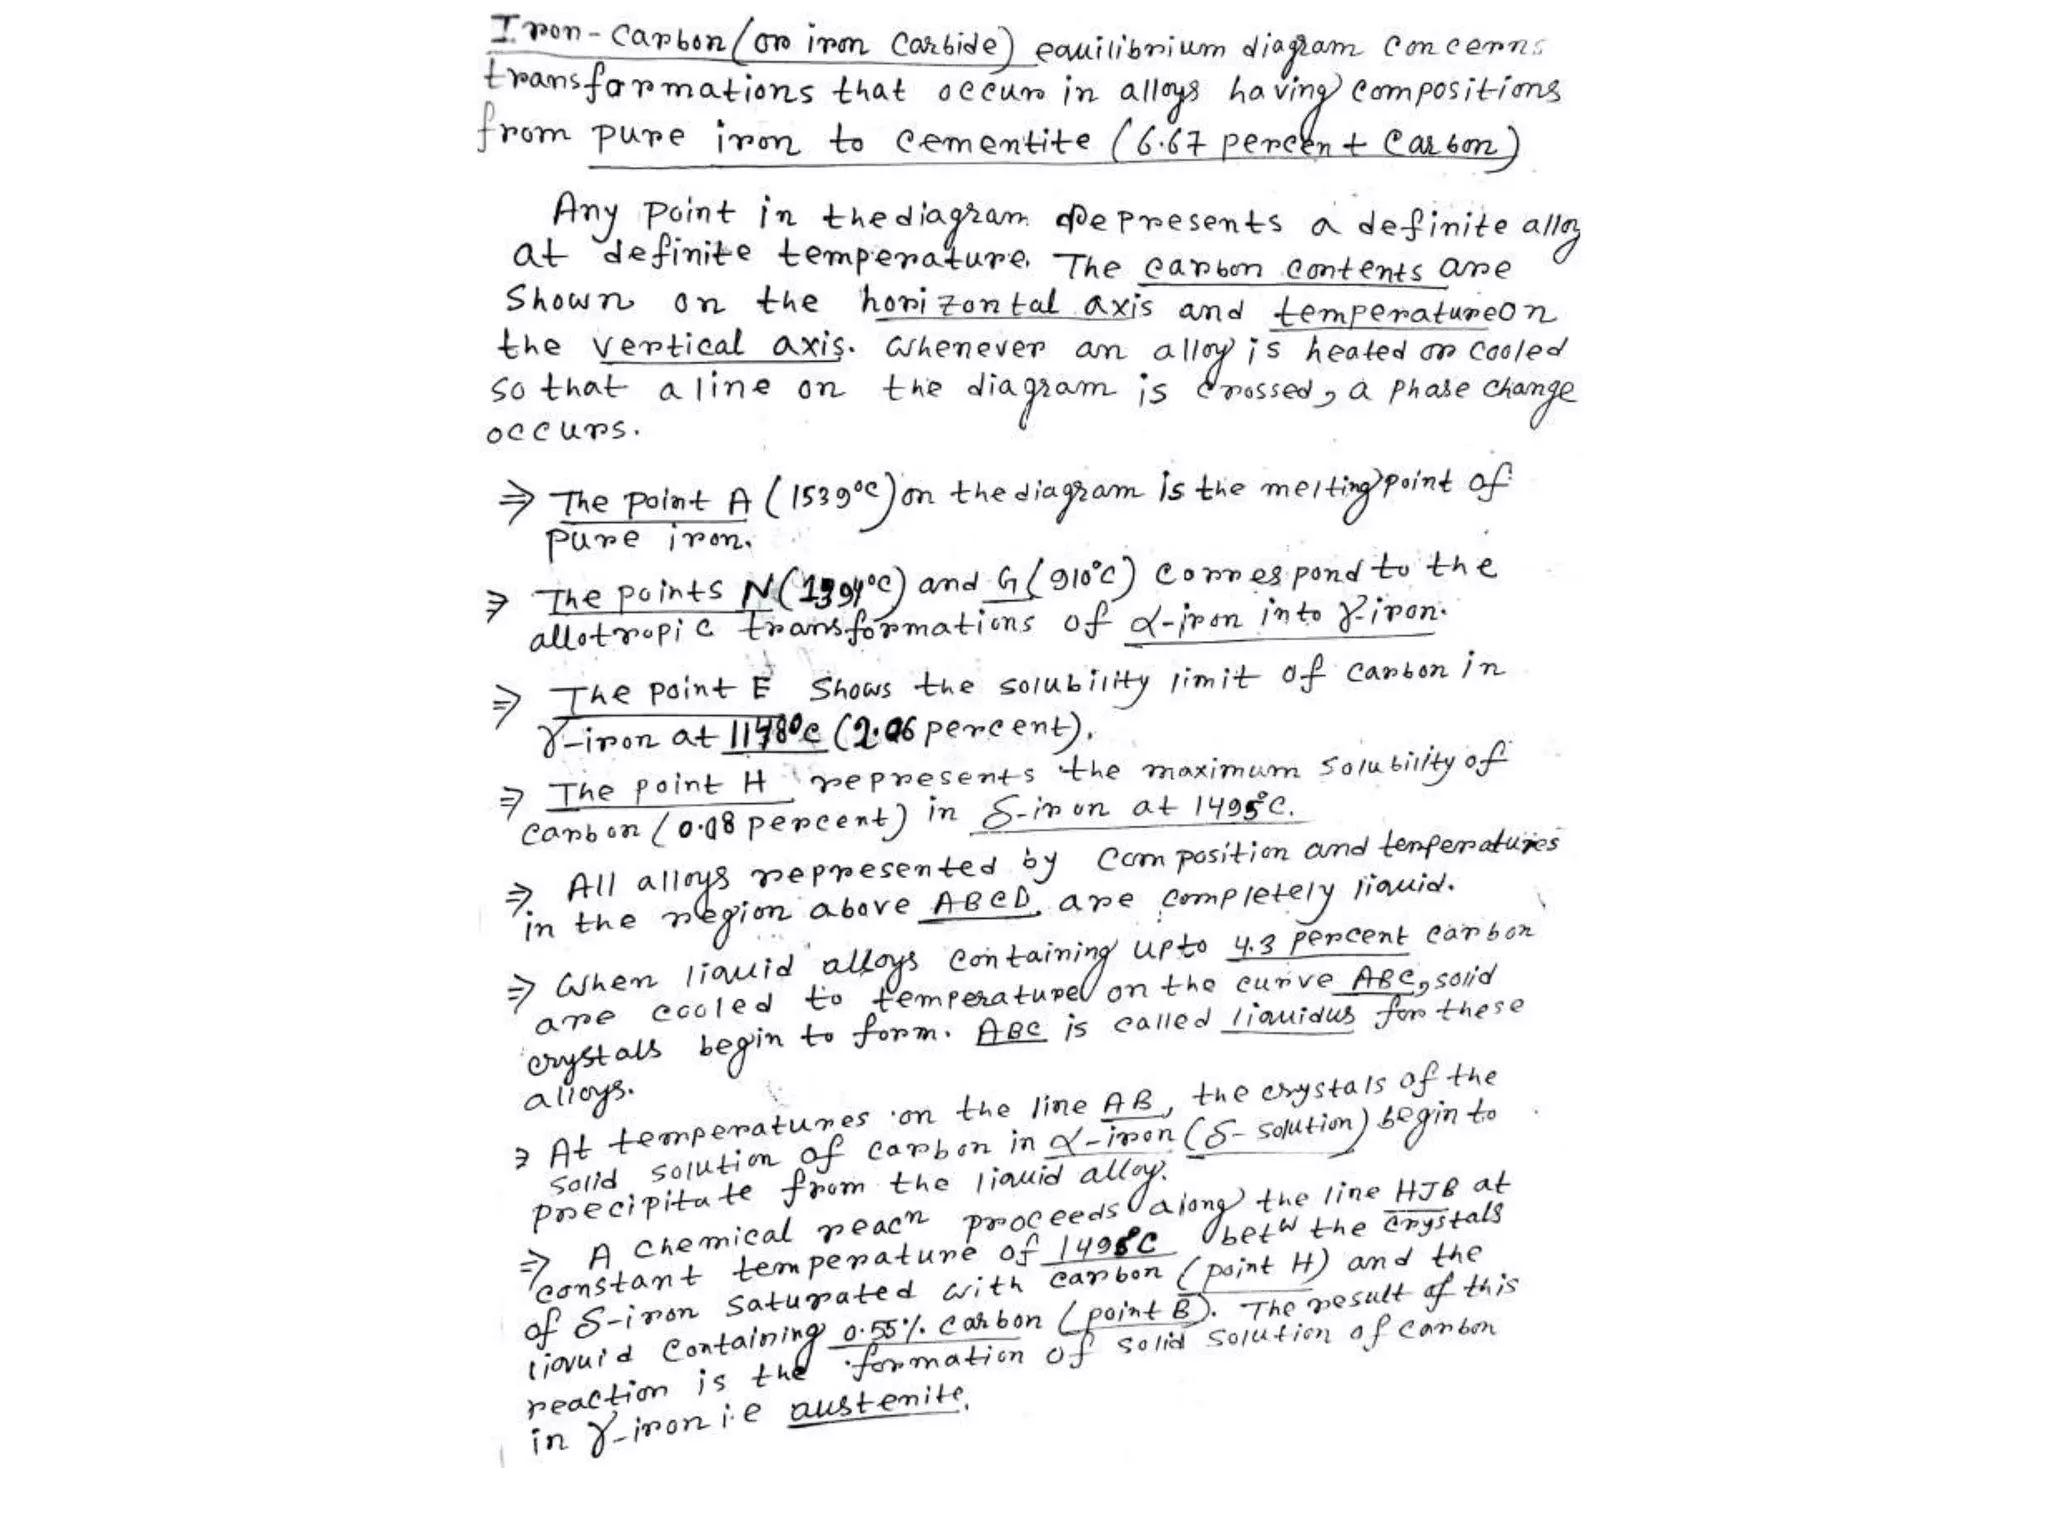


![FE-C BINARY SYSTEM – PHASE TRANSFORMATIONS
(CONTD….)
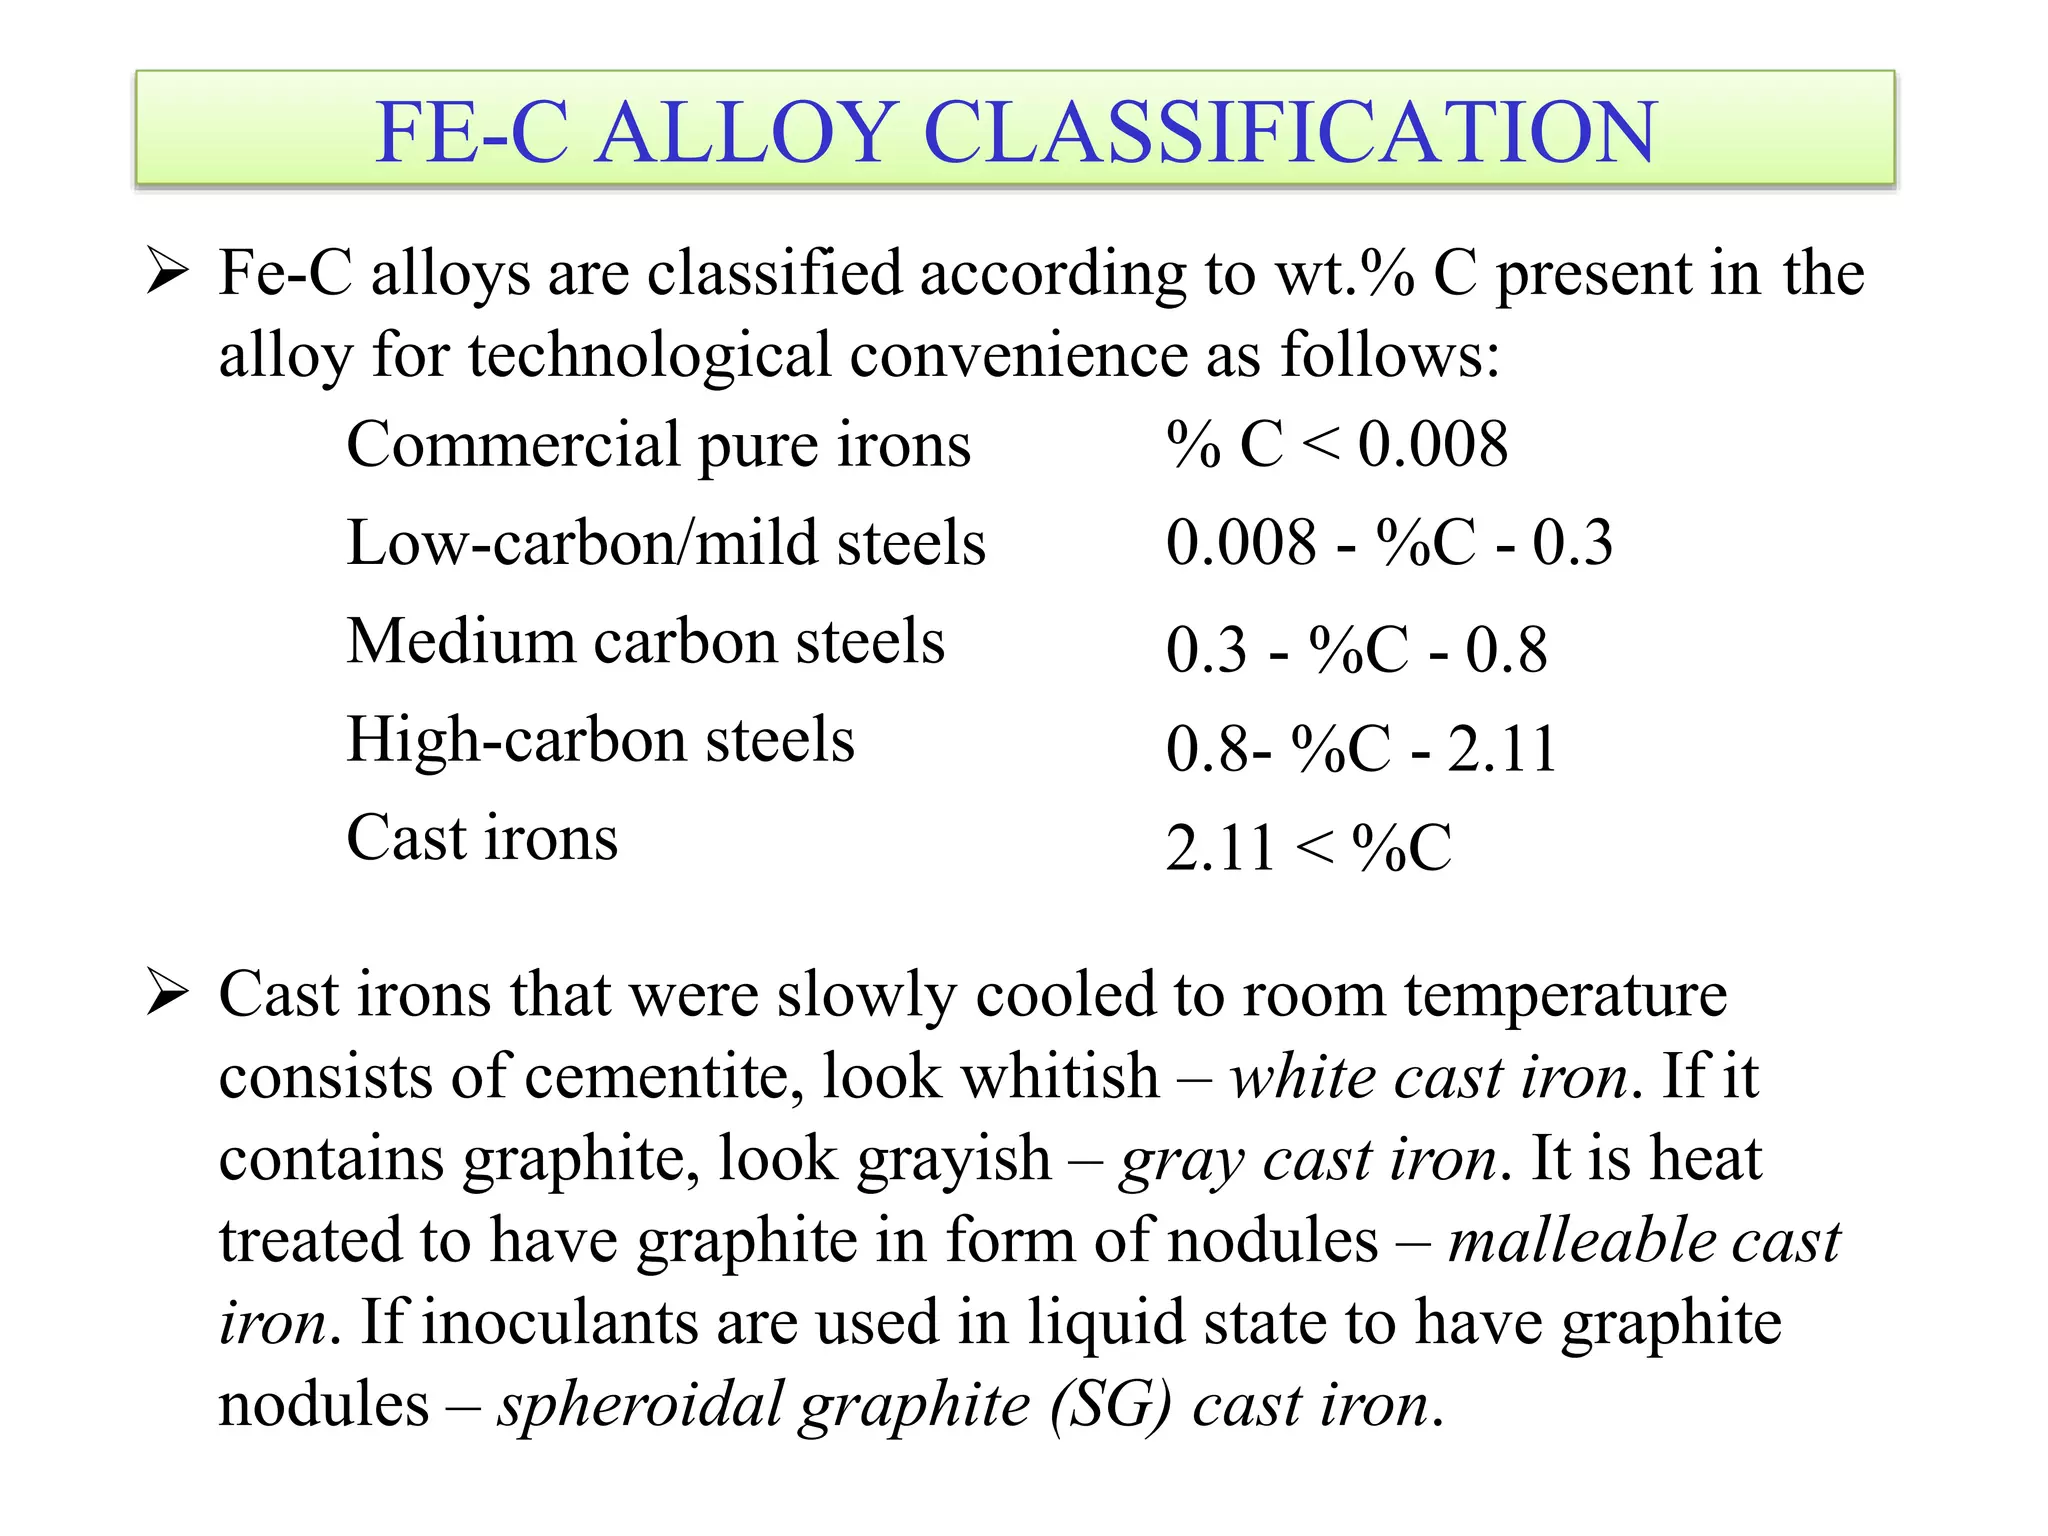
Fe-Fe3C phase diagram is characterized by five individual
phases,: α–ferrite (BCC) Fe-C solid solution, γ-austenite
(FCC) Fe-C solid solution, δ-ferrite (BCC) Fe-C solid
solution, Fe3C (iron carbide) or cementite - an inter-metallic
compound and liquid Fe-C solution and four invariant
reactions:
- peritectic reaction at 1495 C and 0.16%C, δ-ferrite + L
↔ γ-iron (austenite)
-monotectic reaction 1495 C and 0.51%C, L ↔ L + γ-iron
(austenite)
-eutectic reaction at 1147 C and 4.3 %C, L ↔ γ-iron +
Fe3C (cementite) [ledeburite]
-eutectoid reaction at 723 C and 0.8%C, γ-iron ↔ α–
ferrite + Fe3C (cementite) [pearlite]](https://image.slidesharecdn.com/phasediagrams-200410142823/75/Phase-Diagrams-45-2048.jpg)


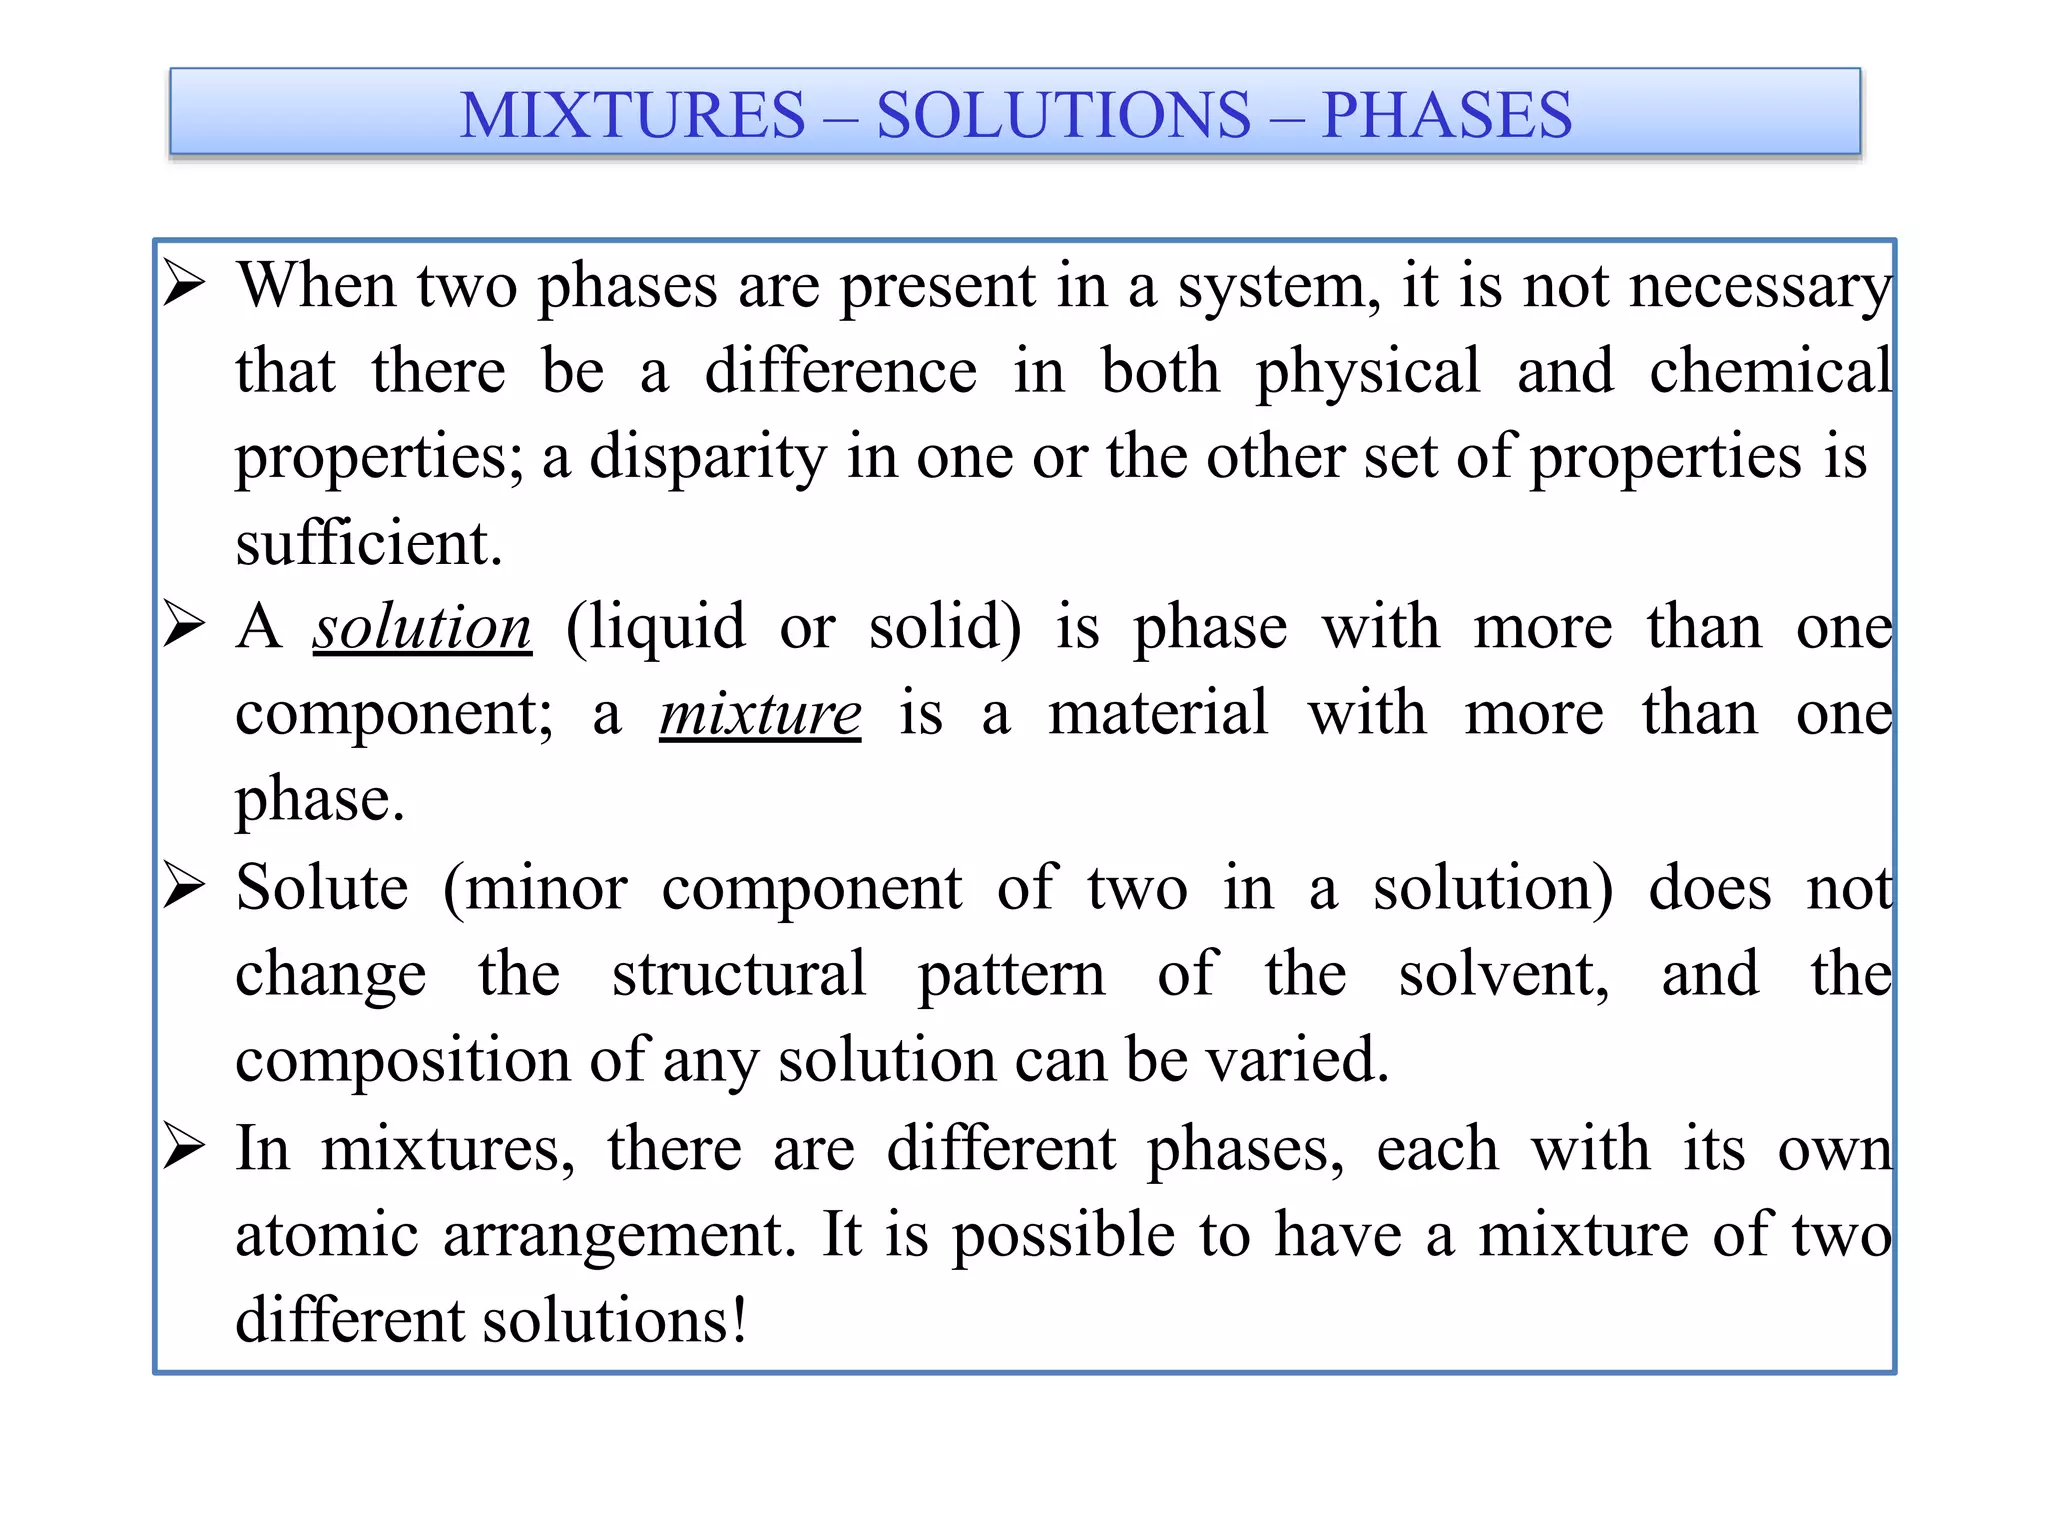
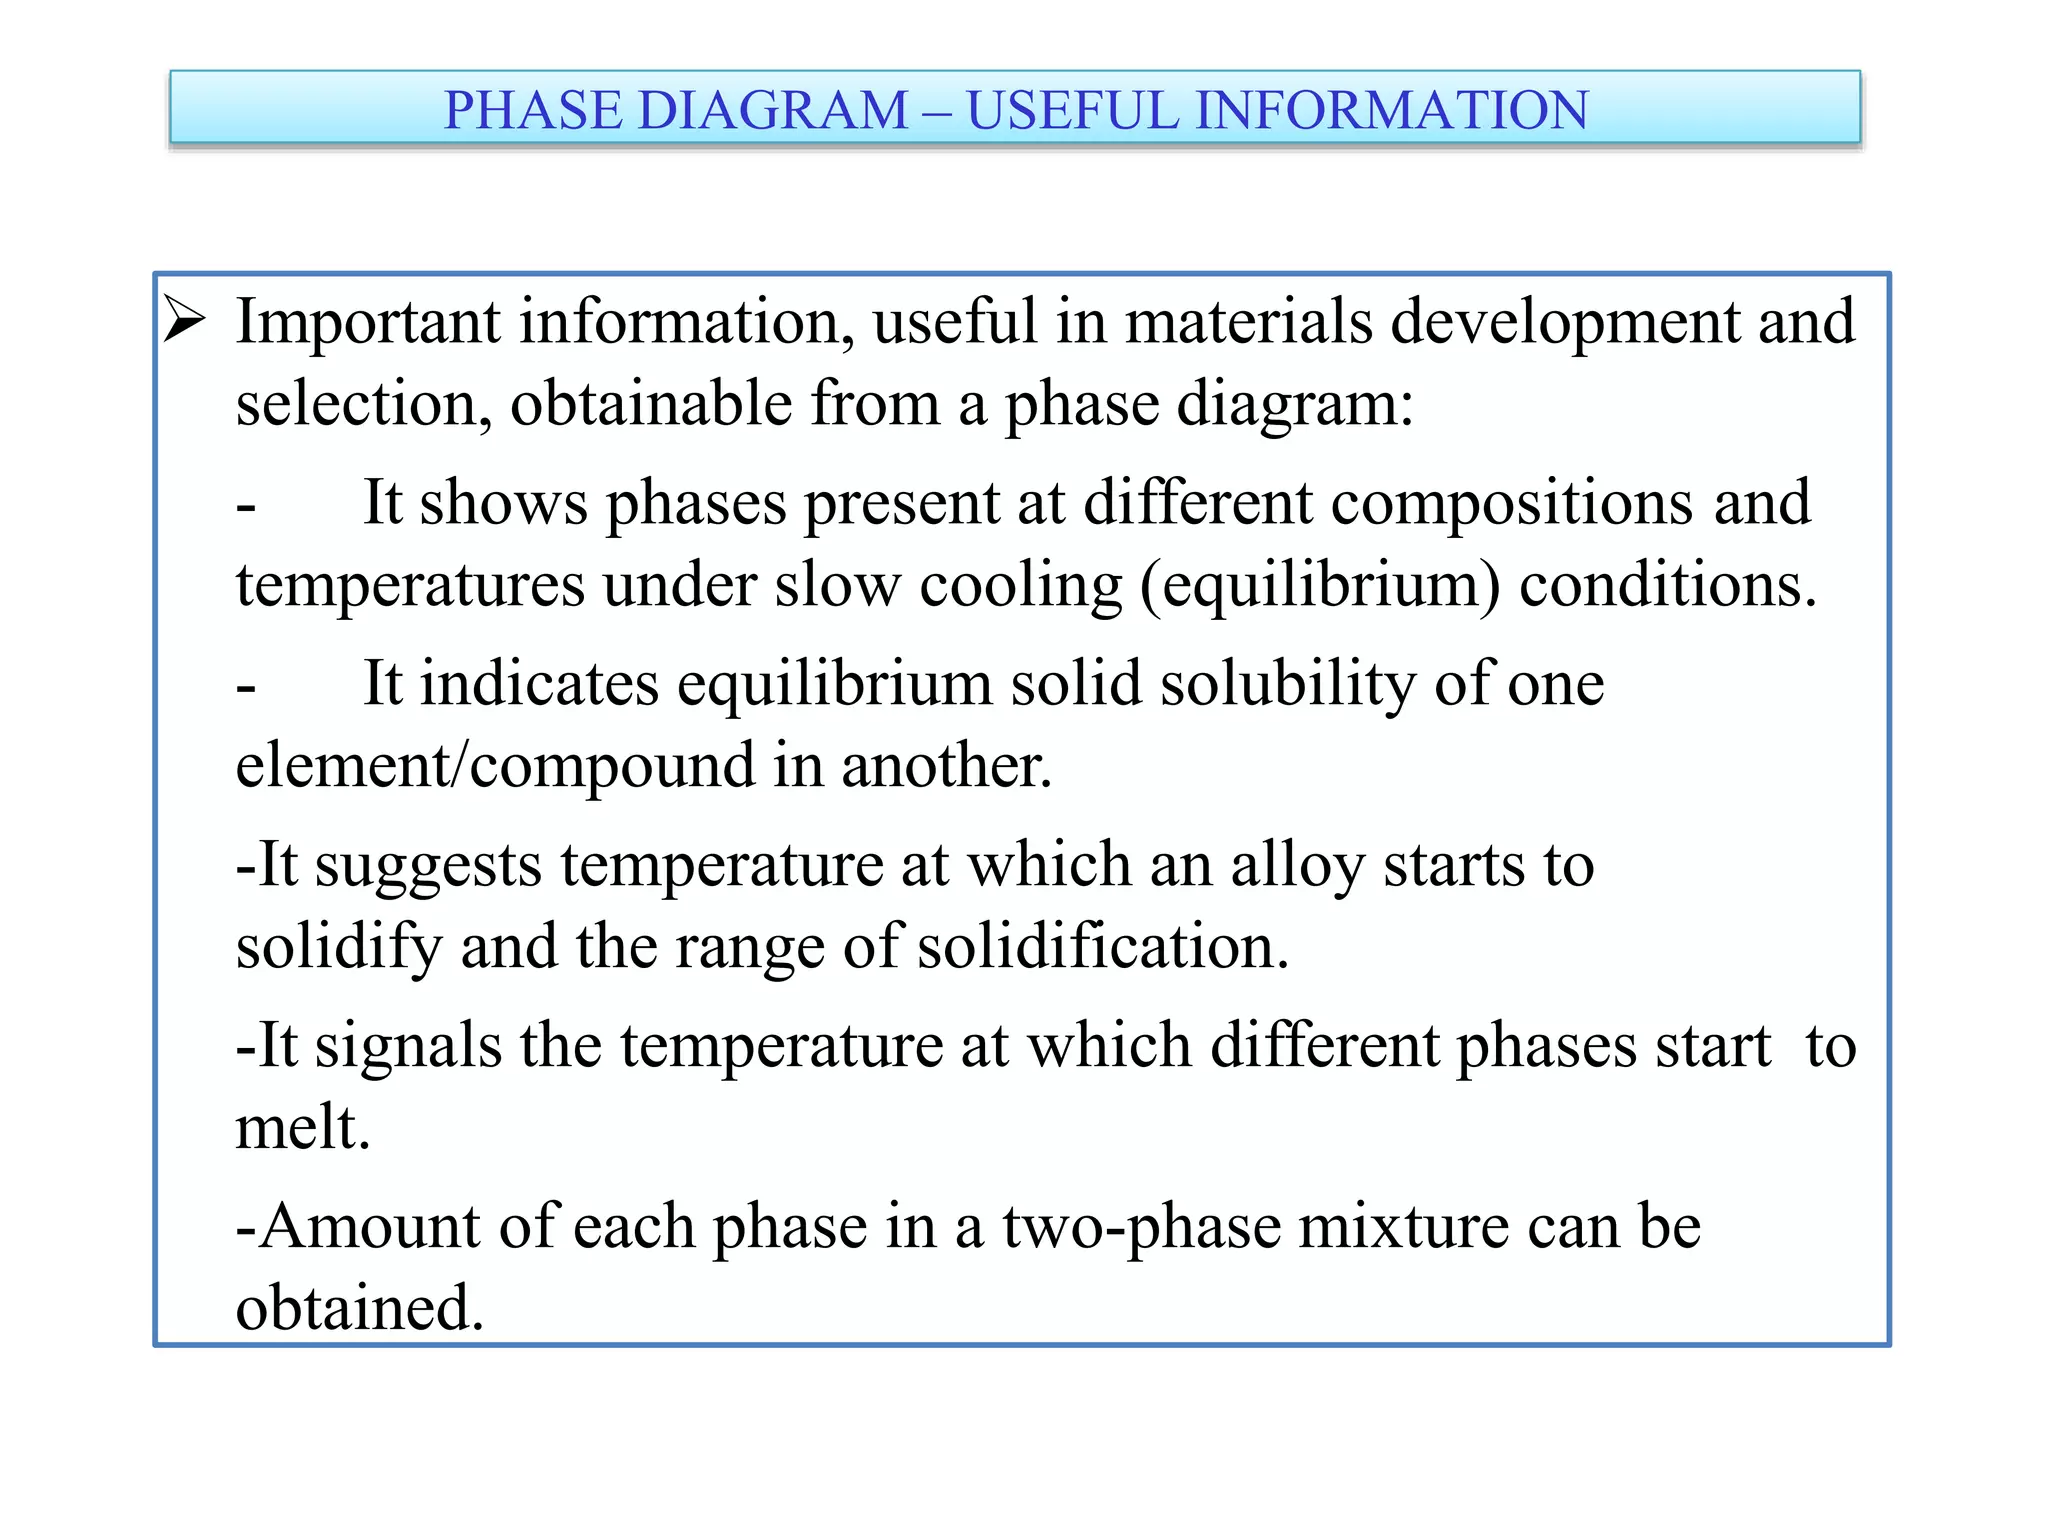
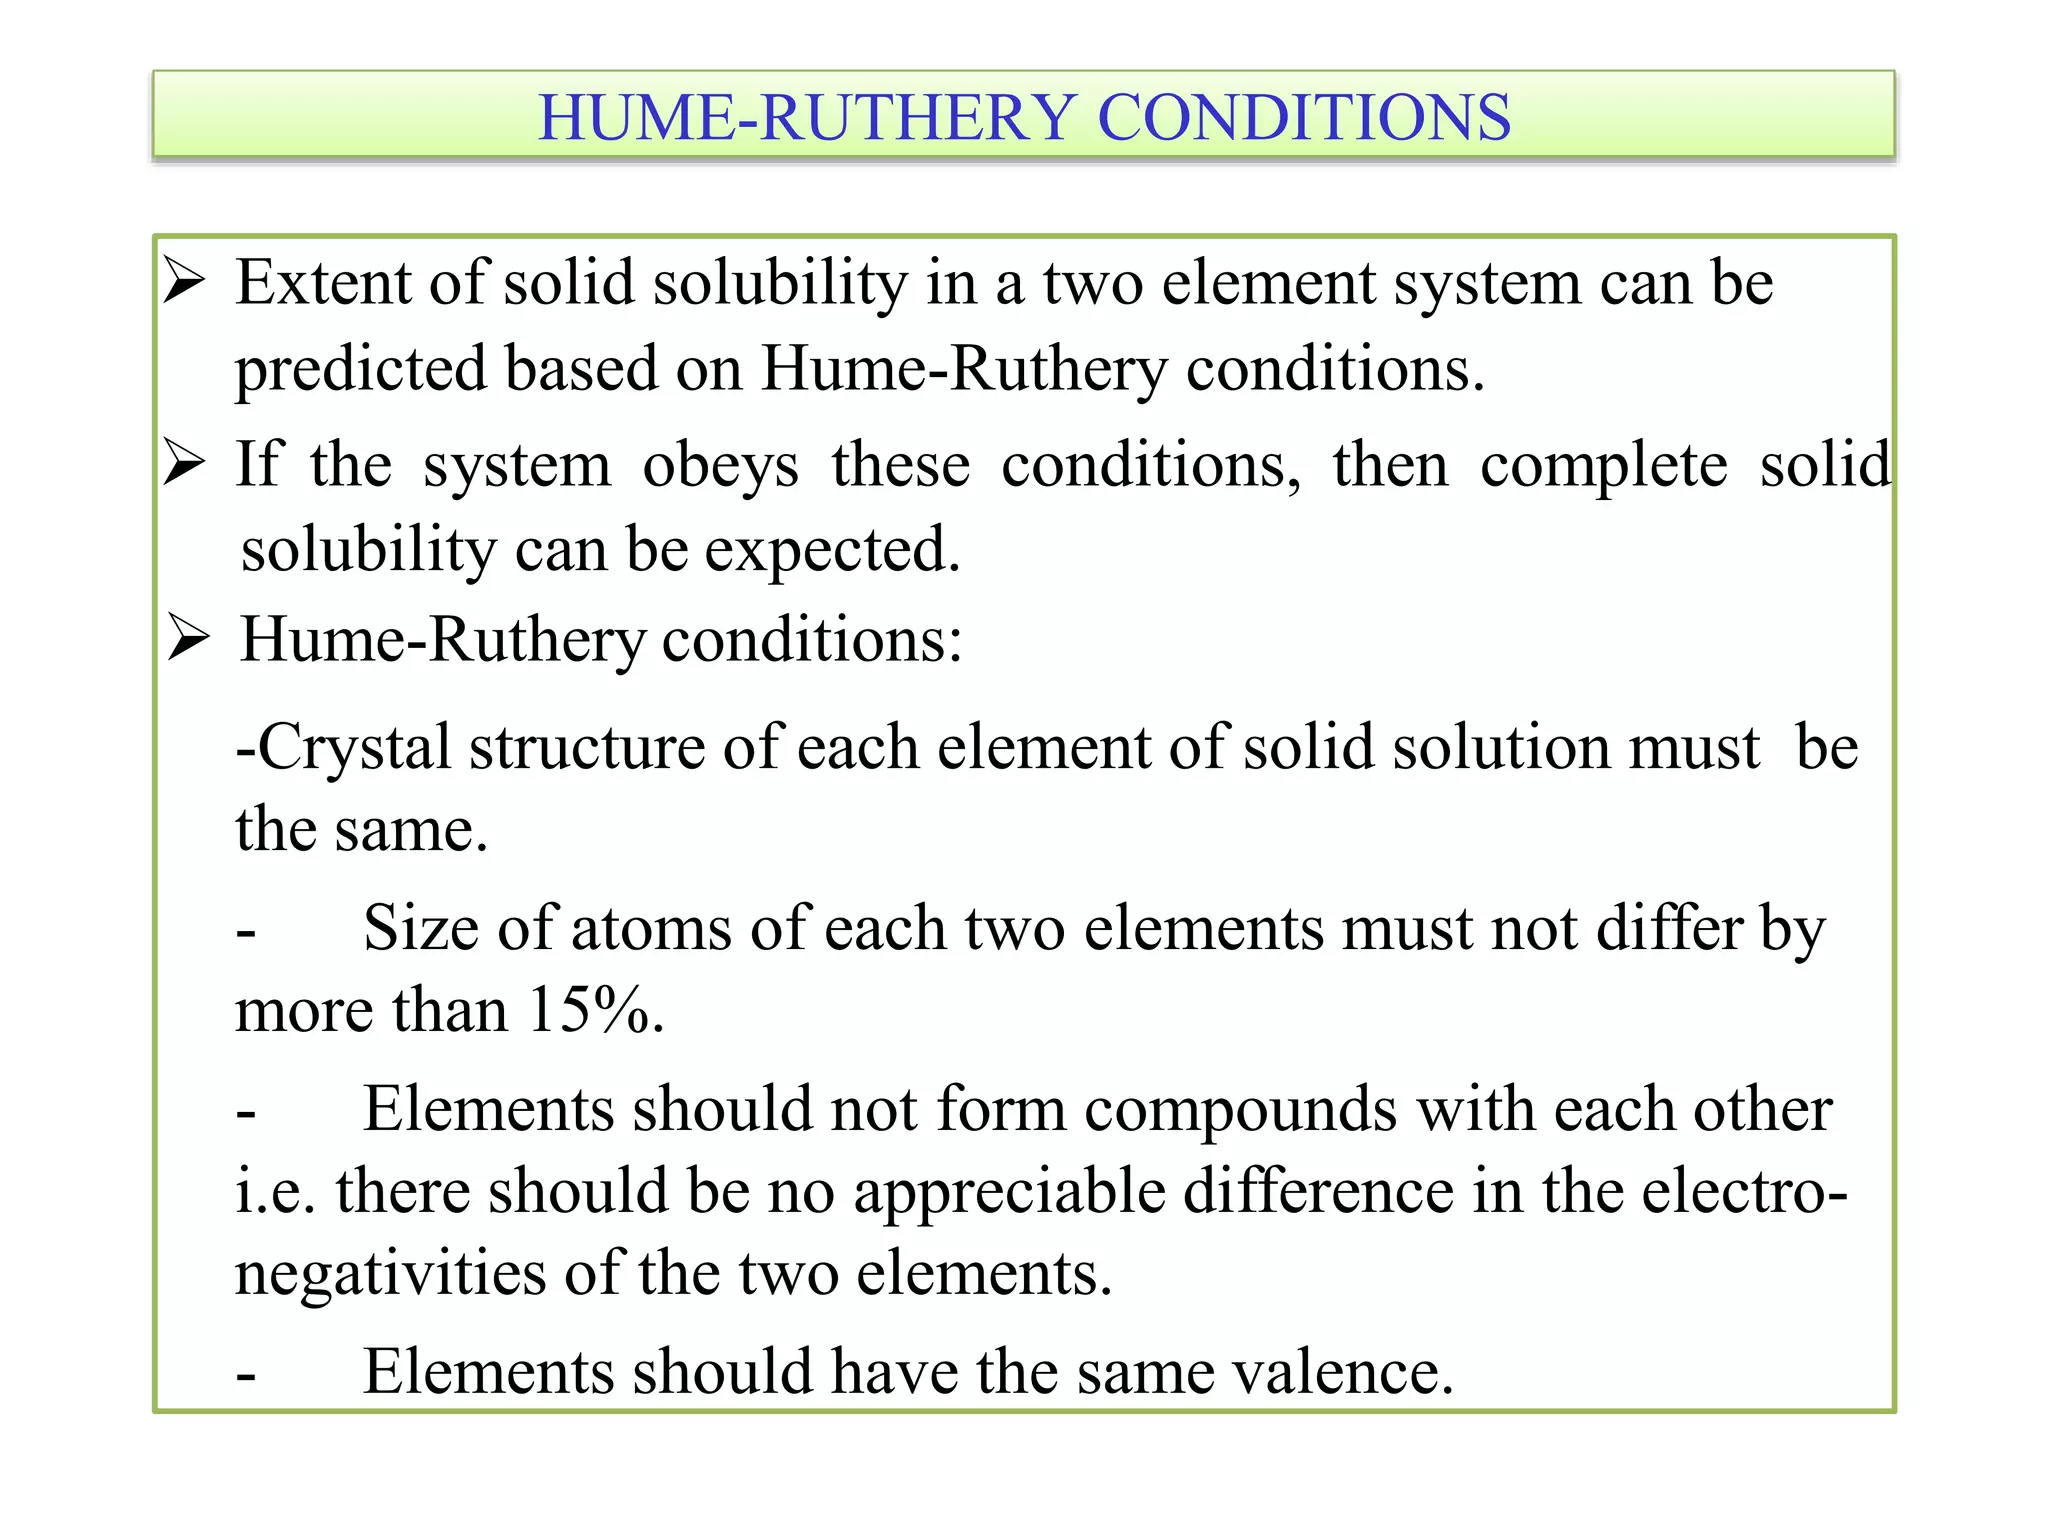
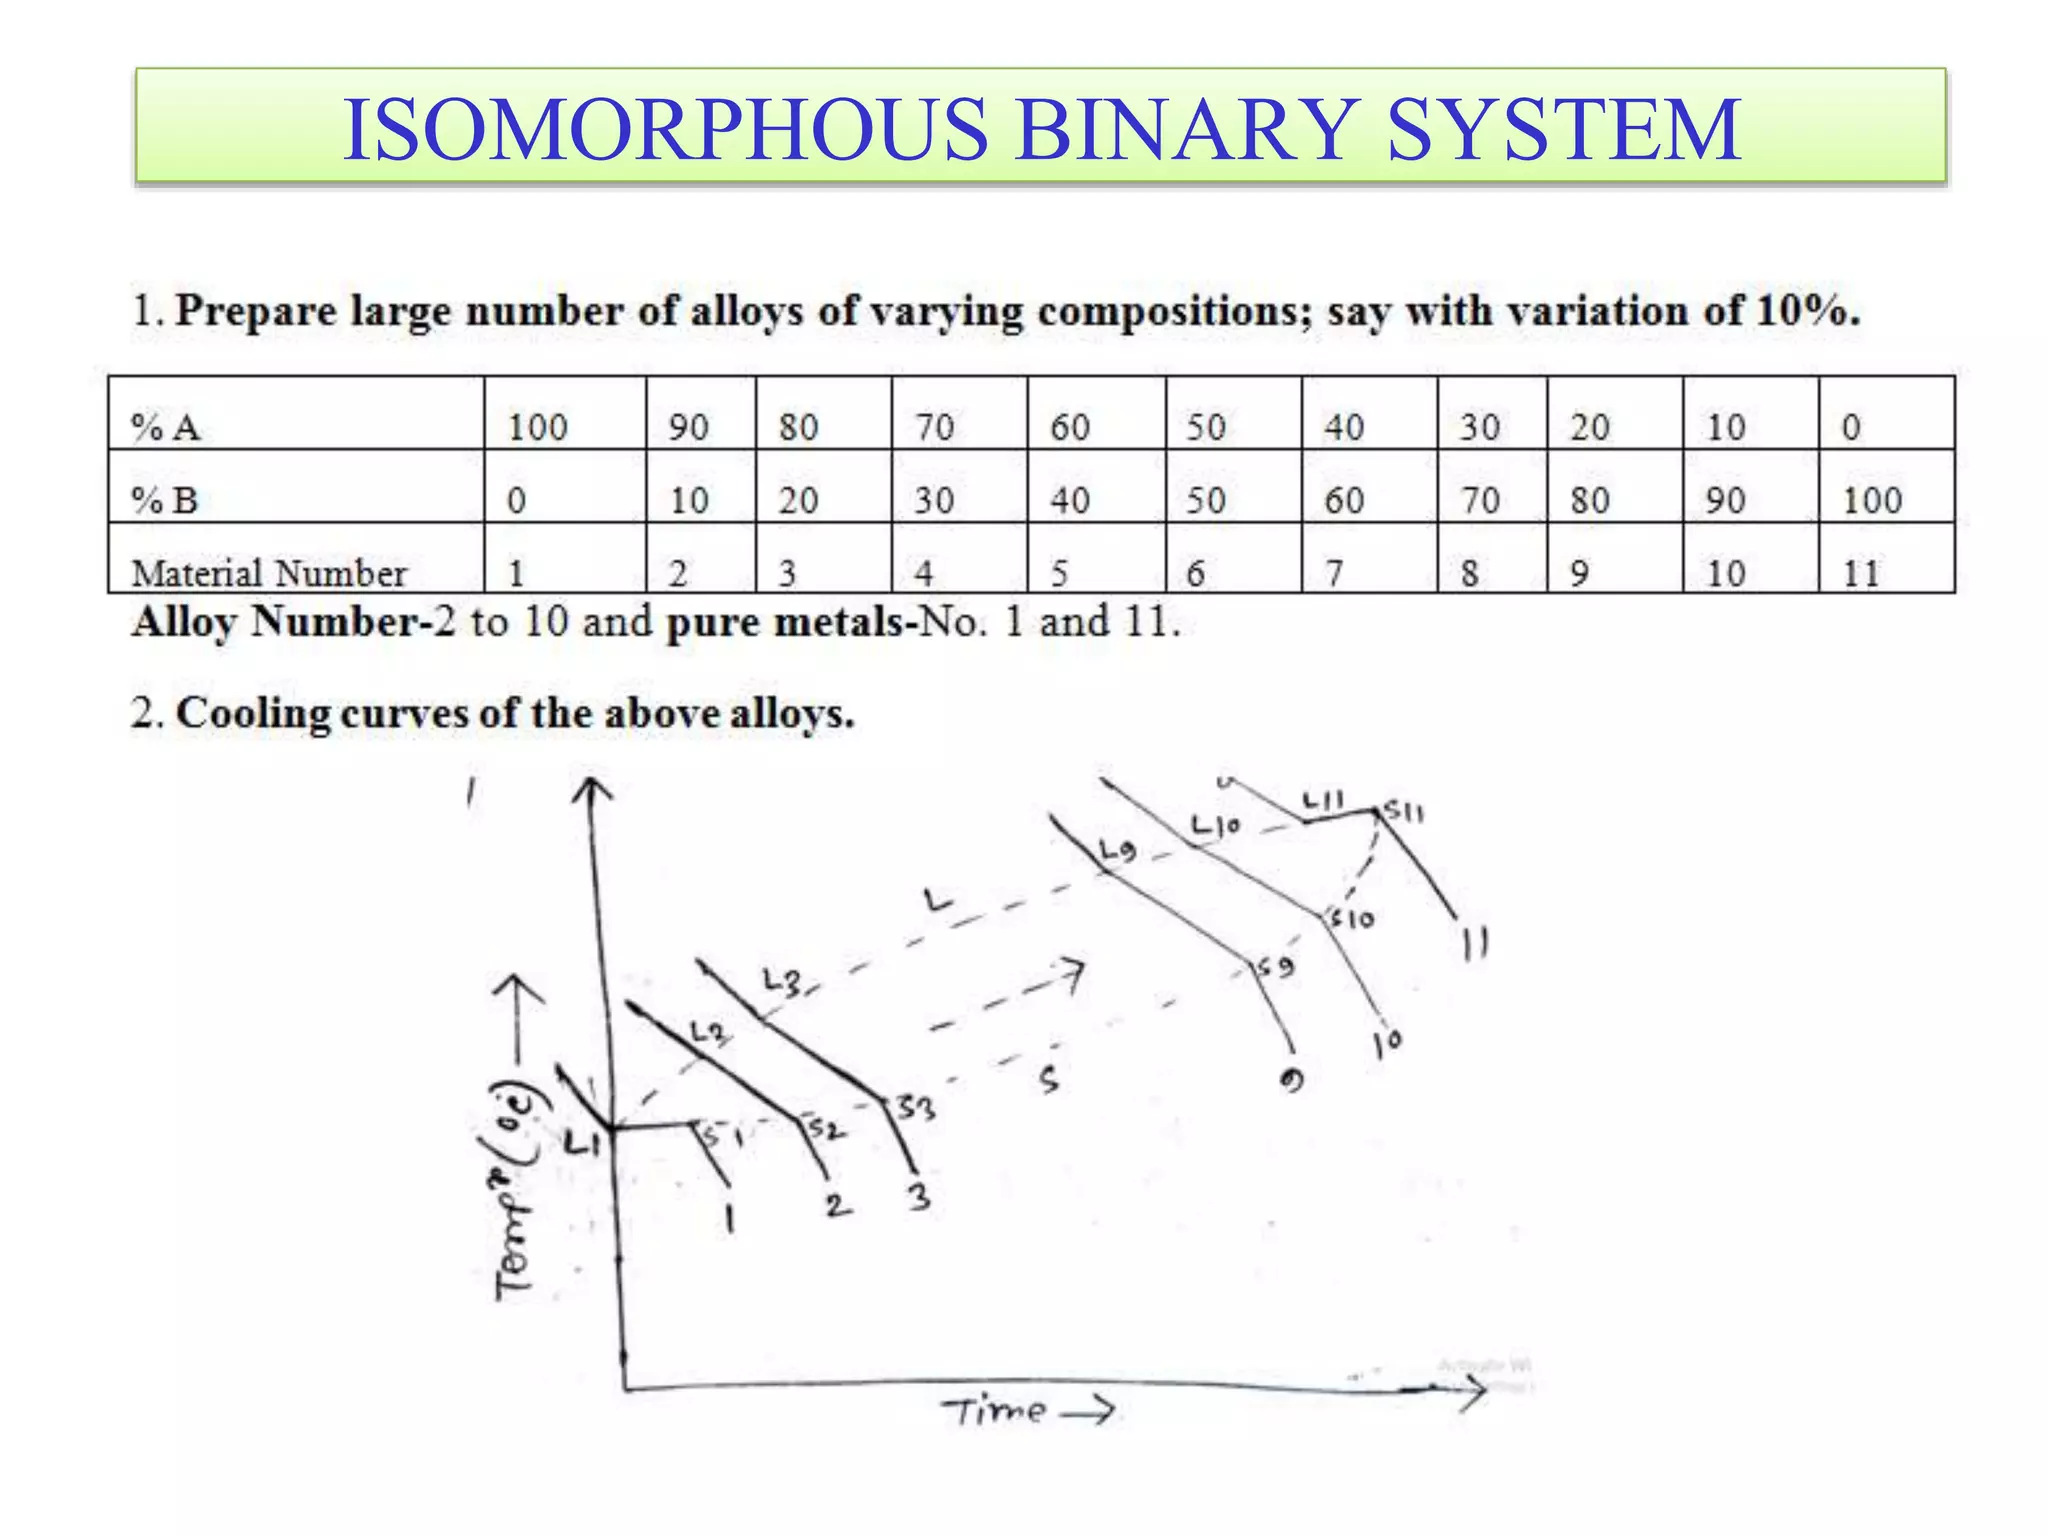
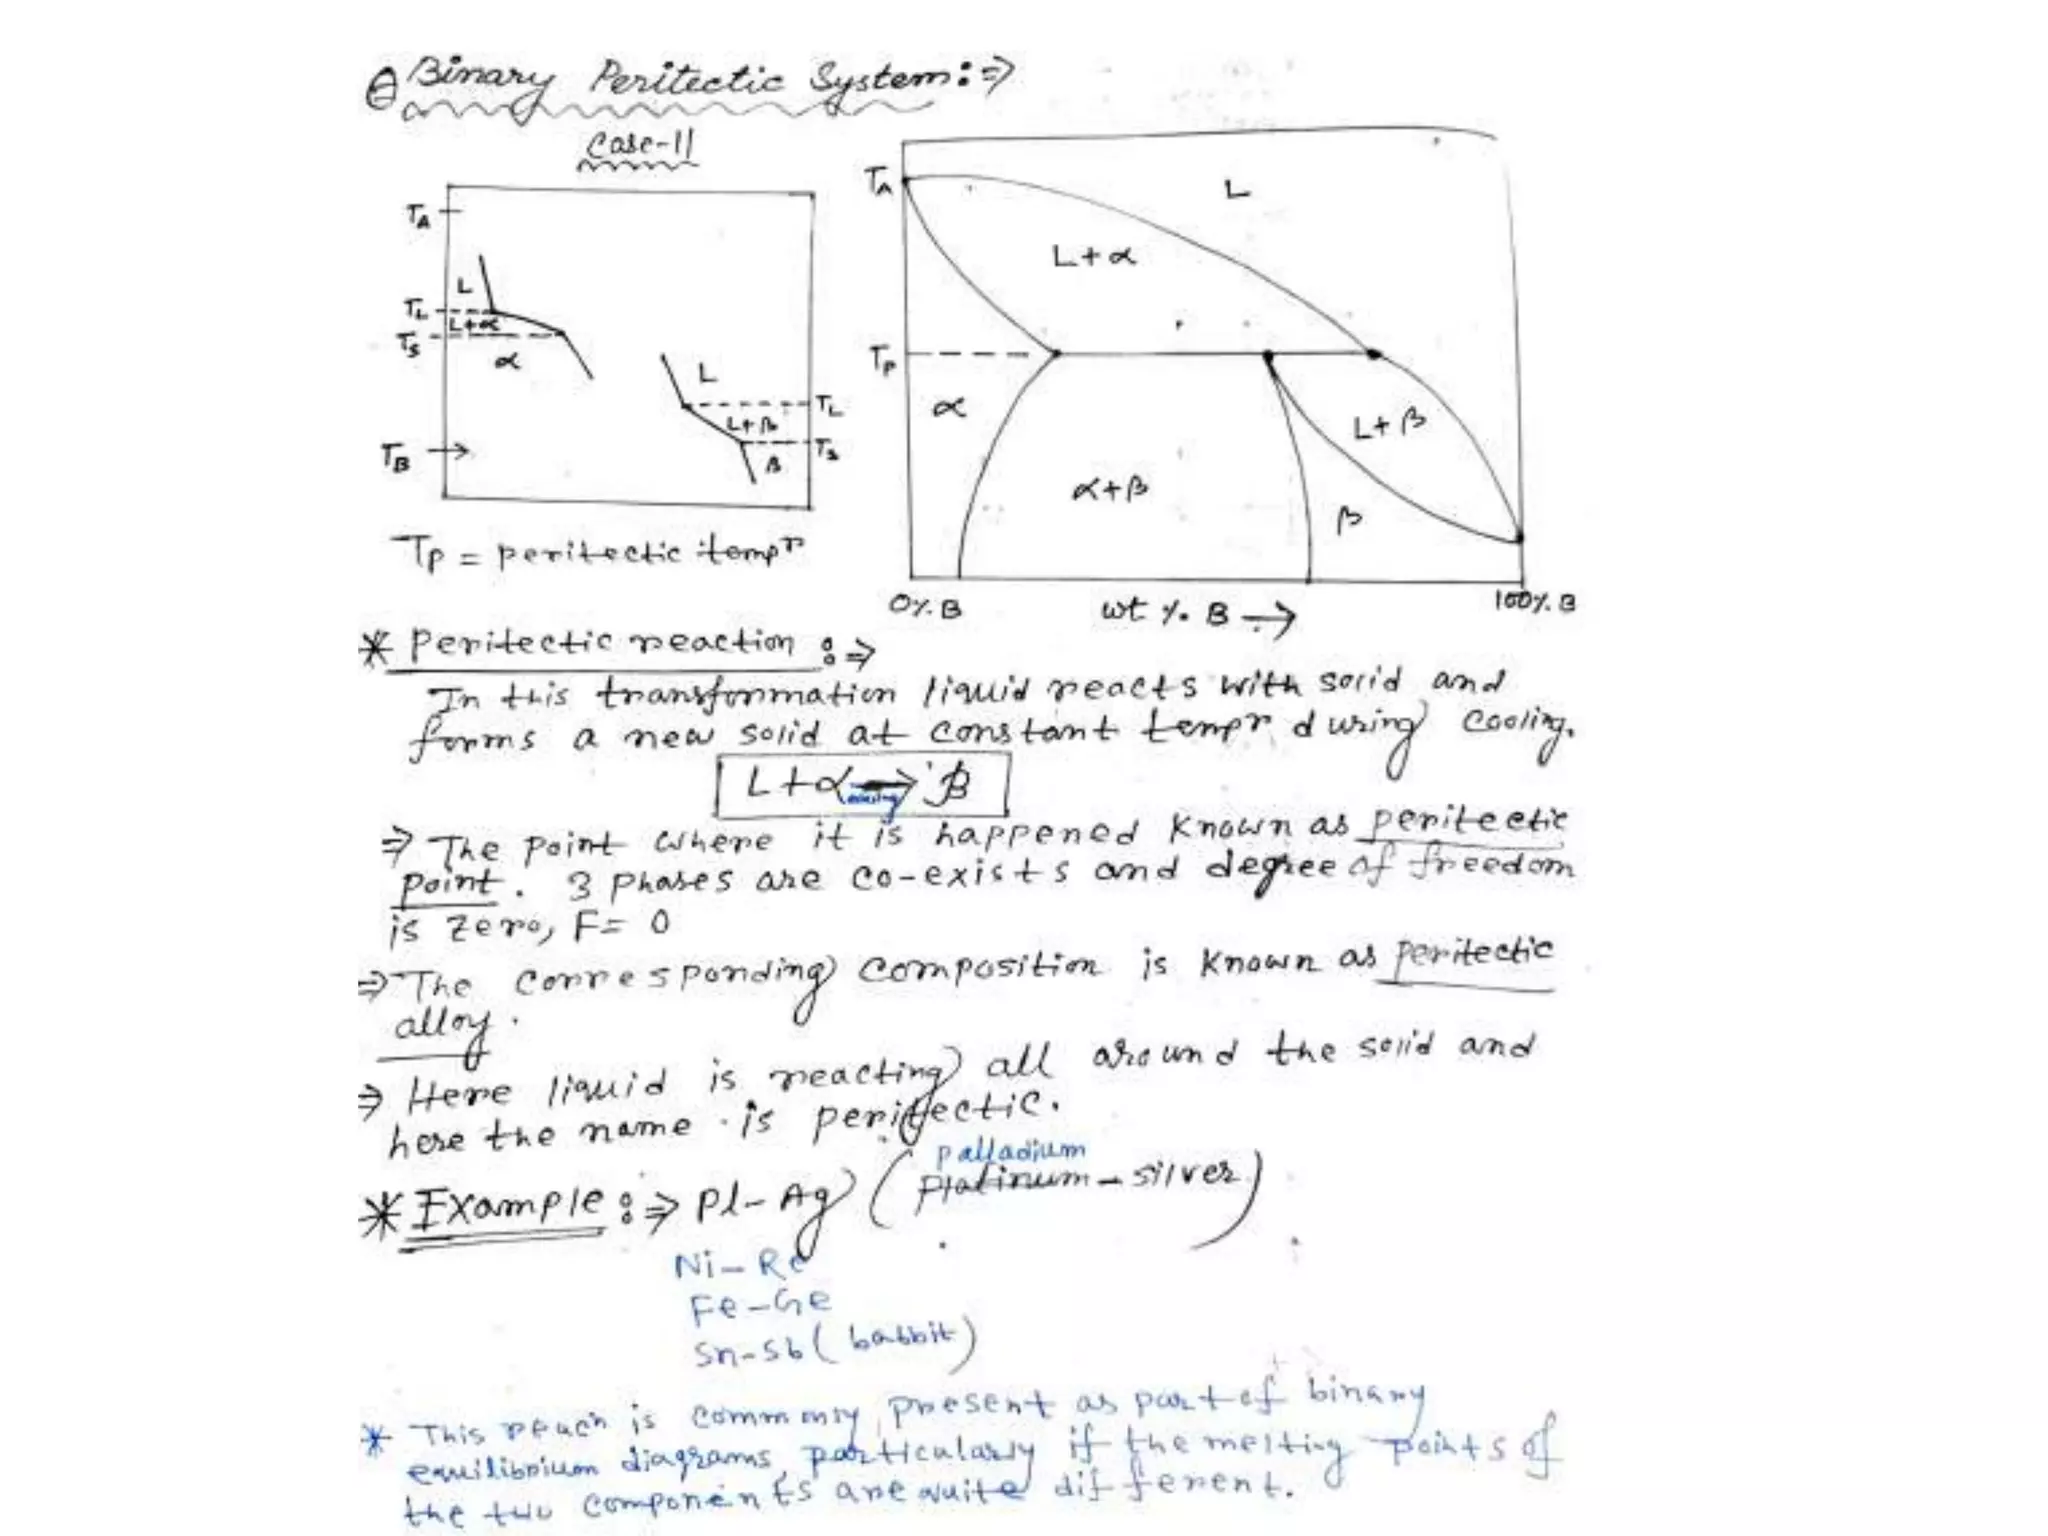
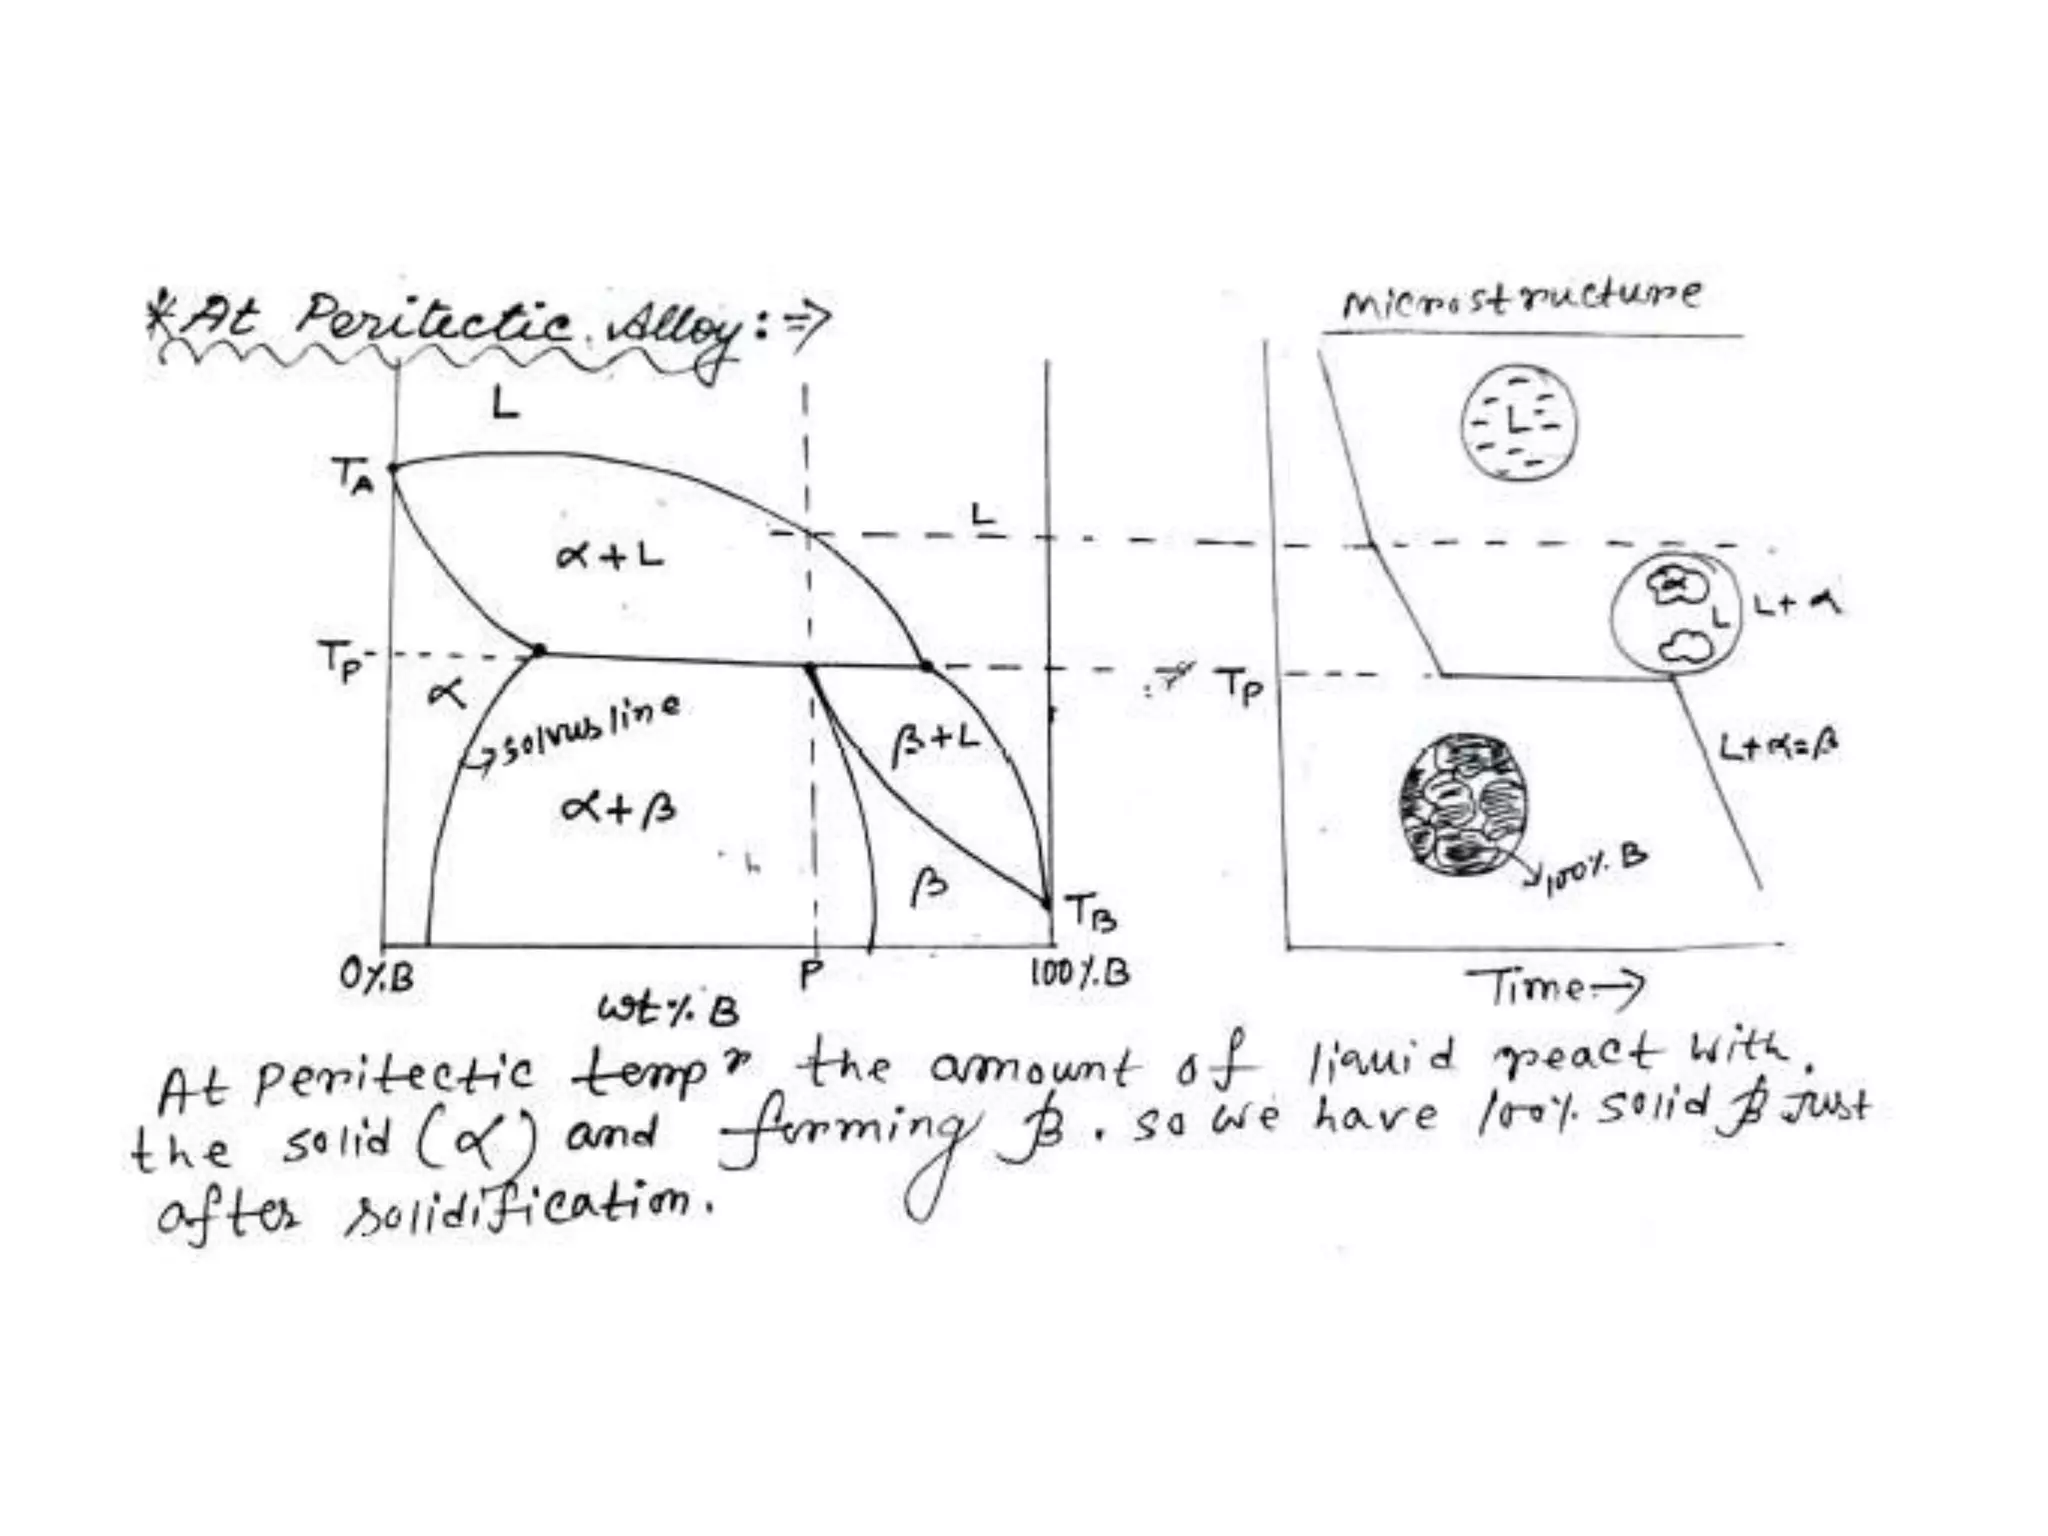
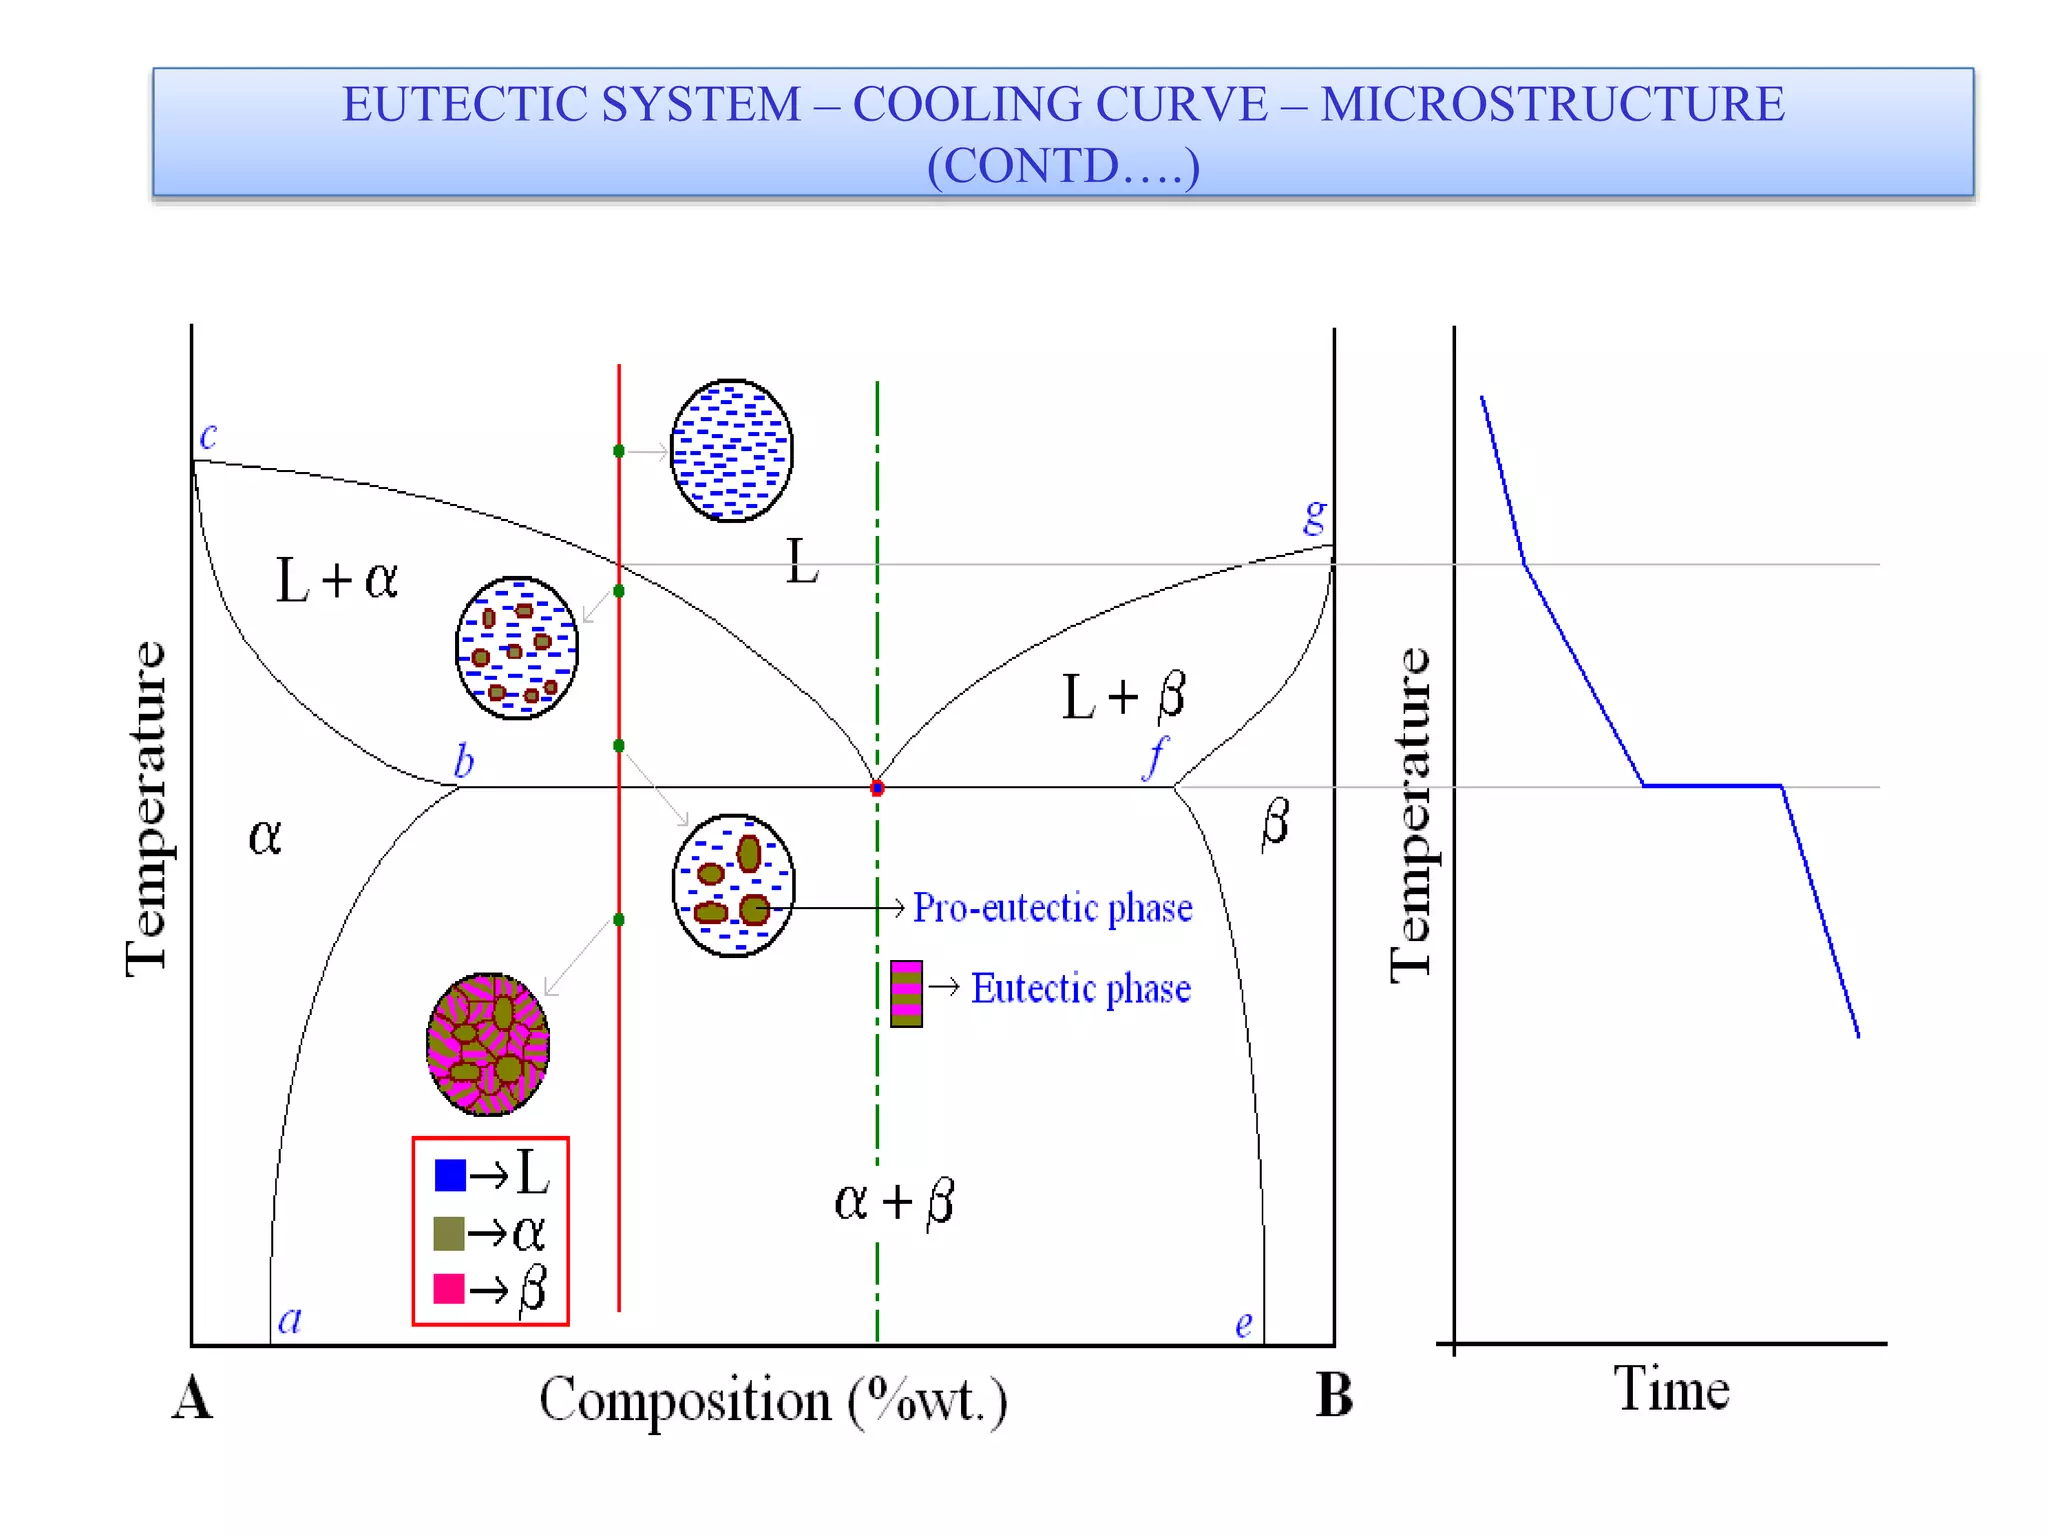
This document discusses phase diagrams and their classification. It begins by defining key terms like phases, components, solutions, and mixtures. It then explains Gibbs phase rule and how it relates the number of phases (P) to components (C) and degrees of freedom (F). Equilibrium phase diagrams are introduced as diagrams that depict phase existence under equilibrium conditions as a function of temperature and composition. Different types of phase diagrams are classified, including unary, binary, and ternary systems. Specific binary systems like eutectic and isomorphous systems are discussed in more detail. Important concepts like invariant reactions, intermediate phases, lever rule, and cooling curves are also summarized. The Fe-C binary phase diagram is provided as a detailed


