Download to read offline
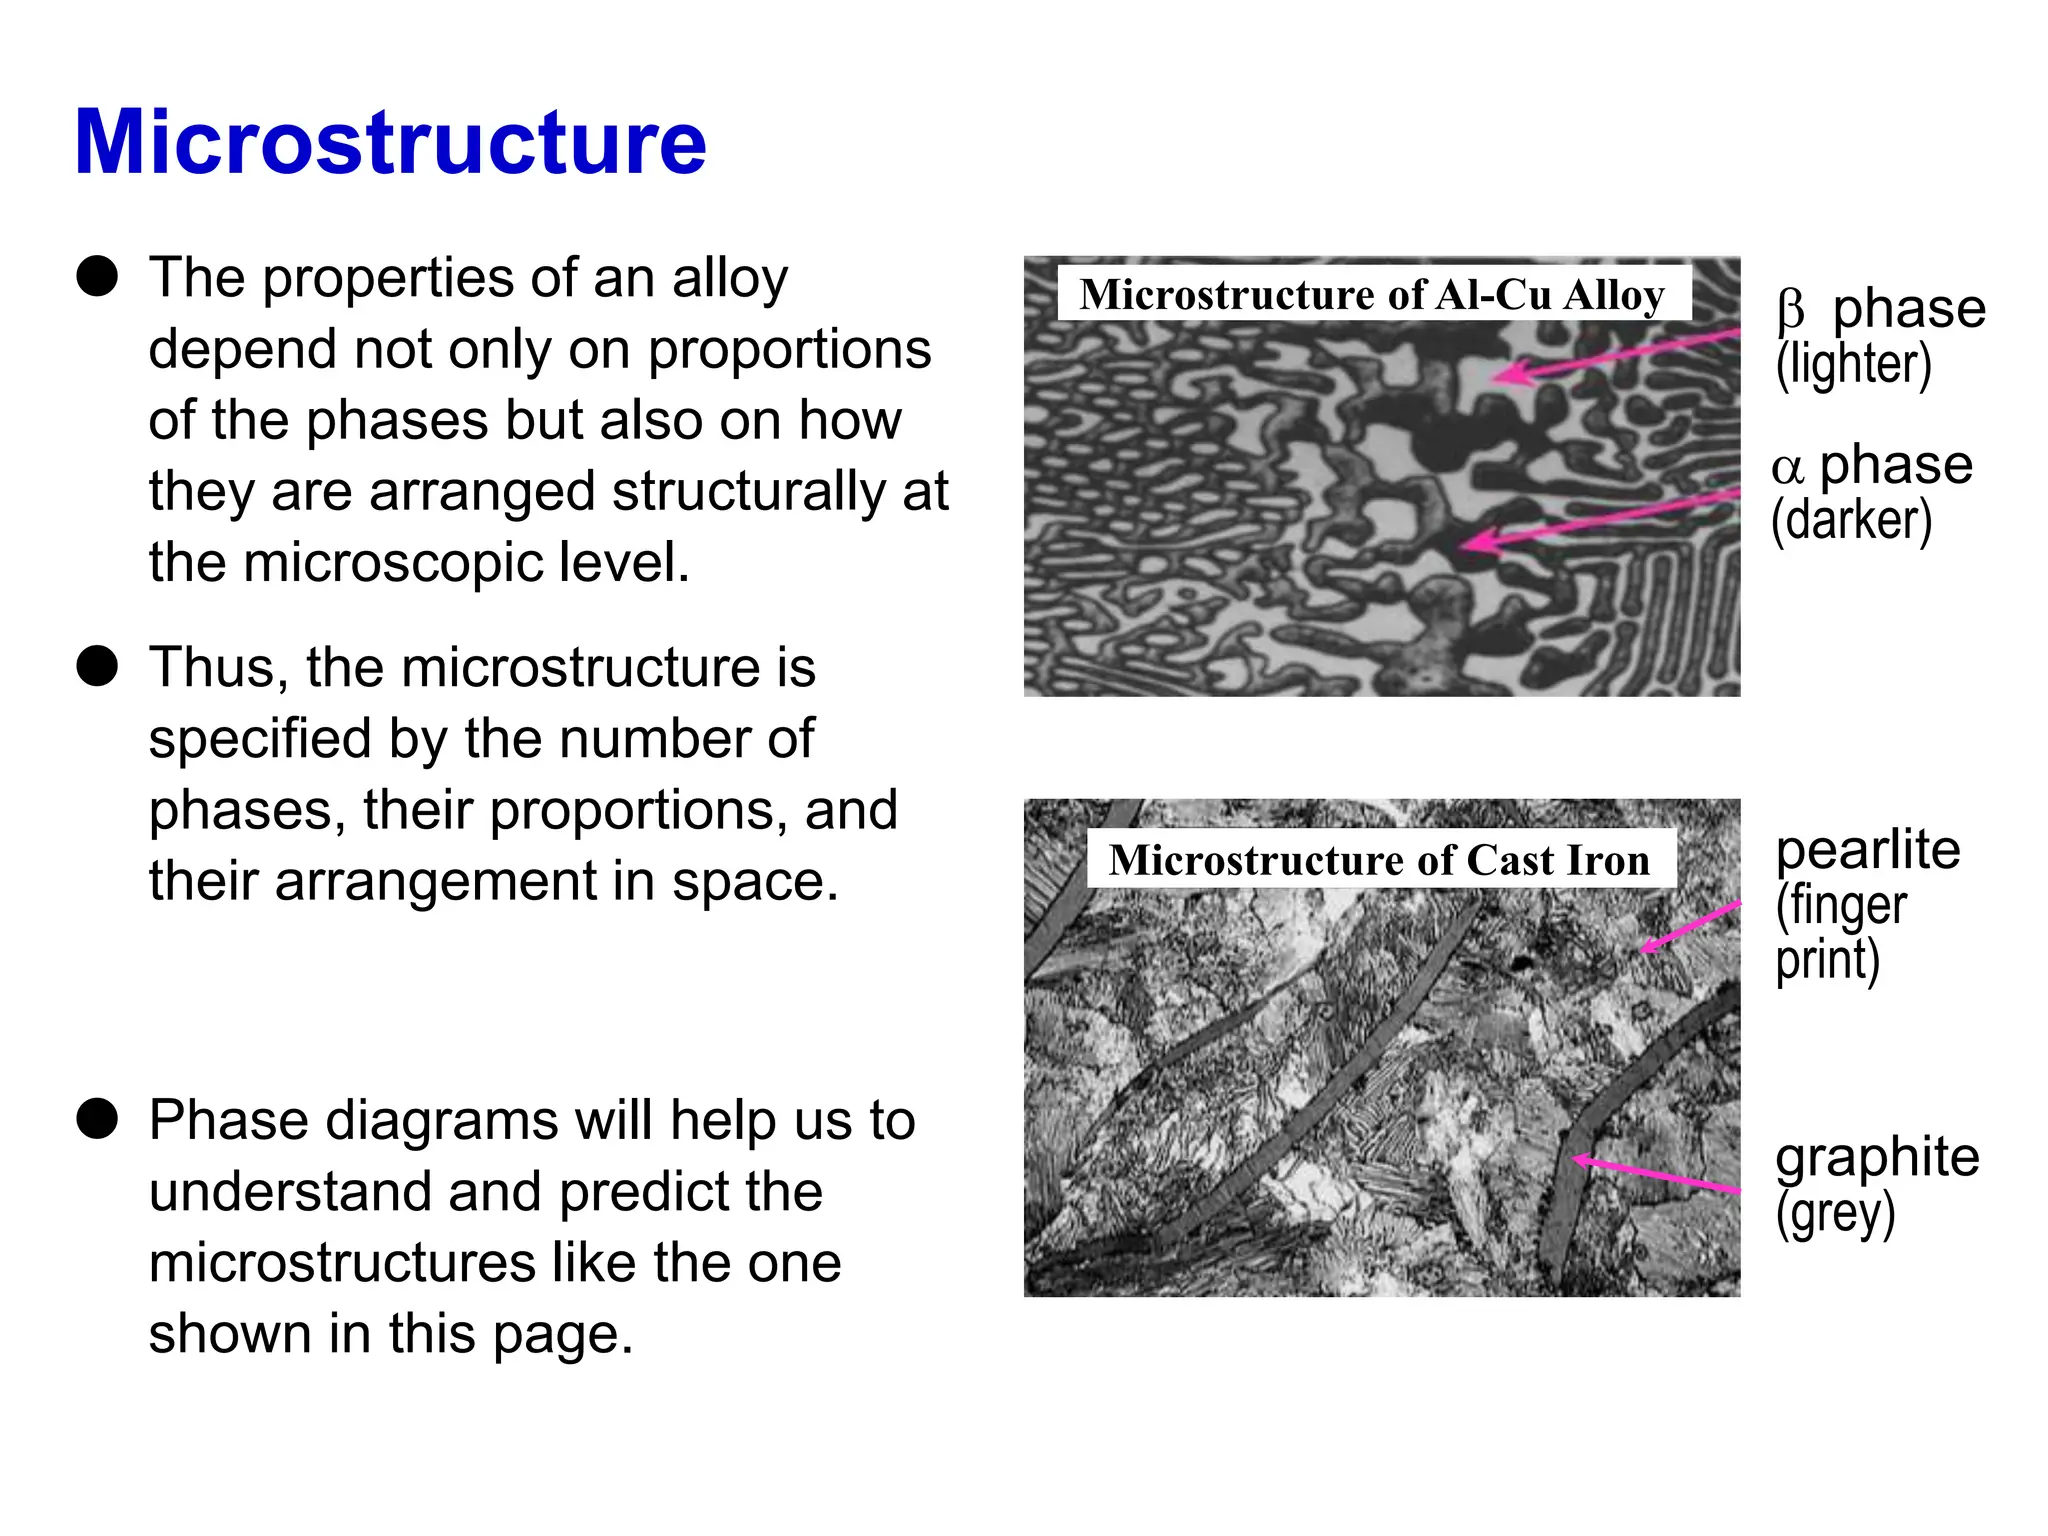
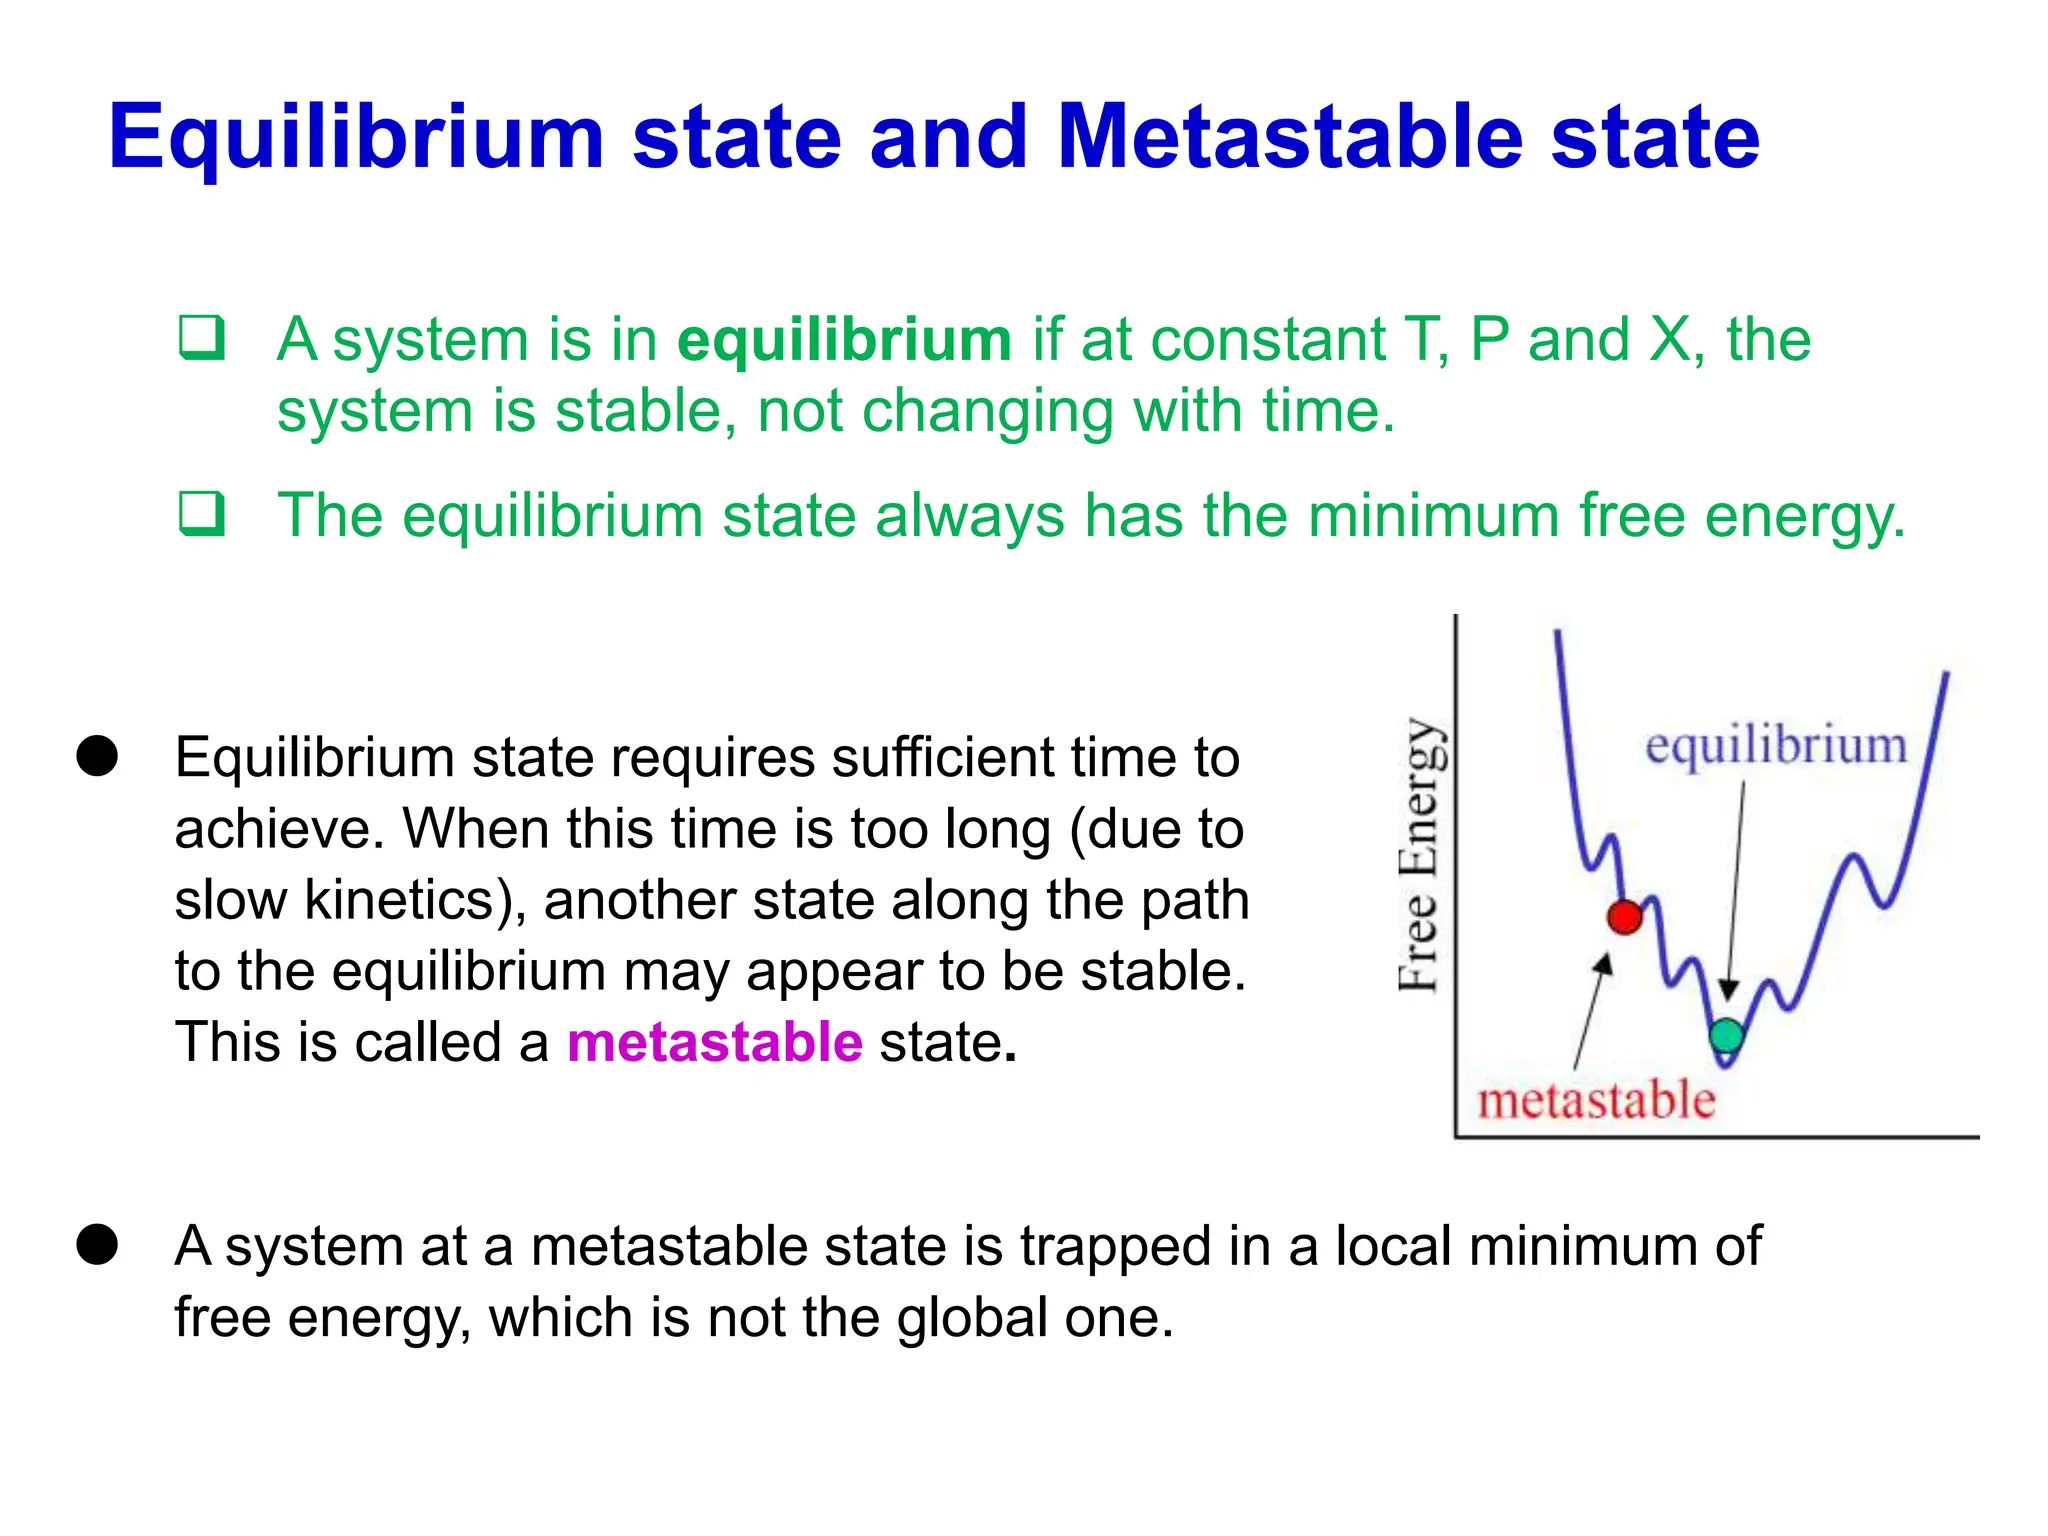
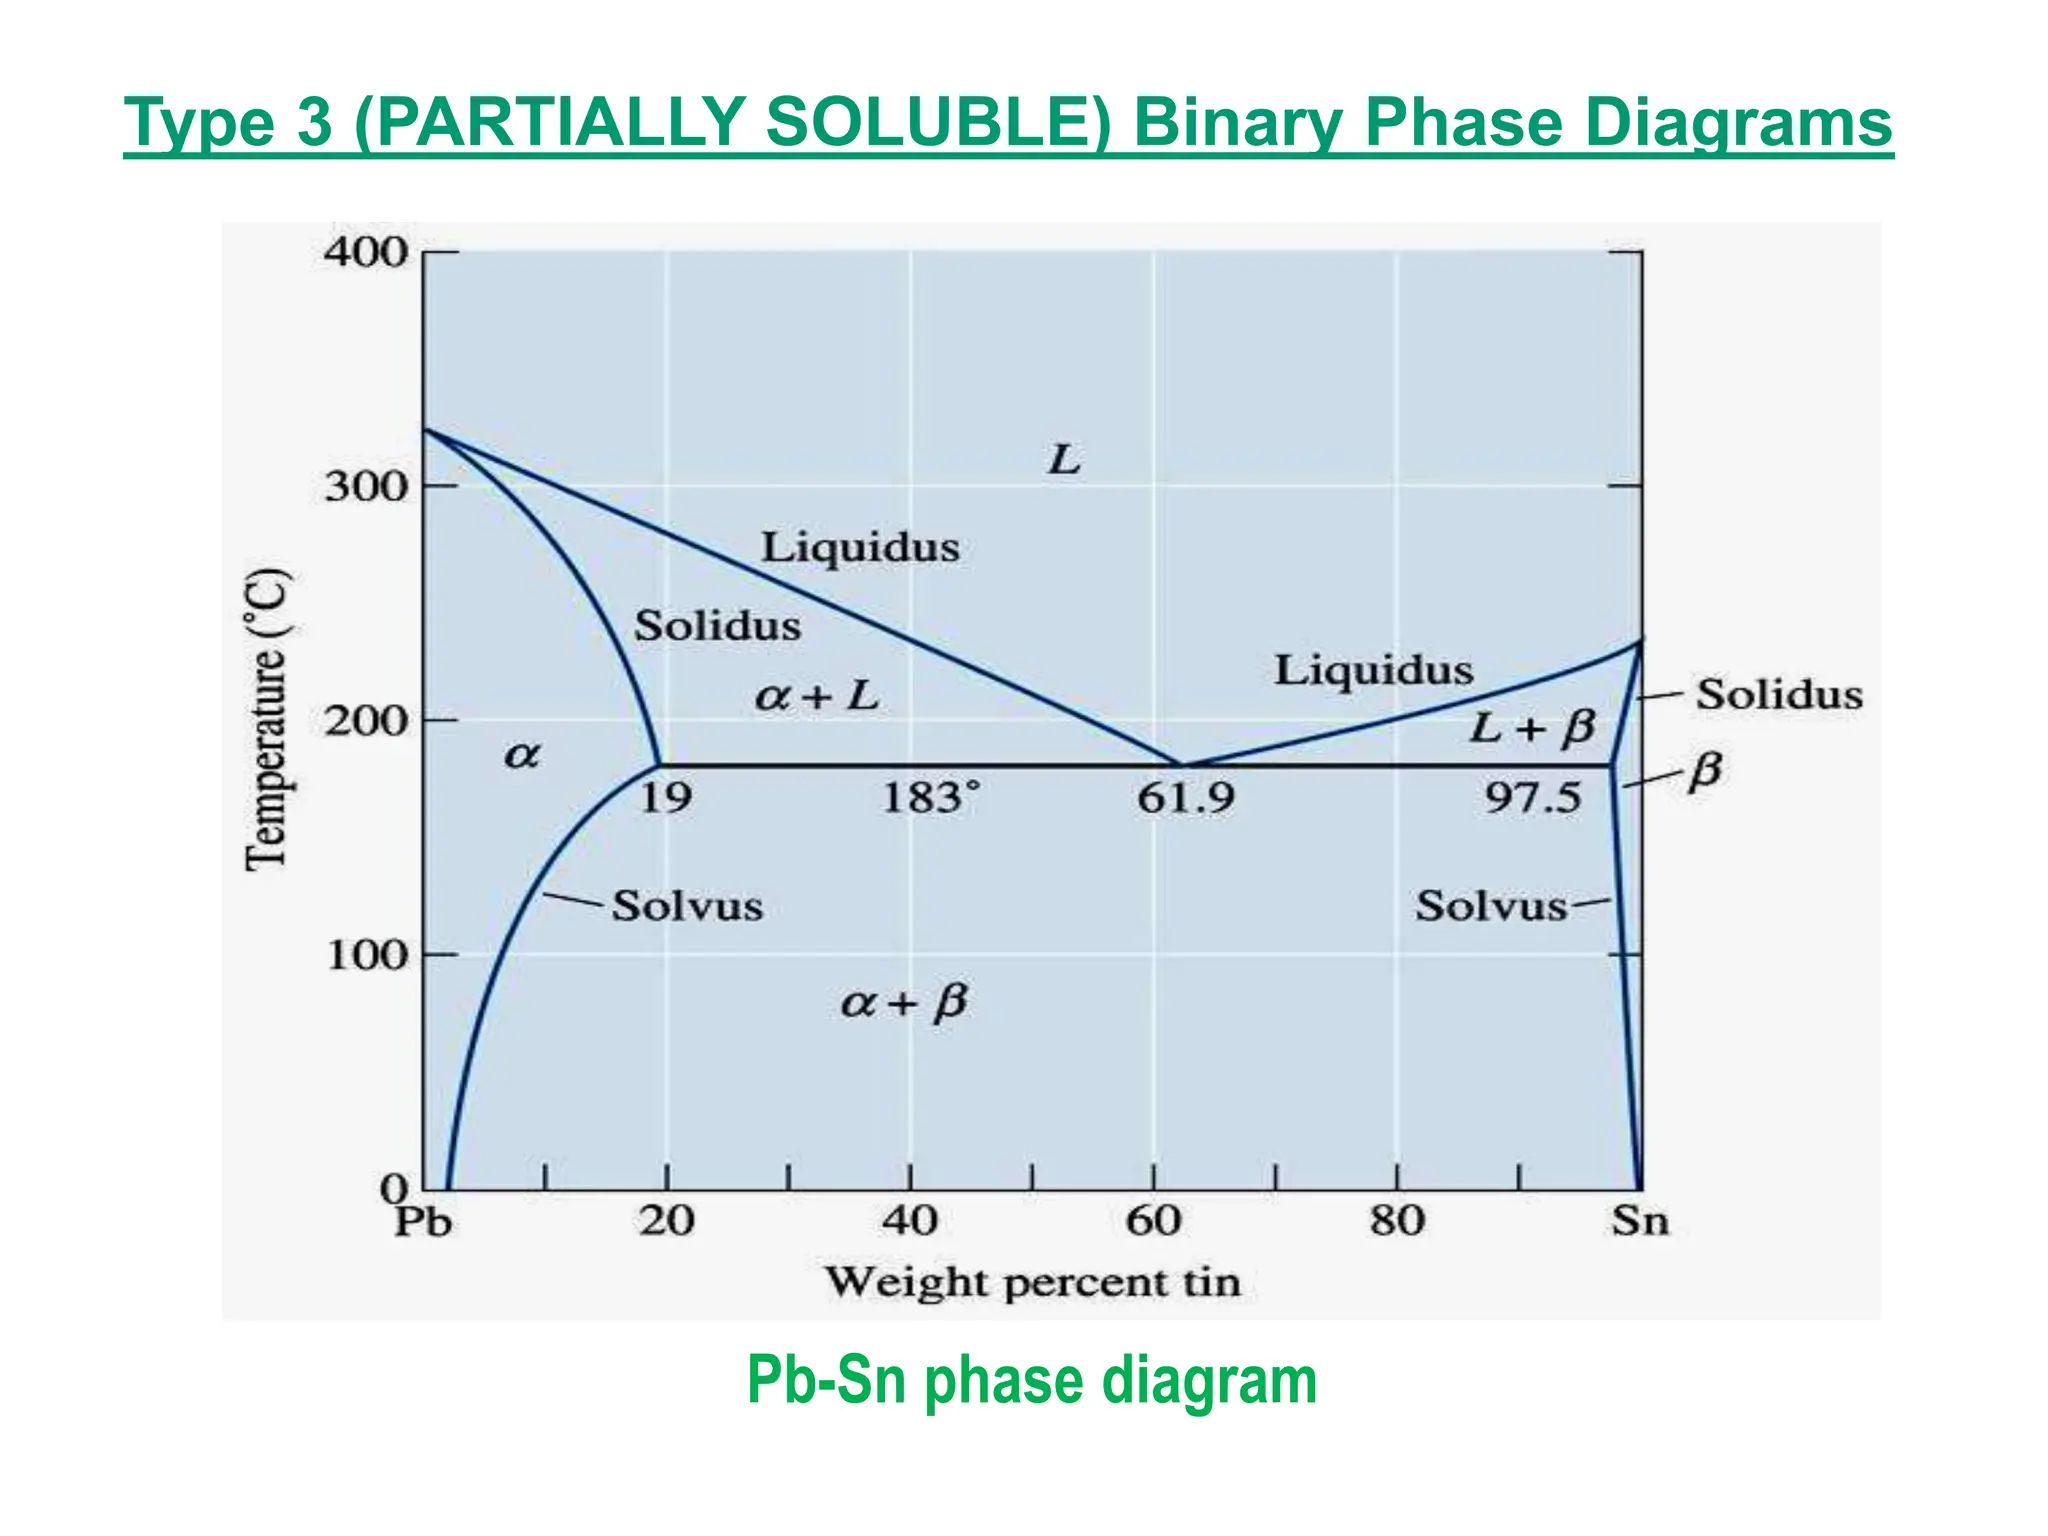
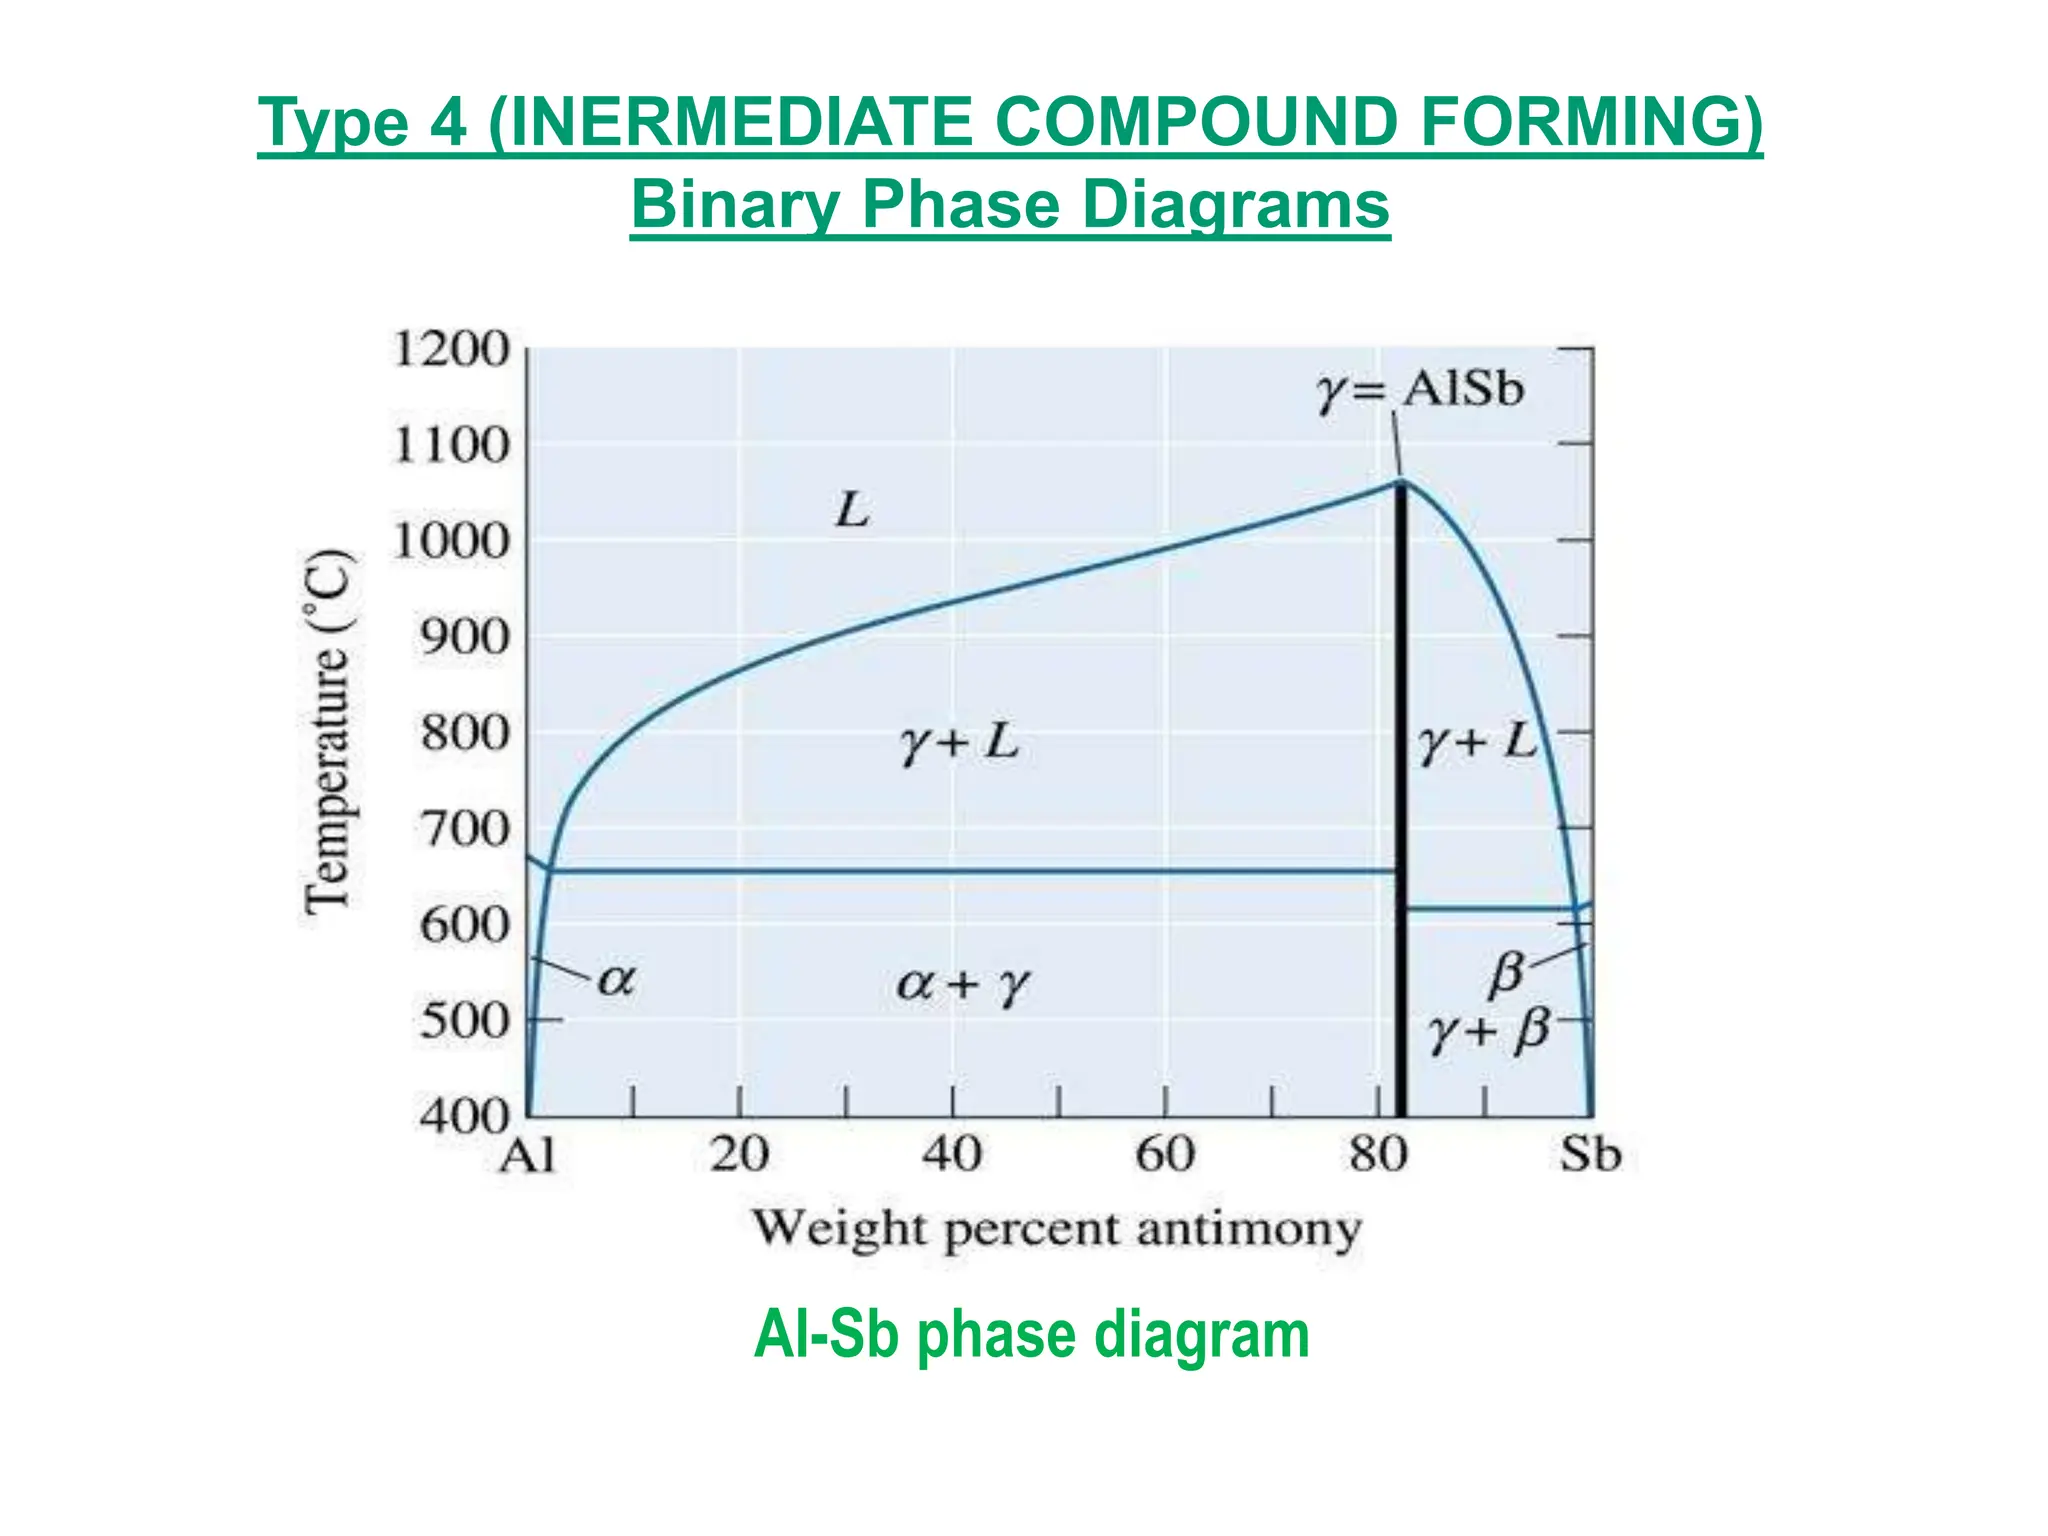


The document discusses phase diagrams and microstructure of materials. It defines key terms like components, phases, and microstructure. It explains that phase diagrams show the stable phases in a material system under different temperature, pressure and composition conditions. The document discusses different types of binary phase diagrams and how to read them. It also discusses how phase diagrams can be constructed and experimentally determined. Phase diagrams are important tools for materials scientists to understand and control material properties by manipulating phase transformations.