Downloaded 14 times
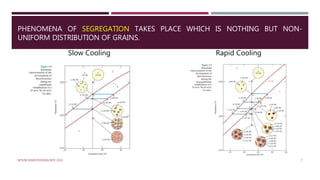
![ At 1250°C, point c, the compositions of the liquid
and α phases are 32 wt% Ni–68 wt% Cu [L(32 Ni)]
and 43 wt% Ni–57 wt% Cu [ (43 Ni)].
The solidification process is virtually complete
at1220°C about point d; the composition of the
solid is approximately 35 wt% Ni–65 wt% Cu.
Upon crossing the solidus line, this remaining
liquid solidifies; the final product then is a
polycrystalline -phase solid solution that has a
uniform 35 wt% Ni–65 wt% Cu composition at
point e.
MTE/III SEMESTER/MSE/MTE 2101 3
Pic Courtesy: Material Science and Engineering, Callister.](https://image.slidesharecdn.com/lecture17-170203082146/85/Two-Component-System-3-320.jpg)
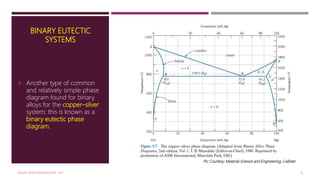
![RAPID COOLING OF AN ISOMORPHOUS ALLOY
Also, called as Non Equilibrium Cooling.
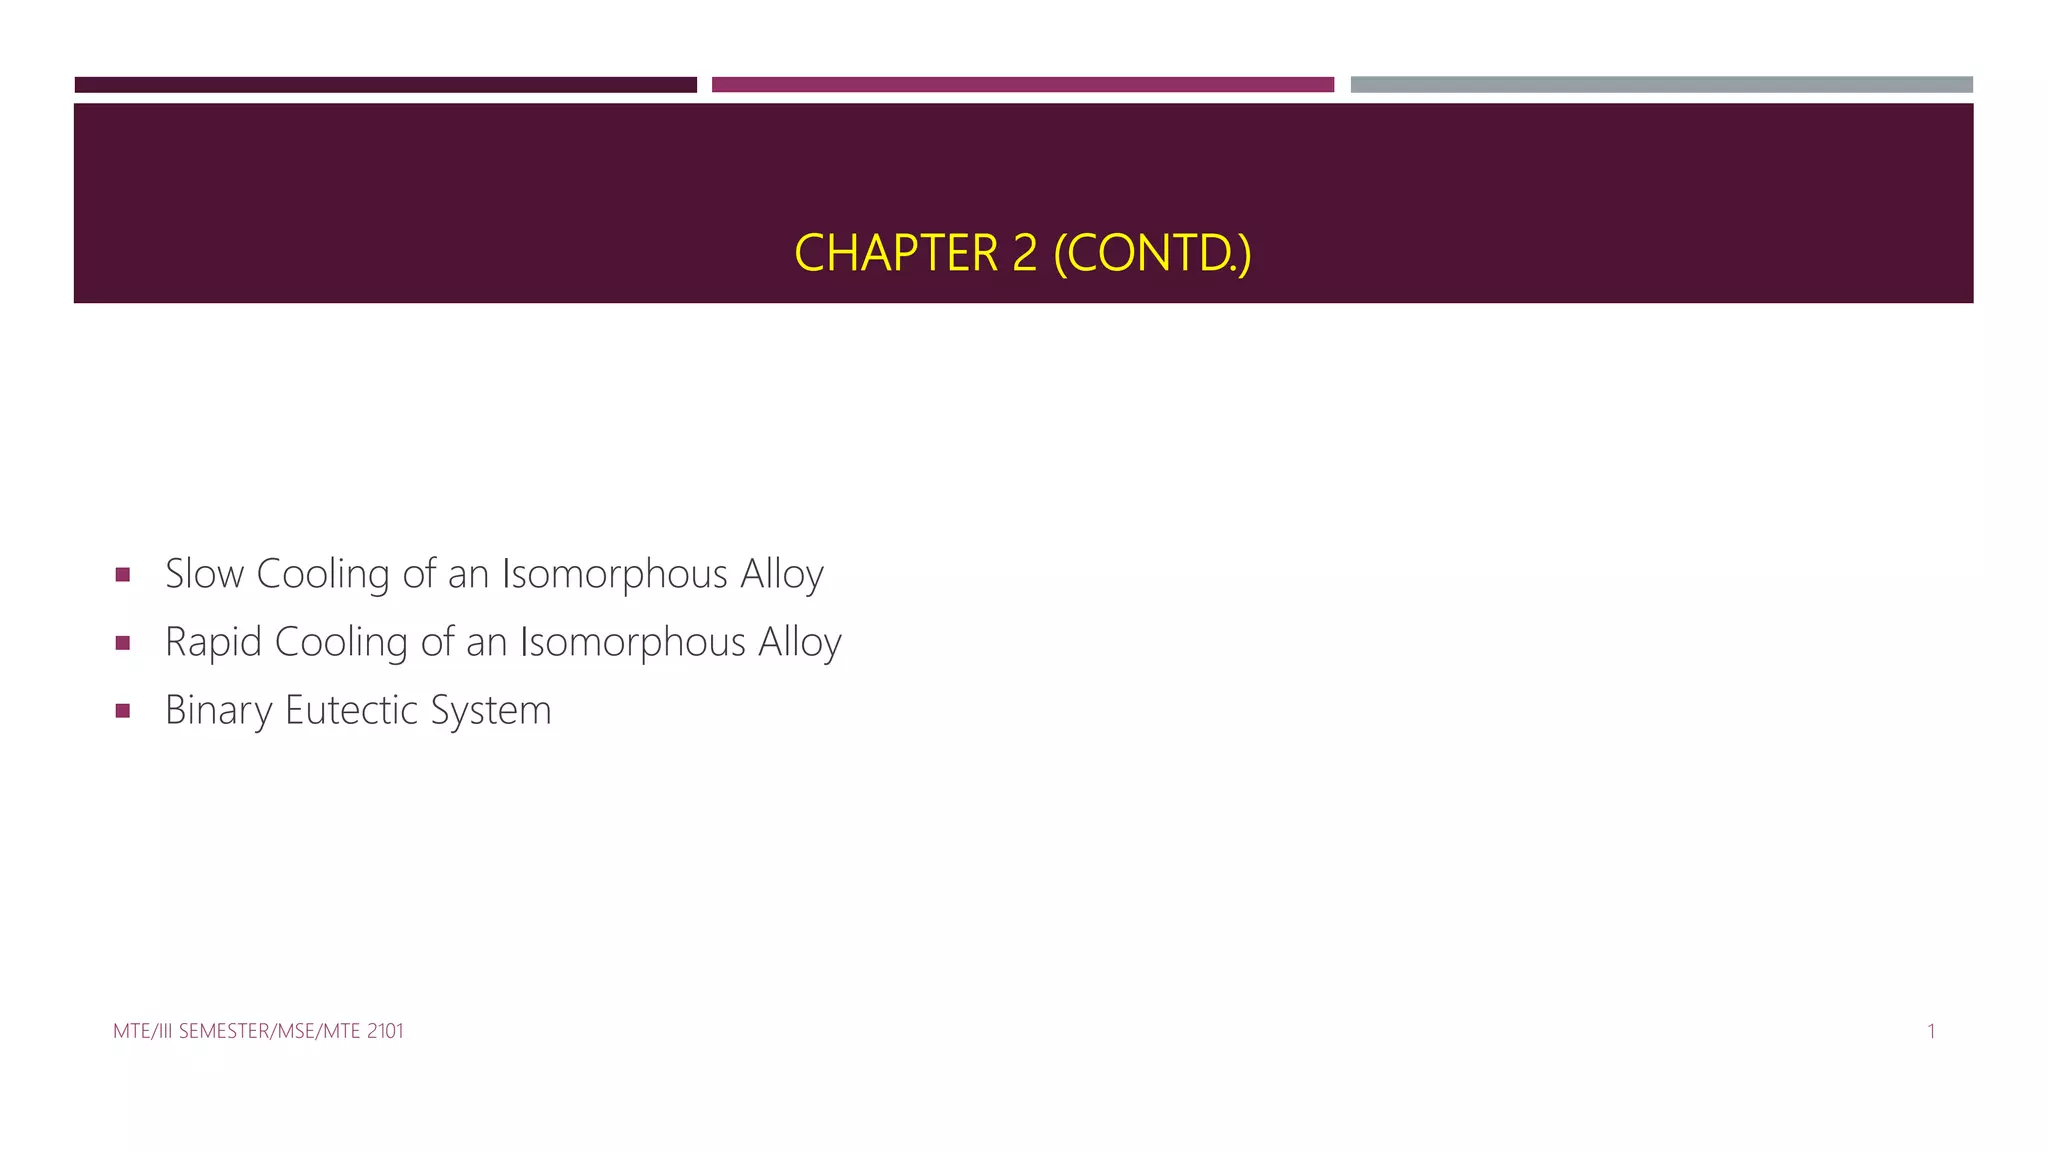
Let us consider Cu-Ni system 35 wt% Ni–65
wt% Cu.
At 1300° C; point a´, the alloy is completely
liquid.
As cooling begins, no microstructural or
compositional changes will be realized until we
reach the liquidus line.
At point b´, (approximately 1260°C), α-phase
particles begin to form, which, from the tie line
constructed, have a composition of 46 wt% Ni–
54 wt% Cu [ (46 Ni)].
MTE/III SEMESTER/MSE/MTE 2101 4Pic Courtesy: Material Science and Engineering, Callister.](https://image.slidesharecdn.com/lecture17-170203082146/85/Two-Component-System-4-320.jpg)
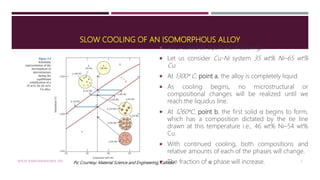
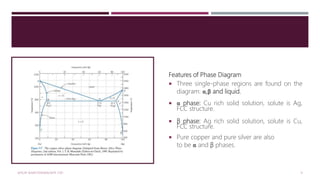
![ Upon further cooling to point c´ (about 1260°C
), the liquid composition has shifted to 29 wt%
Ni–71 wt% Cu; furthermore, at this temperature
the composition of the αphase that solidified is
40 wt% Ni–60 wt% Cu [ (40 Ni)].
Because of the rapid cooling, the solidus line
shifted (indicated in dashed line) and solid
composition has increased.
At point d´ (temperature 1220°C), the
solidification should complete but there is still
little amount of liquid is left.
MTE/III SEMESTER/MSE/MTE 2101 5
Pic Courtesy: Material Science and Engineering, Callister.](https://image.slidesharecdn.com/lecture17-170203082146/85/Two-Component-System-5-320.jpg)
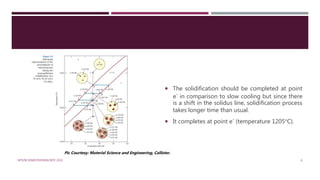
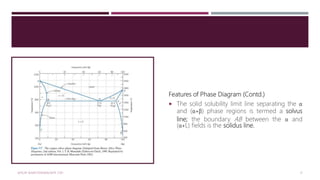
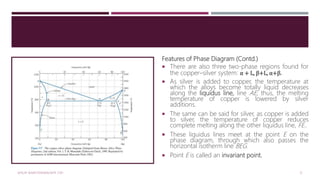
![Features of Phase Diagram (Contd.)
The solubility in each of these solid phases is
limited, in that at any temperature below line
BEG only a limited concentration of silver will
dissolve in copper (for the α phase) similarly
copper in silver (for the β phase).
The solubility limit for the α phase
to the boundary line, labelled CBA, between
the α/(α+β) and α/(α+L) phase regions; it
increases with temperature to a maximum [8.0
wt% Ag at 779°C] at point B and decreases
back to zero at the melting temperature of
pure copper, point A 1085°C.
MTE/III SEMESTER/MSE/MTE 2101 10](https://image.slidesharecdn.com/lecture17-170203082146/85/Two-Component-System-10-320.jpg)

The document describes slow cooling and rapid cooling of an isomorphous alloy using a Cu-Ni system. For slow cooling, the alloy solidifies completely with a uniform composition along the solidus line. For rapid cooling, solidification takes longer and is incomplete, resulting in segregation of grains with non-uniform composition. The document also describes a binary eutectic system using Cu-Ag, which has three single-phase regions (α, β, liquid), limited solid solubility, and a eutectic reaction that occurs at a single temperature and composition.


![10[1].Phase Diagrams.ppt](https://cdn.slidesharecdn.com/ss_thumbnails/101-221009051328-479a8439-thumbnail.jpg?width=640&height=640&fit=bounds)


