Downloaded 259 times

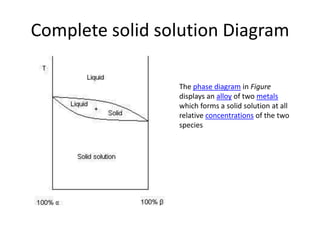
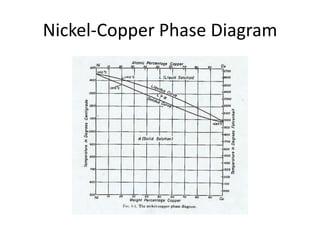
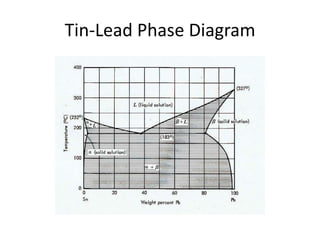
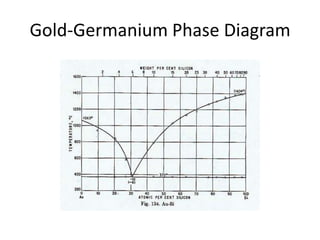
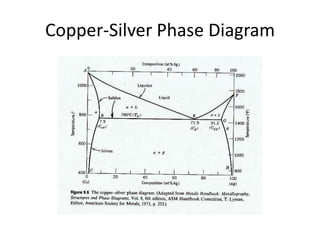
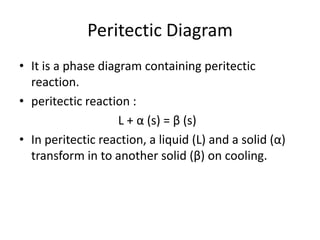
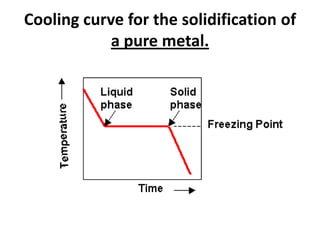
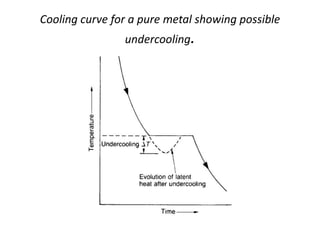
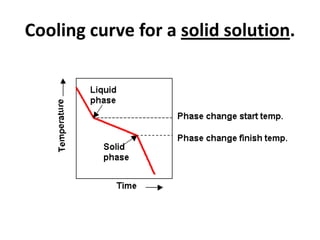

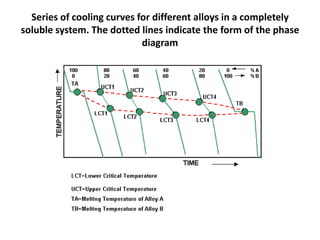
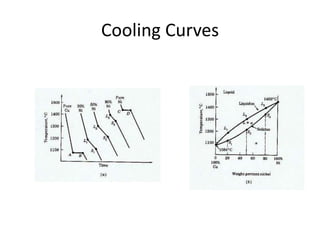
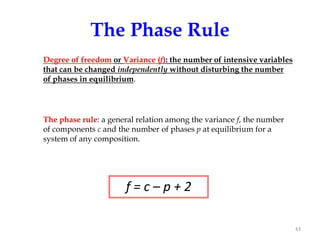
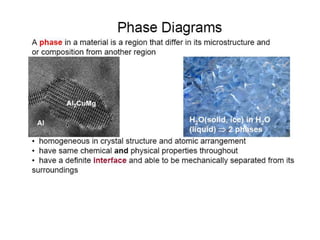
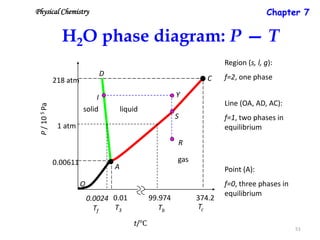
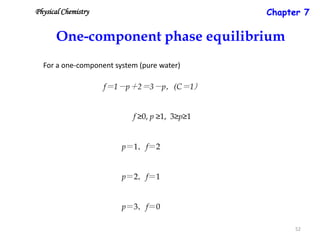
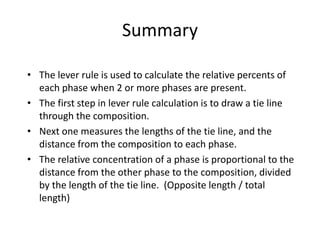

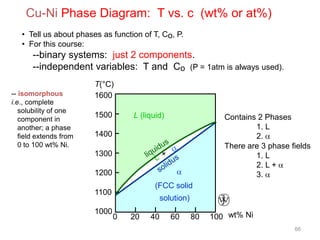
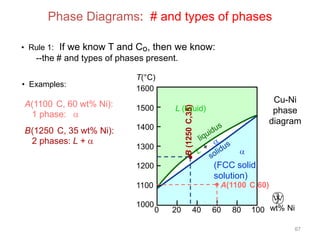
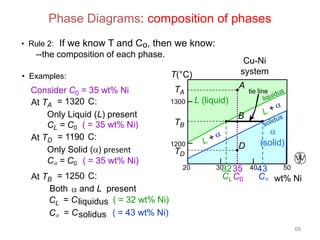
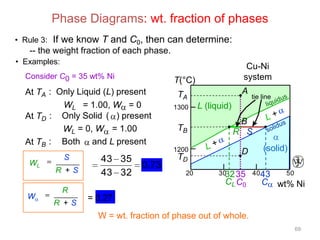
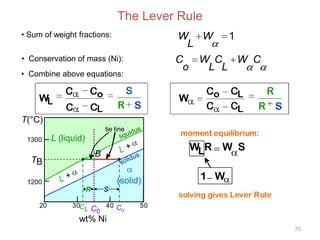


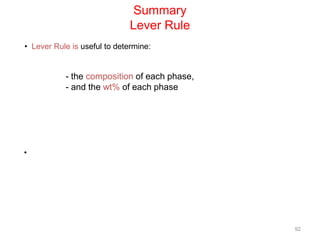

This document provides information about phase diagrams: [1] Phase diagrams graphically show the phases present in a material system at different temperatures and compositions. They can indicate properties like the number, type, and amount of phases. [2] There are several common types of phase diagrams including complete solid solution, eutectic, and peritectic diagrams. Cooling curves are also used to experimentally determine phase boundaries. [3] The phase rule relates the number of phases, components, and degrees of freedom in a system. Lever rule calculations use tie lines on phase diagrams to determine the composition and relative amounts of coexisting phases.


![Getting Started with Apache Spark: Big Data Made Simple [Free Meetup]](https://cdn.slidesharecdn.com/ss_thumbnails/apachesparkgettingstarted-260203175547-8361bcc3-thumbnail.jpg?width=640&height=640&fit=bounds)


