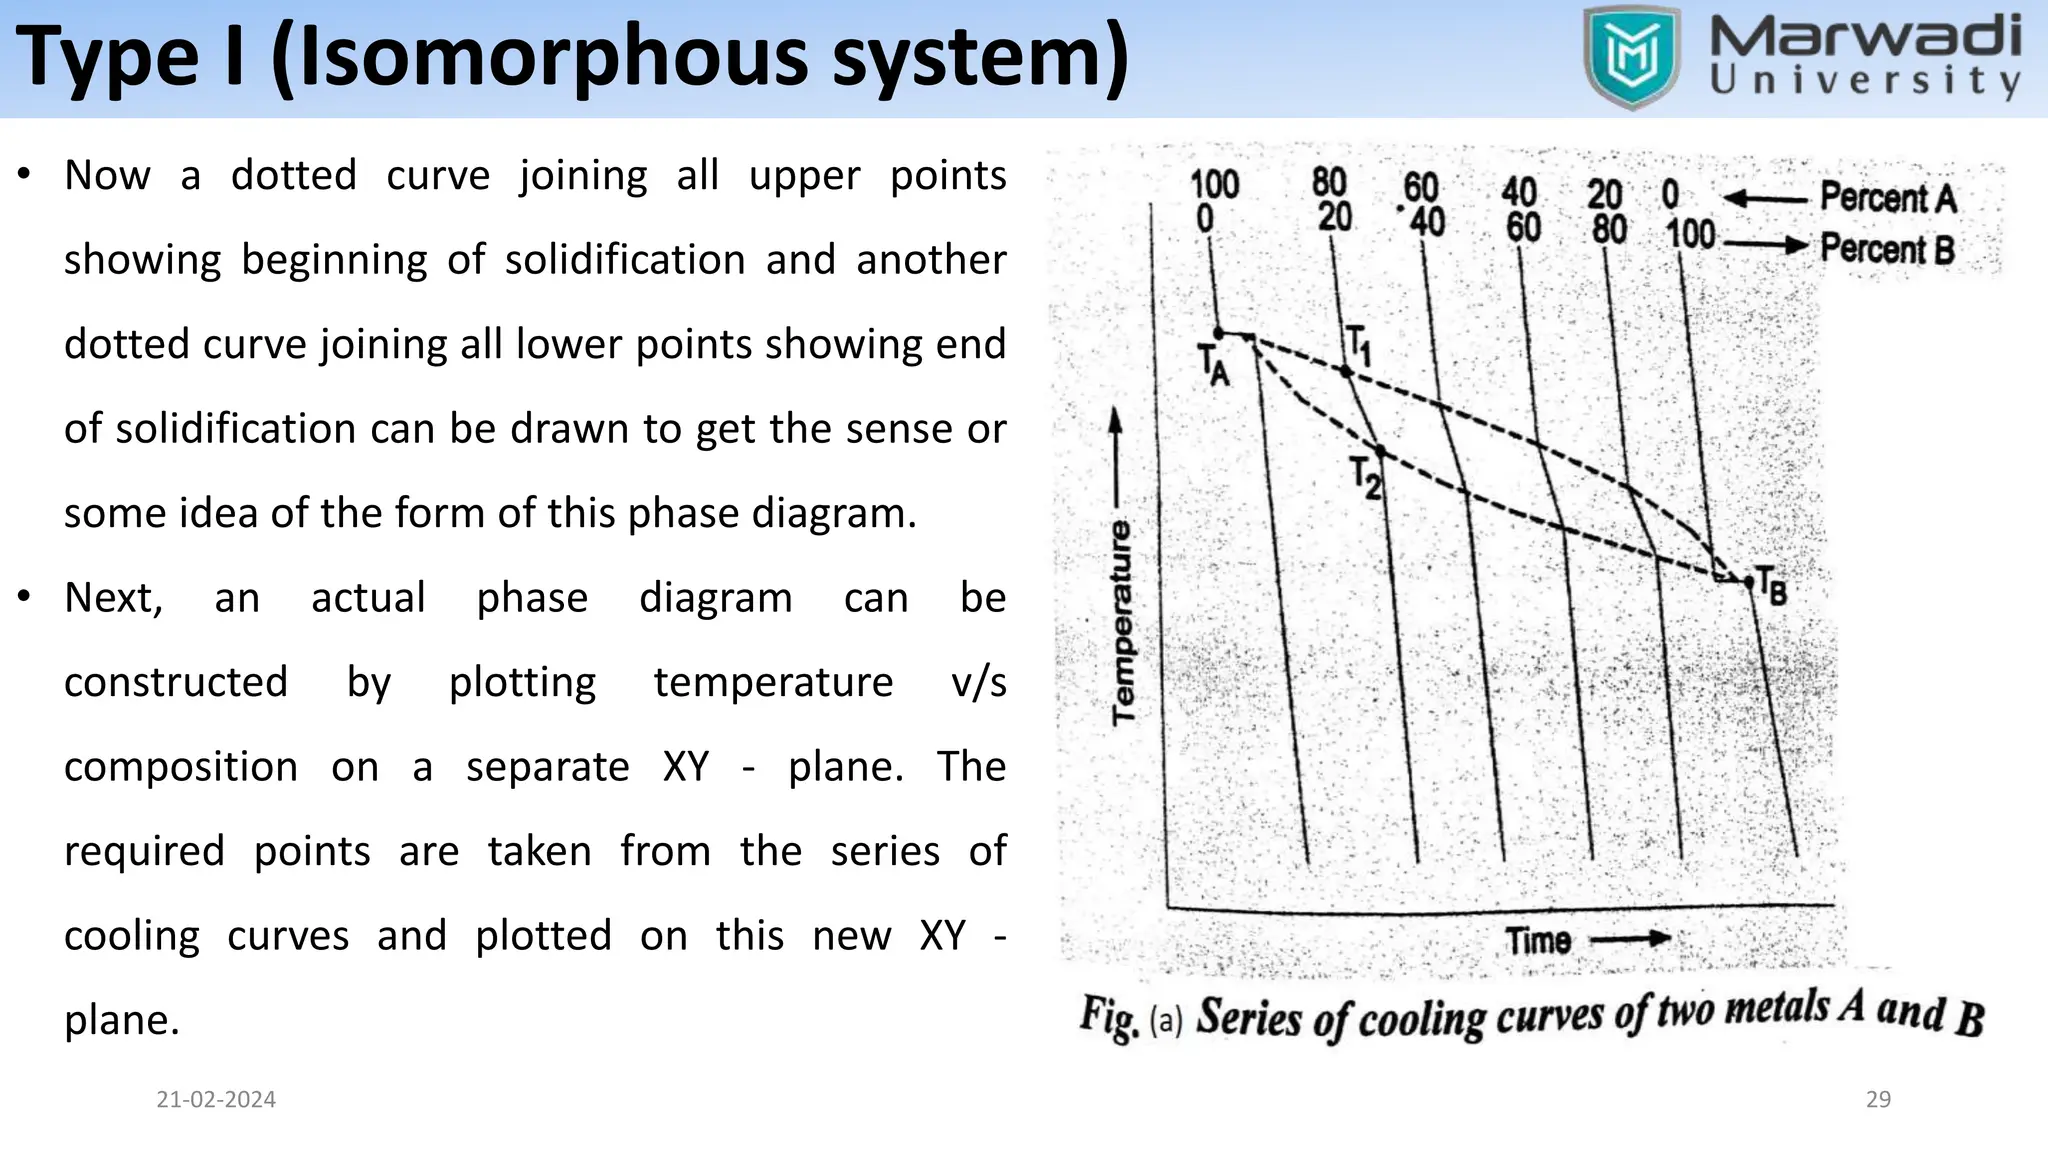
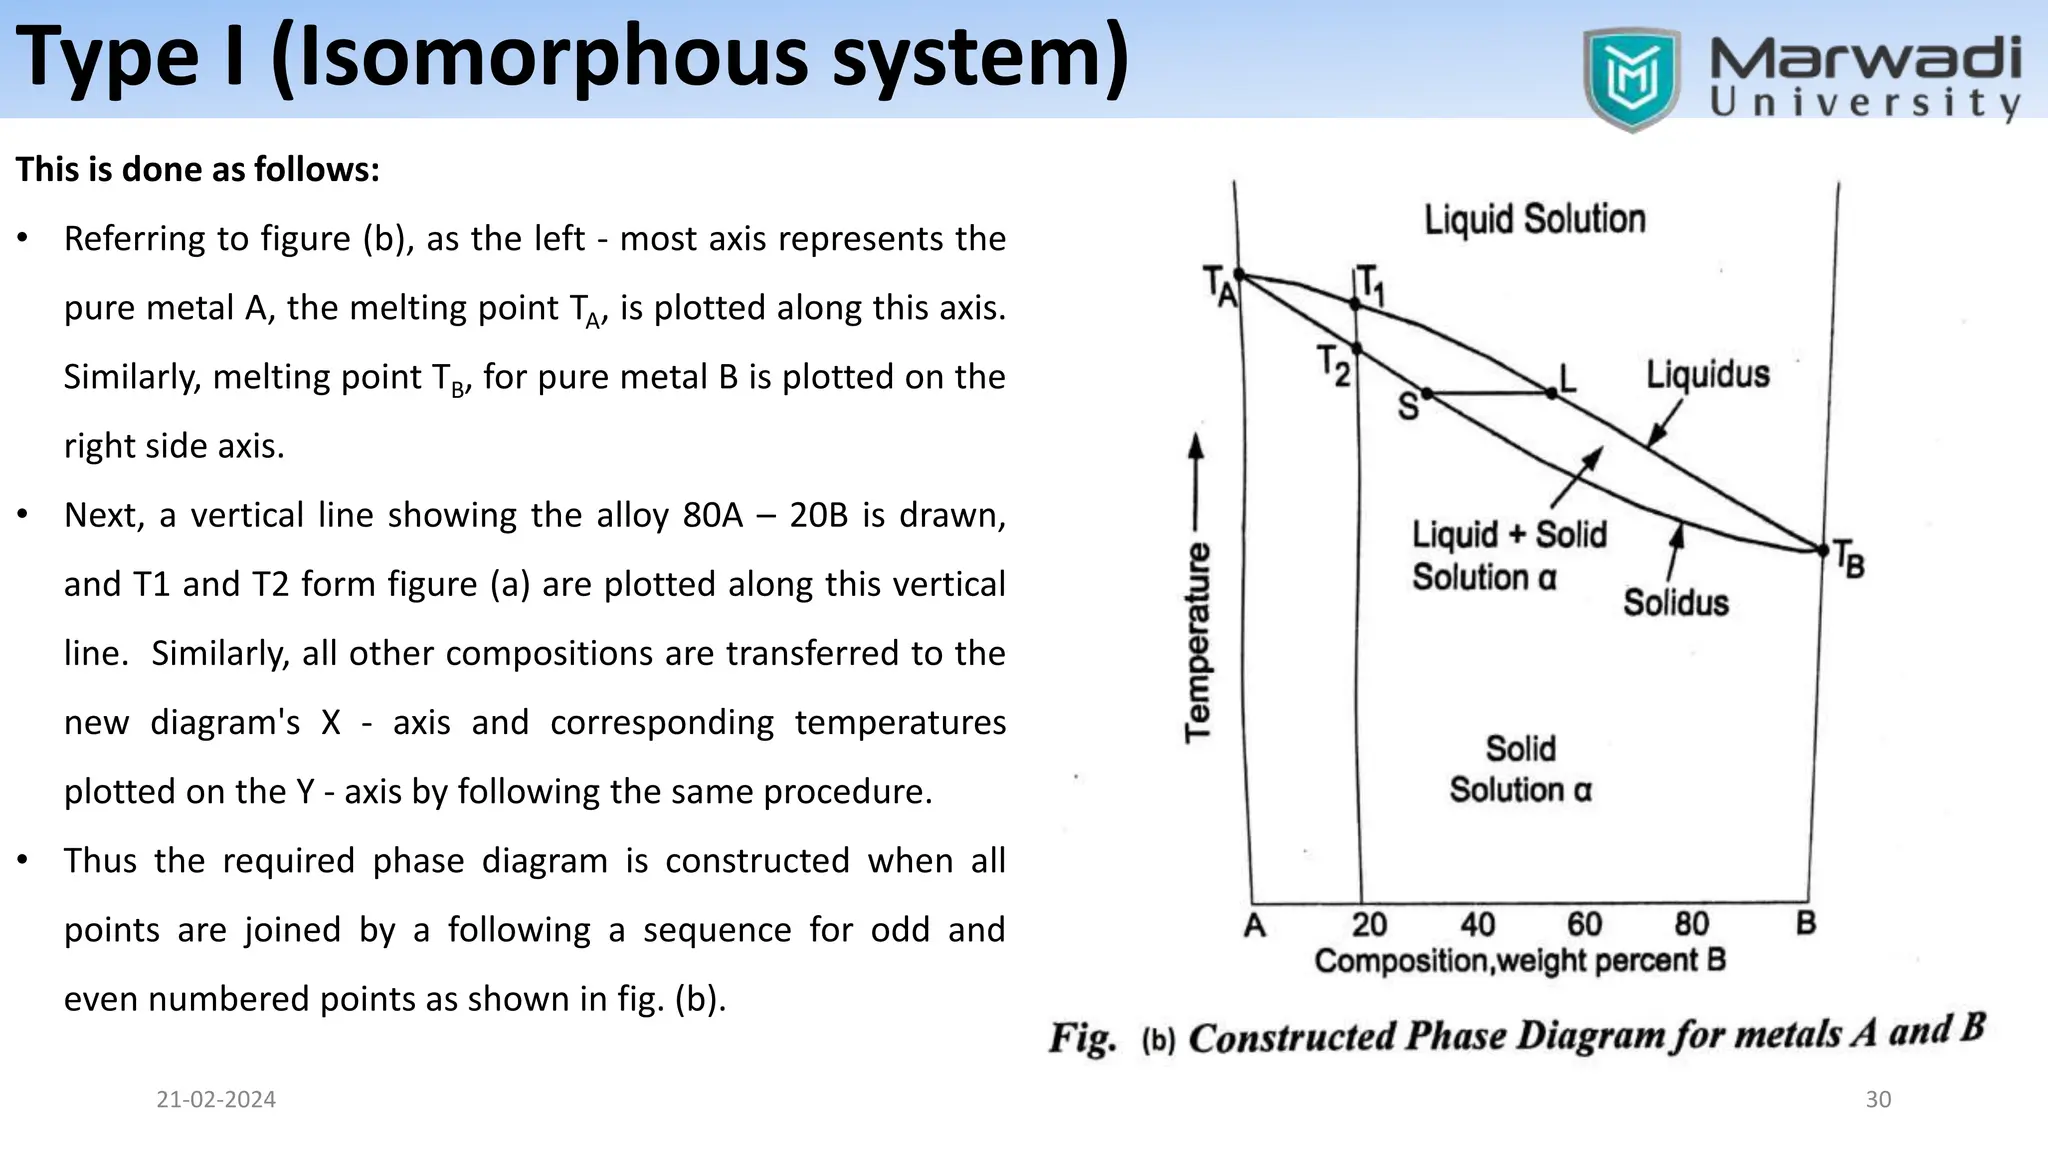
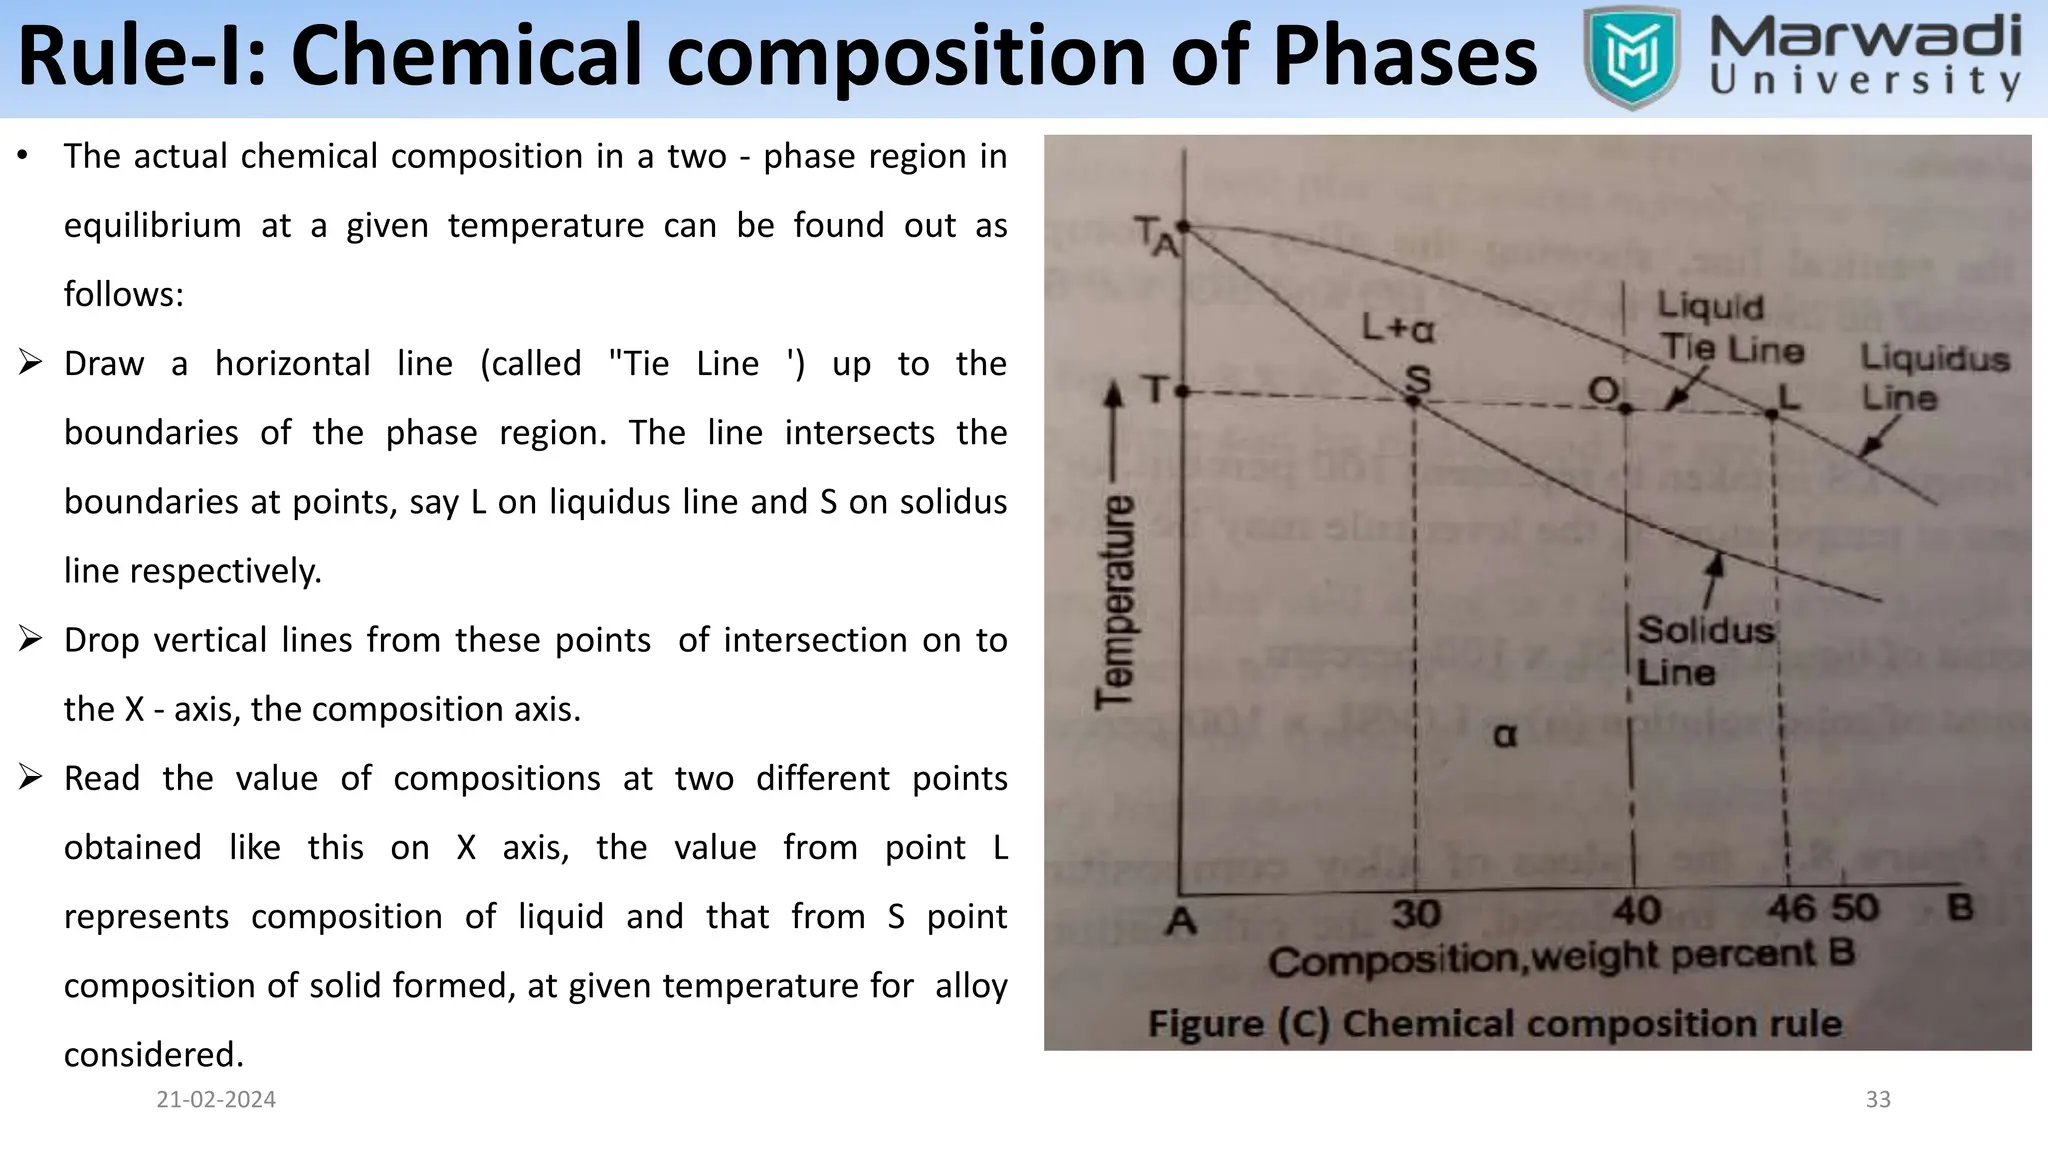
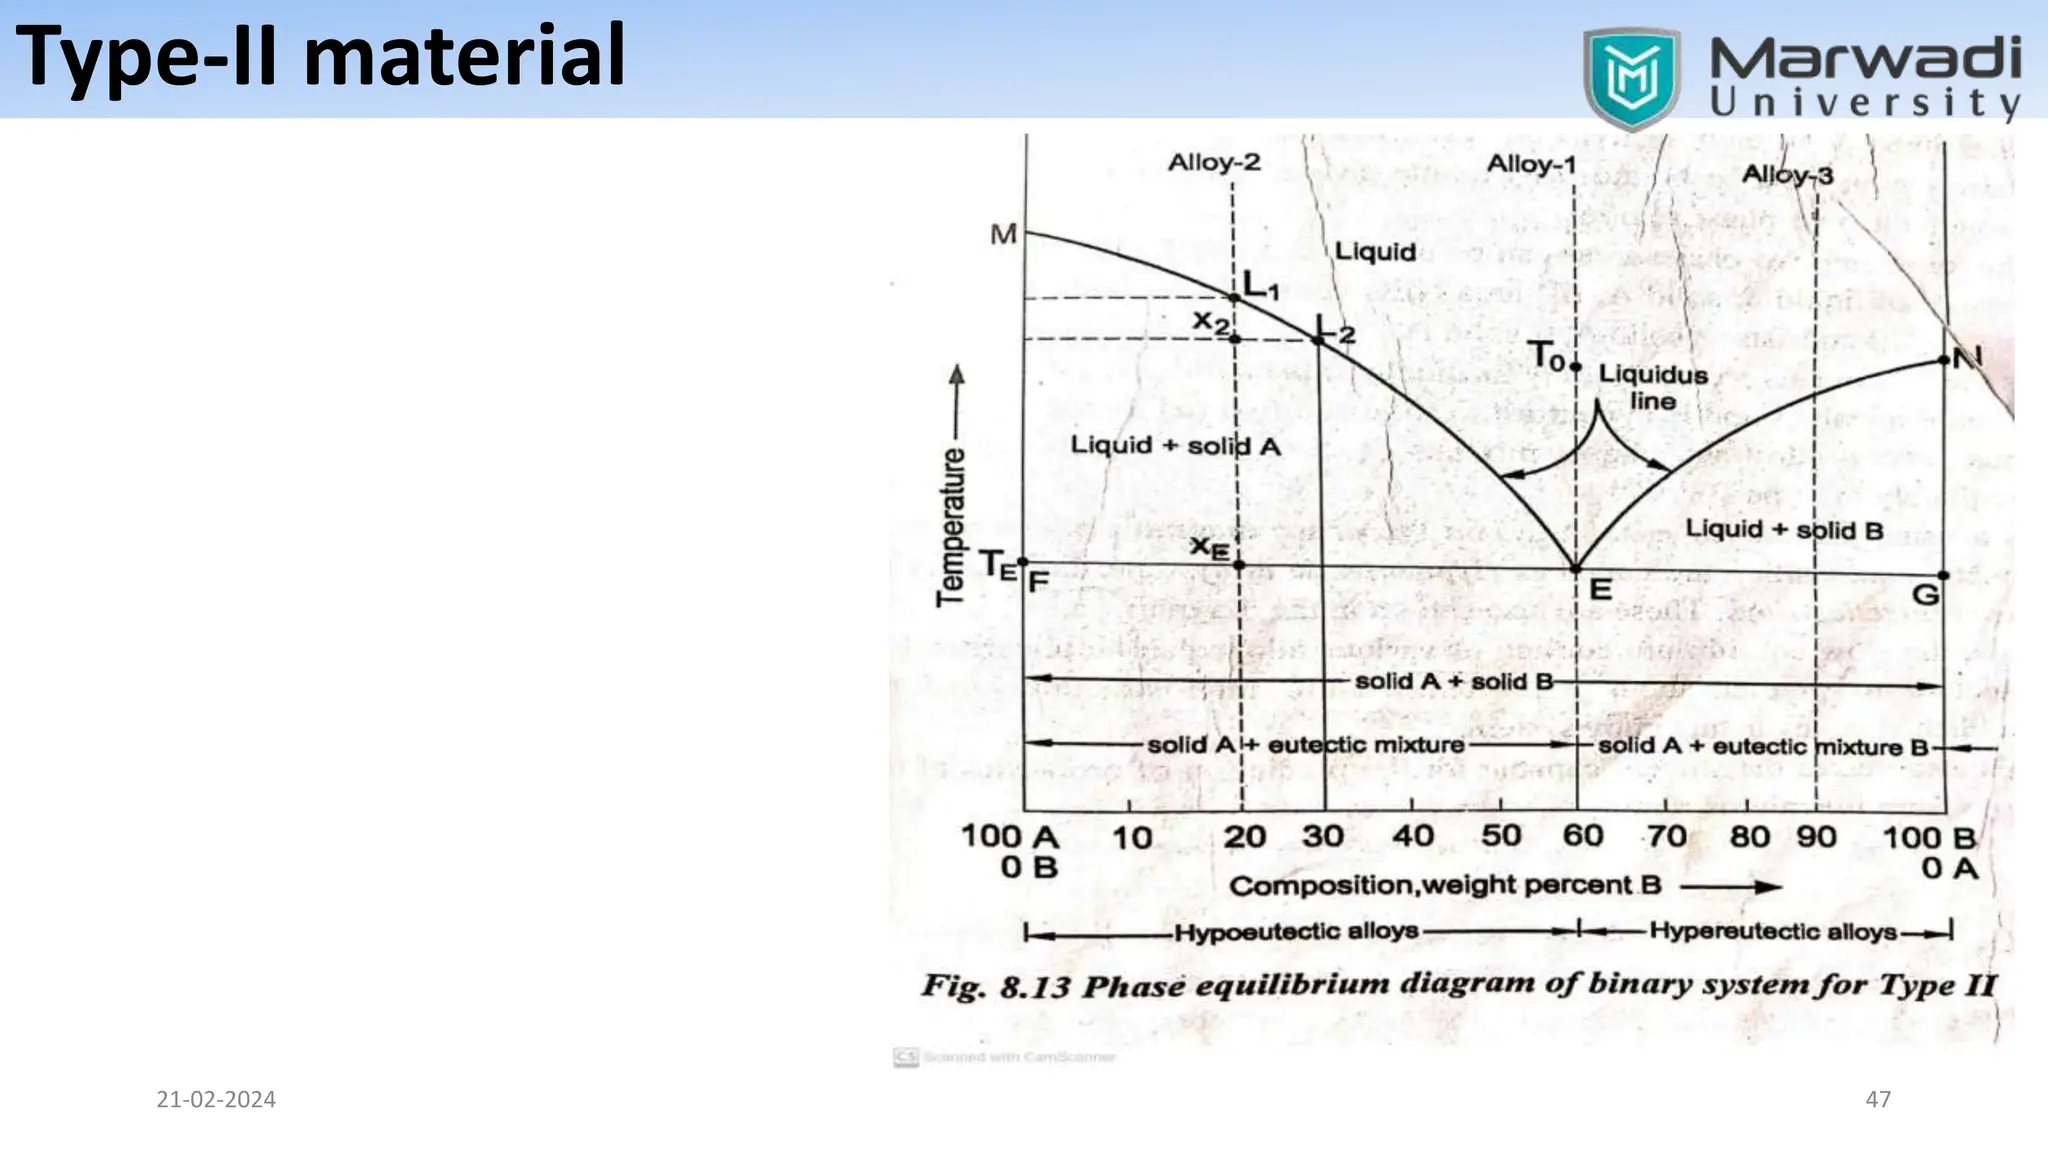
SlideShare a Scribd company logo
1 of 62
Unit : 05
PHASE DIAGRAMS
21-02-2024 1
Department of
Mechanical
Engineering
Unit no.: 05
Unit title: Phase
Diagrams
Subject Name: MSM
Prof. Puneet Mathur
Phase diagrams
21-02-2024 2
• Many of the engineering materials possess mixtures of phases, e.g. steel, paints, and
composites. The mixture of two or more phases may permit interaction between different
phases, and results in properties usually are different from the properties of individual
phases. Different components can be combined into a single material by means of
solutions or mixtures.
• A solution (liquid or solid) is phase with more than one component; a mixture is a
material with more than one phase.
• In mixtures, there are different phases, each with its own atomic arrangement. It is
possible to have a mixture of two different solutions!
Phase diagrams
21-02-2024 3
• A pure substance, under equilibrium conditions, may exist as either of a phase namely
vapor, liquid or solid, depending upon the conditions of temperature and pressure.
• “A phase can be defined as a homogeneous portion of a system that has uniform physical
and chemical characteristics.” i.e. it is a physically distinct from other phases, chemically
homogeneous and mechanically separable portion of a system.
• In other words, a phase is a structurally homogeneous portion of matter.
• When two phases are present in a system, it is not necessary that there be a difference in
both physical and chemical properties; a disparity in one or the other set of properties is
sufficient.
Useful terminology
21-02-2024 4
• Component – is either pure metal and/or compounds of which an alloy is
composed. The components of a system may be elements, ions or compounds.
They refer to the independent chemical species that comprise the system.
• System – it can either refer to a specific body of material under consideration or it
may relate to the series of possible alloys consisting of the same components but
without regard to alloy composition.
• Solid solution – it consists of atoms of at least two different types where solute
atoms occupy either substitutional or interstitial positions in the solvent lattice and
the crystal structure of the solvent is maintained.
Useful terminology
21-02-2024 5
Solubility limit – for almost all alloy systems, at a specific temperature, a maximum of solute atoms can dissolve in
solvent phase to form a solid solution. The limit is known as solubility limit. In general, solubility limit changes
with temperature. If solute available is more than the solubility limit that may lead to formation of different
phase, either a solid solution or compound.
Phase equilibrium – it refers to the set of conditions where more than one phase may exist. It can be reflected by
constancy with time in the phase characteristics of a system. In most metallurgical and materials systems, phase
equilibrium involves just solid phases. However the state of equilibrium is never completely achieved because of
very slow rate of approach of equilibrium in solid systems. This leads to non-equilibrium or meta-stable state,
which may persist indefinitely and of course, has more practical significance than equilibrium phases. An
equilibrium state of solid system can be reflected in terms of characteristics of the microstructure, phases present
and their compositions, relative phase amounts and their spatial arrangement or distribution.
Useful terminology & Thermal equilibrium diagrams/Phase diagrams
21-02-2024 6
• Variables of a system – these include two external variables namely temperature and pressure
along with internal variable such as composition (C) and number of phases (P). Number of
independent variables among these gives the degrees of freedom (F) or variance.
 With the pressure assumed to be constant at atmospheric value, the phase equilibrium
diagram indicate the structural(phase) changes due to variation of temperature and
composition. Due to this they are also known as Thermal equilibrium diagrams/Phase
diagrams/constitutional diagrams.
 Def.: A diagram which shows variations of phases of a metal or alloy w.r.t. changes in
temperature is called as phase equilibrium diagram.
Advantages of Phase Rule
21-02-2024 7
Phase rule is applicable to both Chemical and Physical equilibria.
• Phase rule is applicable to macroscopic systems and hence no information is required regarding
molecular or micro structure.
• We can conveniently classify equilibrium states in terms of phases, components and degrees of
freedom.
• The behaviour of system can be predicted under diff. conditions.
• According to phase rule, diff. systems behave similarly if they have same degrees of freedom.
• Phase rule helps in deciding under a giving set of conditions:
1) Existence of equilibrium among various substances.
2) Interconvergence of substance or
3) Disappearance of some of the substances.
Limitations of phase diagrams
21-02-2024 8
 It shows phase relationships under equilibrium conditions. They are valid under equilibrium
conditions, but such conditions are rarely achieved practically as the changes that occur do
take very small time. i.e. they are rapid changes which distort the structure/s that would, if
given infinite time, normally result under equilibrium conditions.
 This limits the use of thermal equilibrium diagrams. But, at the same time they can be used
for predicting the phase changes & non-equilibrium structures obtained by real processes.
Applications of phase equilibrium diagrams
21-02-2024 9
 Different phases may be predicted at a particular temperature & composition
of alloys.
 Predicting the transformation of phases under equilibrium conditions.
 Controlling and studying metallurgical processes such as solidification of pure
metals or alloys, crystal growth, refinement of metals or alloys and structural
changes taking place during welding, casting, forging or heat treatments.
GIBBS PHASE RULE
21-02-2024 10
It was first presented by J. Willard Gibbs in 1876.
• It is very useful to understand the effect of intensive variables, such as temperature,
pressure, or concentration, on the equilibrium between phases as well as between chemical
constituents.
• It is used to deduce the number of degrees of freedom (f) for a system. Sometimes called:
“the variance of the system”.
GIBBS PHASE RULE
21-02-2024 11
It states that :
When the equilibrium between any number of phases is influenced only by
temperature, pressure and concentration but not influenced by gravity, or
electrical or magnetic forces or by surface action then the number of Degrees of
Freedom (F) of the system is related to the number of Components (C) and of
Phases (P) by the phase rule equation:
F + P = C + N
GIBBS PHASE RULE
21-02-2024 12
“The Phase rule, known as Gibbs Phase Rule, establishes the relationship between the
number of degrees of freedom (F), the number of components (C), and the number of phases
(P).”
It is expressed mathematically as follows:
P + F = C +2
Where P = Number of Phases (e.g. solid, liquid etc.)
F = Number of degree of freedom or the number of physical variables (pressure, temperature,
concentration) that can be independently changed without altering the equilibrium, i.e.,
without causing disappearance of a phase or the formation of new phase in the system.
C = Number of components in the system;
GIBBS PHASE RULE
21-02-2024 13
For metals and alloys, pr. is considered to be fixed at 1 atm. So, ext. variable is only one
i.e. temp.
F = C – P + 1
Under equi. Condition, F > 0,
C – P + 1 > 0
P < C + 1
Unary system: at solidification temp( C=1, P=2)
F = 1 – 2 + 1 =0
System is called Non variant or Invariant.
Temp will not vary, metals solidify at a const. temp.
Unary phase diagram (Water)
21-02-2024 14
Application of Gibb’s phase rule
21-02-2024 15
Considering the figure (a), it is required to determine the number of degrees of freedom using
the phase rule.
1. Point A, in the region above the liquidus
Number of components C=1, since it is a Unary system of Water (H2O)
, Number of phases P=1 (liquid)
Applying the rule, F = C + 2 – P
= 1+2-1
= 2 degrees of freedom (Bivariant system)
Application of Gibb’s phase rule
21-02-2024 16
2. Point B, between the liquidus and solidus
Number of components C=1
Number of phases P=2 (liquid and solid) Applying the rule, F = C + 2 – P
=1+2-2
=1 degrees of freedom (Univariant system)
3. Point C, in the region above the liquidus
Number of components C=1, since it is a Unary system of Water (H2O)
, Number of phases P=3 (liquid+solid+vapor)
Applying the rule, F = C + 2 – P
= 1+2-3
= 0 degrees of freedom (Invariant system)
Application of Gibb’s phase rule
21-02-2024 17
COOLING CURVES & THEIR SIGNIFICANCE
21-02-2024 18
• When a metal or alloy is allowed to cool down from its molten state, it solidifies gradually
with time. If all the temperatures are recorded over a regular interval of time, curves showing
such a variation are obtained.
• When a metal or alloy is allowed to cool down from its molten state, it solidifies gradually
with time. If all the temperatures are recorded over a regular interval of time, curves showing
such a variation are obtained.
• Cooling Rate, on the other hand, represent the rate of cooling; i.e. how much the
temperature decreases with time or slope of the cooling curve.
Cooling curve of pure metal
21-02-2024 19
• As shown in the figure (a) when a liquid metal
cools from temperature TA to TB, the first crystal
would begin to form at point B at a certain time.
• Next, at point C the solidification is over.
• Thus, between points B and C the system of
metal contains both the liquid and solid phases
during which latent heat of fusion is liberated.
Cooling curve of pure metal
21-02-2024 20
• Now, according to Gibbs phase rule one can find out the degree of freedom for each portion of the curve &
correlate the rule with the shape of the same.
• As we know that for a pure metal, C = 1 and for portion AB phase P = 1 (only liquid).
• So, F = 1 - 1 + 1 = 1 which means that the system is univariant for portion AB and therefore, the temperature
varies (falls for cooling process) with time.
• Hence the line is sloppy from A to B. Similarly, for portion BC the system becomes nonvariant / invariant as F = 1
- 2 + 1 = 0, (P = 2 due to liquid + solid) with the understanding that now temperature does not vary with time
and so the line BC is horizontal.
• Such line represents the temperature arrest at a particular value and is called as critical point.
• Upon further cooling form C to D (up to room temperature) degree of freedom becomes F = 1 - 1 + 1 = 1 again
because the whole metal mass is now a single solid phase (P = 1) & thus the system is now univariant/
monovariant.
• It can be concluded that most pure metals solidify at a constant temperature under equilibrium.
Cooling curve of binary alloy forming solid solution
21-02-2024 21
• In this case, binary alloy means number of components will
be (C = 2) two with the condition that the two metals form a
single phase solid solution (denoted by α) during
solidification.
• As can be seen from figure (b), the portion PQ of the cooling
curve for any alloy forming solid solution has similar
tendency as that of the pure metal/s during which only
liquid phase is present.
• This shape is also confirmed by the phase rule (F = 2 - 1 + 1
= 2). The system becomes bivariant in this portion of the
curve.
Cooling curve of binary alloy forming solid solution
21-02-2024 22
• With the progress of cooling at point Q the alloy now consists of both liquid & solid phases which remain up to
point R; Thus portion QR represents a two phase region confirming that F = 2 -2 + 1 = 1 & meaning that either
temperature or composition can be varied independently and so, the system becomes univariant.
• This provides an important conclusion that an alloy does not solidify at a constant temperature like a pure
metals, but does so over a range of temperature meaning that solidification may start at a particular
temperature (say point Q for example) but it will be complete at some other lower temperature (say point R for
example).
• Such a solidification or freezing range of an alloy is due to changes in the composition of solid & liquid phases.
• Again when the entire alloy has been solidified, say at point R, with a change in slop, the alloy now cools down
to room temperature along the line RS, the point S being the end of the cooling process; i.e. room
temperature itself.
• During this portion RS, the phase rule again confirms that F = 2 - 1 + 1 = 2 and so the system becomes bivariant.
Cooling curve of binary alloy with eutectic reaction
21-02-2024 23
WX, Eutectic temp.
At W, Eutectic comp. • In this case, the two components (metals) forming the alloy
are completely soluble in each other in their liquid state but
are completely insoluble when solid.
• Now, referring to figure (c) it can be observed that during the
portion UV, the alloy is in liquid state up to point V. So, this is
similar to that of earlier two cases considered (F = 1).
• At point V, the metal which is in excess starts crystallization and
the temperature is found to drop along the line VW indicating
that there are two phases, namely, liquid solution of two
metals (phase 1) & solid pure metal crystals (phase 2).
• The change in slop of this line is because of change in
composition of liquid phase.
Cooling curve of binary alloy with eutectic reaction
21-02-2024 24
• Again Gibbs phase rule gives F = 2 - 2 + 1 - 1 indicating that system remains monovariant in this portion.
• Next, at point w, the composition of liquid metal reaches to a value - called Eutectic composition- at which both
the metals start to solidify simultaneously from the liquid solution.
• Thus, now there are three phases: two pure metals (solid phase 1 & 2) and one liquid (phase 3).
• So, when phase rule is applied, F = 2 - 3 + 1 = 0, meaning that system becomes nonvariant and therefore,
temperature does not fall during the portion wx, forming a horizontal line, an isotherm (also called thermal
arrest) on the cooling curve. This is called as Eutectic temperature.
• The composition also does not change during this portion of solidification. Further cooling up to point X,
solidification is complete at the constant temperature.
• At point X, the entire mass of alloy gets solidified completely and so, it has now two phases as solid metal 1 and
solid metal 2.
Cooling curve of binary alloy with eutectic reaction
21-02-2024 25
• Applying the phase rule from point X downwards, F = 2 – 2 + 1 = 1 which indicates that
system is now univariant and so, temperature decreases with time.
• From the point X to point Y, the cooling occurs to room temperature by following a different
slope as the composition does not change with time now.
• Generally, a binary eutectic system may solidify in two different modes:
 (i) as a combination of pure metals or
 (ii) as a combination of solid solutions (eutectic with solubility)
Construction of Phase diagram
21-02-2024 26
• For the construction of a phase diagram, thermal analysis method is normally
used.
• In this method (an experimental method) data from cooling curves of different
alloy compositions are collected and used for construction of phase diagram.
• While labeling a phase diagram Greek letters α, β, γ, δ., etc. are used to
designate solid solutions.
• This makes student capable of predicting the microstructure / s that may result
from such cooling and hence, the resulting properties.
Type I (Isomorphous system)
21-02-2024 27
Type I - TWO Metals Completely Soluble in the Liquid & Solid States (Isomorphous system):
• As the two metals are completely soluble in the solid state, the solid phase to form is only of a substitutional
solid solution type. The two metals will have the same type of crystal structure and differ in atomic radii by less
than 8%.
• The cooling curves obtained by running series of experiments for various combinations or alloys between metals
A and B, varying in composition from 100% A & 0% B to 0% A & 100% are shown in the figure (a).
• Each cooling curve is a separate experiment starting from zero time. Here they have been drawn on a single
coordinate system (temperature v / s. Time) for understanding the relationships among them.
• The cooling curves for the pure metals A and B show only a horizontal line as the solidification begins & ends at
a constant temperature. For intermediate compositions, these cooling curves show two breaks or changes in
slope because they form solid solutions.
Type I (Isomorphous system)
21-02-2024 28
Type I - TWO Metals Completely
Soluble in the Liquid & Solid States
(Isomorphous system):
• For an alloy having 80A and 20B, the
first break occurs at temperature T1,
indicating the beginning of solidification,
and the second break at T2, indicating
the end of solidification.
• All intermediate alloys show similar type
of cooling curves with two different
breaks.
Type I (Isomorphous system)
21-02-2024 29
• Now a dotted curve joining all upper points
showing beginning of solidification and another
dotted curve joining all lower points showing end
of solidification can be drawn to get the sense or
some idea of ​​the form of this phase diagram.
• Next, an actual phase diagram can be
constructed by plotting temperature v/s
composition on a separate XY - plane. The
required points are taken from the series of
cooling curves and plotted on this new XY -
plane.
Type I (Isomorphous system)
21-02-2024 30
This is done as follows:
• Referring to figure (b), as the left - most axis represents the
pure metal A, the melting point TA, is plotted along this axis.
Similarly, melting point TB, for pure metal B is plotted on the
right side axis.
• Next, a vertical line showing the alloy 80A – 20B is drawn,
and T1 and T2 form figure (a) are plotted along this vertical
line. Similarly, all other compositions are transferred to the
new diagram's X - axis and corresponding temperatures
plotted on the Y - axis by following the same procedure.
• Thus the required phase diagram is constructed when all
points are joined by a following a sequence for odd and
even numbered points as shown in fig. (b).
Type I (Isomorphous system)
21-02-2024 31
• This phase diagram (figure b) consists of two points, two lines
and three areas.
• The two points TA and TB represent the freezing points of two
pure metals.
• The upper line is called liquidus line which is obtained by
joining the points showing the beginning of solidification and
the lower line is called solidus line which is obtained by
joining the points showing the end of solidification.
• The area above liquidus line is a single phase region & any
alloy in this region consists of a homogeneous liquid solution.
• Similarly, the area below the solidus line is single phase region
and any alloy in this region consists of a homogeneous solid
solution (α - alpha in the figure).
Type I (Isomorphous system)
21-02-2024 32
• Between liquidus and solidus lines a two - phase
region exists which contains those phases which
appear the extreme boundaries the diagram; i.e.
liquid solution & solid solution.
• From the diagram drawn here information
regarding the two phase region is not provided by
it.
• It does not give information in terms of chemical
composition and relative amounts of two phases
in this two phase region.
Rule-I: Chemical composition of Phases
21-02-2024 33
• The actual chemical composition in a two - phase region in
equilibrium at a given temperature can be found out as
follows:
 Draw a horizontal line (called "Tie Line ') up to the
boundaries of the phase region. The line intersects the
boundaries at points, say L on liquidus line and S on solidus
line respectively.
 Drop vertical lines from these points of intersection on to
the X - axis, the composition axis.
 Read the value of compositions at two different points
obtained like this on X axis, the value from point L
represents composition of liquid and that from S point
composition of solid formed, at given temperature for alloy
considered.
Rule-I: Chemical composition of Phases
21-02-2024 34
• Consider an alloy of composition 60A - 40B at
the temperature T in a two phase region as
shown in figure (c).
• The Rule - I is applied to it by drawing tie line
SL which intersects boundaries of the field, at
point L on liquidus line & point S on solidus
line.
• By dropping verticals from these two points on
X - axis, they give composition of liquid as 52A
- 46B and that of solid solution as 70A - 30B.
Rule-II: Relative amount of phases (Lever rule)
21-02-2024 35
• In a two - phase region of any phase diagram, one can
determine relative amounts of the phases present in it
by applying rule-II, Also called Lever rule.
• To determine the relative amount of the two phases in
equilibrium at any given temperature in two phase
region, draw a vertical line from a point representing
the overall composition of the alloy under
consideration.
• Also, draw a horizontal tie line up to the boundaries of
the field (as in Rule-I). The vertical line will divide the
horizontal line into two parts.
Rule-II: Relative amount of phases (Lever rule)
21-02-2024 36
• The lengths of these parts are inversely proportional
to the amount of the phases present. The
intersection of horizontal & vertical lines may be
considered fulcrum of a lever system for which the
lever is tie line up to the boundaries of the field.
• The relative lengths of the lever arms multiplied by
the amounts of the phases must show a balance.
• In figure (C) the vertical line, showing the alloy of
composition 60A – 40B, divides the horizontal tie line
in to two parts, LO and SO, the fulcrum being O on the
diagram.
Rule-II: Relative amount of phases (Lever rule)
21-02-2024 37
• When the lever length LS is taken to represent
100 percent, or total weight of the two phases
present at temperature T, the lever rule may be
given as under:
• Relative amount of liquid = SO / SL x 100 %
• Relative amount of solid solution (α) = LO / SL x 100 %
• For given example of alloy composition 80A-20B
• Liquid (percent) = 10/16 x 100 = 62.5%
• Solid solution a (percent) = 6/16 x 100 = 37.5%
Example based on Type-I material
21-02-2024 38
Ex.1 Platinum (Pt) and Gold (Au) are completely soluble in both the liquid & solid states. The melting point of
platinum is 1775 °C and that of gold is 1062 °C . An alloy containing 40% gold starts to solidify at 1585 °C by
separating crystals of 15% gold. An alloy containing 70% gold starts to solidify at 1385 °C by separating crystals
of 37% gold, and an alloy containing 90% gold starts to solidify at 1190 °C by separating crystals of 64% gold.
(a) Draw the equilibrium diagram of Gold - Platinum binary system and label all transformation points, lines and
phase fields.
(b) For an alloy containing 50% gold, determine the relative amounts of solid and liquid phases in equilibrium at
1385 oC.
(c) Draw the cooling curve for the alloy stated in (b) above.
Example - I (Type I material)
21-02-2024 39
Example - I (Type I material)
21-02-2024 40
Type-I material (Example)
21-02-2024 41
Example - I (Type I material)
21-02-2024 42
Example - I (Type I material)
21-02-2024 43
Example - I (Type I material)
21-02-2024 44
Type –II materials
21-02-2024 45
Type - II - TWO Metals Completely
Soluble in the Liquid state &
completely Insoluble in the Solid
States:
• Practically, no two metals are
completely insoluble in each other. In
some cases the solubility is so small that
for all practical purposes those metals
may be consider insoluble.
• For type-II binary equilibrium diagram to
understand, Raoult’s law must be
referred to.
Type –II materials
21-02-2024 46
 Raoult’s Law: It states that the freezing
point of a pure substance will be
lowered by the addition of a second
substance provided the later is soluble
in the pure substance when liquid and
insoluble when solidified.
 This phase diagram can be constructed
from a series of cooling curves as shown
in fig. (a) including cooling curve of pure
metals forming the series of an alloys.
Type-II material
21-02-2024 47
Type-II material (Example)
21-02-2024 48
Ex.2 Bismuth (Bi) and cadmium (Cd), with melting points of 270'C and 320 ° C respectively,
are completely soluble in the liquid state but practically insoluble in the solid state. They
form a eutectic of composition 40% Bi at 145 ° C temperature.
Your Task:
(a)Construct a phase diagram & label all points, lines and phase regions.
(b)b) For an alloy containing 80% Bi, sketch the corresponding cooling curve taking
necessary points from the phase diagram.
(c)Calculate the amount of proeutectic & eutectic constituents obtained upon slow cooling
to room temperature for this alloy.
Type-II material (Example)
21-02-2024 49
Type-II material (Example)
21-02-2024 50
Type-II material (Example)
21-02-2024 51
• By referring to the figure above relative amounts of proeutectic & eutectic for the given alloy (80% Bi) at
room temperature can be calculated as under:
• In the phase diagram draw lever 'xy' (horizontally) at room temperature and a vertical line indicating 80%
Bi alloy.
• Intersection point of these two lines is fulcrum 'o'. So,
• % of proeutectic Bi = xo / xy x 100 = 80-40 / 100-40 x 100
= 66.7%
• % of eutectic (Bi + Cd) = oy / xy x 100 = 100-80 / 100-40 x 100 =
= 33.3%
Type-III materials
21-02-2024 52
Type - III - Two Metals Completely Soluble in the
Liquid state but only partly soluble in the Solid
State:
• This type of phase diagram is most common as
most of the metals show some solubility for
each other in their solid state, and so, it is
important from study view point.
• For two metals A and B, the melting points are
indicated by TA and TB respectively. The
continuous line TAETB is liquidus line and
another line TAFEGTB forms solidus line.
• Many binary systems have components which
have limited solid solubility, e.g.: Cu-Ag, Pb-Sn.
The regions of limited solid solubility at each
end of a phase diagram are called terminal
solid solutions as they appear at ends of the
diagram.
Type-III materials
21-02-2024 53
• Here, as the two metals are partly soluble in
the solid state, the solid solutions form.
• Also, alloys in this system always solidify as a
solid solution or mixture of solid solutions.
They never solidify crystals of pure A or pure
B.
• The three two-phase areas may now be
labeled as liquid + α, liquid + β and α + β. At
temperature TE the α solid solution dissolves
a maximum of 20% of B indicated by point F.
Type-III materials
21-02-2024 54
• With decreasing temperature, the
maximum amount of solute (B) that can be
dissolved decreases as shown by line FH,
called solvus line. This line indicates
maximum solubility of B in A (α solution) as
a function of temperature.
• Similarly, at TE, the β solution dissolves
maximum of 10% of A indicated by point G
and similar decrease in solubility is shown
by another solvus line GJ for β solution.
• Point E, where the liquidus lines meet at a
minimum, is known as eutectic point.
Important reactions on Phase diagrams
21-02-2024 55
Important reactions on Phase diagrams
21-02-2024 56
Type-III materials (Example)
21-02-2024 57
Ex.3 Following is the data for a hypothetical binary system of components A and B:
Melting point of A = 700 oC
Melting point of B = 920 oC
Eutectic temperature = 400 °C
Eutectic composition = 40% A-60% B
Solubility of B in A at 400 °C = 14%
Solubility of A in B at 400 °C = 9%
Solubility of Bin A at room temperature = 1%
Solubility of A in B at room temperature = 0.1%
Your Task: (a) Construct the phase equilibrium diagram consistent with above data, and label all points, lines and phase
regions,
(b) Draw the cooling curve for the eutectic alloy
c) Calculate the amount of proeutectic & eutectic constituents that exist just below the eutectic temperature for 60% A-40%
B alloy.
Type-III material (Example)
21-02-2024 58
Type-III materials (Example)
21-02-2024 59
Type-III material (Example)
21-02-2024 60
 Cooling curve for 40% A - 60% B eutectic alloy is also shown in
the figure (b).
 By referring to the figure above, relative amounts of
proeutectic & eutectic for the 60% A - 40% B alloy just below
the eutectic temperature of 400 oC can be calculated as under:
 Assuming that eutectic line FE coincides with just - below -
temperature - line F1E1 :
 then in the figure above, line "F1 E1 'represent the lever and'
O1 'the fulcrum.
 Then,
 % of proeutectic (α) = E1O1/ F1 E1 x 100 =
= ( 60 - 40) /(60 -
14) *100
= 43.48%
 % of eutectic (α+β) = F1 01 / F1 E1 x 100
= (40 - 147 (60 - 14)
*100
21-02-2024 61
Type-III material (Example)
21-02-2024 62
Thank You
?

More Related Content

Similar to Unit 5_ Materials Phase diagram_Part 2.pptx

Similar to Unit 5_ Materials Phase diagram_Part 2.pptx (20)

TED_MSM.pptx
TED_MSM.pptxTED_MSM.pptx
TED_MSM.pptx
 
Phase Diagrams
Phase DiagramsPhase Diagrams
Phase Diagrams
 
Phase Rule for BTech class.pptx
Phase Rule for BTech class.pptxPhase Rule for BTech class.pptx
Phase Rule for BTech class.pptx
 
MATERIAL SCIENCE
MATERIAL SCIENCEMATERIAL SCIENCE
MATERIAL SCIENCE
 
phasediagram
phasediagramphasediagram
phasediagram
 
06479 g sample_buynow
06479 g sample_buynow06479 g sample_buynow
06479 g sample_buynow
 
Phase Transformation Lecture equilibrium, Phase Diagram
Phase Transformation Lecture equilibrium, Phase Diagram Phase Transformation Lecture equilibrium, Phase Diagram
Phase Transformation Lecture equilibrium, Phase Diagram
 
Chapter 9 phase diagrams 1
Chapter 9 phase diagrams 1Chapter 9 phase diagrams 1
Chapter 9 phase diagrams 1
 
EMM - Unit 1.pptx
EMM - Unit 1.pptxEMM - Unit 1.pptx
EMM - Unit 1.pptx
 
EM.pptx
EM.pptxEM.pptx
EM.pptx
 
Phasediagram
PhasediagramPhasediagram
Phasediagram
 
4. phase rule
4. phase rule4. phase rule
4. phase rule
 
Introduction to phase diagram.pptx
Introduction to phase diagram.pptxIntroduction to phase diagram.pptx
Introduction to phase diagram.pptx
 
Phase Diagram
Phase DiagramPhase Diagram
Phase Diagram
 
Phase Rule.ppt
Phase Rule.pptPhase Rule.ppt
Phase Rule.ppt
 
NH Phase Diagrams.ppt
NH Phase Diagrams.pptNH Phase Diagrams.ppt
NH Phase Diagrams.ppt
 
5 phase rule and steels
5 phase rule and steels5 phase rule and steels
5 phase rule and steels
 
2-4-PhaseEquilibriumGeneric.pdf
2-4-PhaseEquilibriumGeneric.pdf2-4-PhaseEquilibriumGeneric.pdf
2-4-PhaseEquilibriumGeneric.pdf
 
2006 E.C. aait materials i regular chapter 6 introduction to phase diagrams
 2006 E.C. aait materials i regular chapter 6 introduction to phase diagrams 2006 E.C. aait materials i regular chapter 6 introduction to phase diagrams
2006 E.C. aait materials i regular chapter 6 introduction to phase diagrams
 
phase-behavior
phase-behaviorphase-behavior
phase-behavior
 

More from PuneetMathur39

Ch-5.0_Robot Technology - CIM.pptx
Ch-5.0_Robot Technology - CIM.pptxCh-5.0_Robot Technology - CIM.pptx
Ch-5.0_Robot Technology - CIM.pptxPuneetMathur39
 
Geometric Modeling.pptx
Geometric Modeling.pptxGeometric Modeling.pptx
Geometric Modeling.pptxPuneetMathur39
 
14 Emotional Development.ppt
14 Emotional Development.ppt14 Emotional Development.ppt
14 Emotional Development.pptPuneetMathur39
 
Academic audit presentation.pptx
Academic audit presentation.pptxAcademic audit presentation.pptx
Academic audit presentation.pptxPuneetMathur39
 
DSR_Unit-5_Sensors.pptx
DSR_Unit-5_Sensors.pptxDSR_Unit-5_Sensors.pptx
DSR_Unit-5_Sensors.pptxPuneetMathur39
 
Project Presentation.pptx
Project Presentation.pptxProject Presentation.pptx
Project Presentation.pptxPuneetMathur39
 
power transmission system.pptx
power transmission system.pptxpower transmission system.pptx
power transmission system.pptxPuneetMathur39
 

More from PuneetMathur39 (10)

3972991.ppt
3972991.ppt3972991.ppt
3972991.ppt
 
Ch-5.0_Robot Technology - CIM.pptx
Ch-5.0_Robot Technology - CIM.pptxCh-5.0_Robot Technology - CIM.pptx
Ch-5.0_Robot Technology - CIM.pptx
 
Geometric Modeling.pptx
Geometric Modeling.pptxGeometric Modeling.pptx
Geometric Modeling.pptx
 
14 Emotional Development.ppt
14 Emotional Development.ppt14 Emotional Development.ppt
14 Emotional Development.ppt
 
2D_line_circle.ppt
2D_line_circle.ppt2D_line_circle.ppt
2D_line_circle.ppt
 
Academic audit presentation.pptx
Academic audit presentation.pptxAcademic audit presentation.pptx
Academic audit presentation.pptx
 
DSR_Unit-5_Sensors.pptx
DSR_Unit-5_Sensors.pptxDSR_Unit-5_Sensors.pptx
DSR_Unit-5_Sensors.pptx
 
Ch-1_CIM-intro.pptx
Ch-1_CIM-intro.pptxCh-1_CIM-intro.pptx
Ch-1_CIM-intro.pptx
 
Project Presentation.pptx
Project Presentation.pptxProject Presentation.pptx
Project Presentation.pptx
 
power transmission system.pptx
power transmission system.pptxpower transmission system.pptx
power transmission system.pptx
 

Recently uploaded

Separation of Lanthanides/ Lanthanides and Actinides
Separation of Lanthanides/ Lanthanides and ActinidesSeparation of Lanthanides/ Lanthanides and Actinides
Separation of Lanthanides/ Lanthanides and ActinidesFatimaKhan178732
 
Science 7 - LAND and SEA BREEZE and its Characteristics
Science 7 - LAND and SEA BREEZE and its CharacteristicsScience 7 - LAND and SEA BREEZE and its Characteristics
Science 7 - LAND and SEA BREEZE and its CharacteristicsKarinaGenton
 
Software Engineering Methodologies (overview)
Software Engineering Methodologies (overview)Software Engineering Methodologies (overview)
Software Engineering Methodologies (overview)eniolaolutunde
 
Introduction to AI in Higher Education_draft.pptx
Introduction to AI in Higher Education_draft.pptxIntroduction to AI in Higher Education_draft.pptx
Introduction to AI in Higher Education_draft.pptxpboyjonauth
 
BASLIQ CURRENT LOOKBOOK LOOKBOOK(1) (1).pdf
BASLIQ CURRENT LOOKBOOK  LOOKBOOK(1) (1).pdfBASLIQ CURRENT LOOKBOOK  LOOKBOOK(1) (1).pdf
BASLIQ CURRENT LOOKBOOK LOOKBOOK(1) (1).pdfSoniaTolstoy
 
18-04-UA_REPORT_MEDIALITERAСY_INDEX-DM_23-1-final-eng.pdf
18-04-UA_REPORT_MEDIALITERAСY_INDEX-DM_23-1-final-eng.pdf18-04-UA_REPORT_MEDIALITERAСY_INDEX-DM_23-1-final-eng.pdf
18-04-UA_REPORT_MEDIALITERAСY_INDEX-DM_23-1-final-eng.pdfssuser54595a
 
Organic Name Reactions for the students and aspirants of Chemistry12th.pptx
Organic Name Reactions  for the students and aspirants of Chemistry12th.pptxOrganic Name Reactions  for the students and aspirants of Chemistry12th.pptx
Organic Name Reactions for the students and aspirants of Chemistry12th.pptxVS Mahajan Coaching Centre
 
SOCIAL AND HISTORICAL CONTEXT - LFTVD.pptx
SOCIAL AND HISTORICAL CONTEXT - LFTVD.pptxSOCIAL AND HISTORICAL CONTEXT - LFTVD.pptx
SOCIAL AND HISTORICAL CONTEXT - LFTVD.pptxiammrhaywood
 
Introduction to ArtificiaI Intelligence in Higher Education
Introduction to ArtificiaI Intelligence in Higher EducationIntroduction to ArtificiaI Intelligence in Higher Education
Introduction to ArtificiaI Intelligence in Higher Educationpboyjonauth
 
mini mental status format.docx
mini    mental       status     format.docxmini    mental       status     format.docx
mini mental status format.docxPoojaSen20
 
How to Make a Pirate ship Primary Education.pptx
How to Make a Pirate ship Primary Education.pptxHow to Make a Pirate ship Primary Education.pptx
How to Make a Pirate ship Primary Education.pptxmanuelaromero2013
 
Solving Puzzles Benefits Everyone (English).pptx
Solving Puzzles Benefits Everyone (English).pptxSolving Puzzles Benefits Everyone (English).pptx
Solving Puzzles Benefits Everyone (English).pptxOH TEIK BIN
 
CARE OF CHILD IN INCUBATOR..........pptx
CARE OF CHILD IN INCUBATOR..........pptxCARE OF CHILD IN INCUBATOR..........pptx
CARE OF CHILD IN INCUBATOR..........pptxGaneshChakor2
 
MENTAL STATUS EXAMINATION format.docx
MENTAL     STATUS EXAMINATION format.docxMENTAL     STATUS EXAMINATION format.docx
MENTAL STATUS EXAMINATION format.docxPoojaSen20
 
How to Configure Email Server in Odoo 17
How to Configure Email Server in Odoo 17How to Configure Email Server in Odoo 17
How to Configure Email Server in Odoo 17Celine George
 
Kisan Call Centre - To harness potential of ICT in Agriculture by answer farm...
Kisan Call Centre - To harness potential of ICT in Agriculture by answer farm...Kisan Call Centre - To harness potential of ICT in Agriculture by answer farm...
Kisan Call Centre - To harness potential of ICT in Agriculture by answer farm...Krashi Coaching
 
KSHARA STURA .pptx---KSHARA KARMA THERAPY (CAUSTIC THERAPY)————IMP.OF KSHARA ...
KSHARA STURA .pptx---KSHARA KARMA THERAPY (CAUSTIC THERAPY)————IMP.OF KSHARA ...KSHARA STURA .pptx---KSHARA KARMA THERAPY (CAUSTIC THERAPY)————IMP.OF KSHARA ...
KSHARA STURA .pptx---KSHARA KARMA THERAPY (CAUSTIC THERAPY)————IMP.OF KSHARA ...M56BOOKSTORE PRODUCT/SERVICE
 
Mastering the Unannounced Regulatory Inspection
Mastering the Unannounced Regulatory InspectionMastering the Unannounced Regulatory Inspection
Mastering the Unannounced Regulatory InspectionSafetyChain Software
 

Recently uploaded (20)

Separation of Lanthanides/ Lanthanides and Actinides
Separation of Lanthanides/ Lanthanides and ActinidesSeparation of Lanthanides/ Lanthanides and Actinides
Separation of Lanthanides/ Lanthanides and Actinides
 
Science 7 - LAND and SEA BREEZE and its Characteristics
Science 7 - LAND and SEA BREEZE and its CharacteristicsScience 7 - LAND and SEA BREEZE and its Characteristics
Science 7 - LAND and SEA BREEZE and its Characteristics
 
Software Engineering Methodologies (overview)
Software Engineering Methodologies (overview)Software Engineering Methodologies (overview)
Software Engineering Methodologies (overview)
 
Introduction to AI in Higher Education_draft.pptx
Introduction to AI in Higher Education_draft.pptxIntroduction to AI in Higher Education_draft.pptx
Introduction to AI in Higher Education_draft.pptx
 
BASLIQ CURRENT LOOKBOOK LOOKBOOK(1) (1).pdf
BASLIQ CURRENT LOOKBOOK  LOOKBOOK(1) (1).pdfBASLIQ CURRENT LOOKBOOK  LOOKBOOK(1) (1).pdf
BASLIQ CURRENT LOOKBOOK LOOKBOOK(1) (1).pdf
 
18-04-UA_REPORT_MEDIALITERAСY_INDEX-DM_23-1-final-eng.pdf
18-04-UA_REPORT_MEDIALITERAСY_INDEX-DM_23-1-final-eng.pdf18-04-UA_REPORT_MEDIALITERAСY_INDEX-DM_23-1-final-eng.pdf
18-04-UA_REPORT_MEDIALITERAСY_INDEX-DM_23-1-final-eng.pdf
 
Organic Name Reactions for the students and aspirants of Chemistry12th.pptx
Organic Name Reactions  for the students and aspirants of Chemistry12th.pptxOrganic Name Reactions  for the students and aspirants of Chemistry12th.pptx
Organic Name Reactions for the students and aspirants of Chemistry12th.pptx
 
SOCIAL AND HISTORICAL CONTEXT - LFTVD.pptx
SOCIAL AND HISTORICAL CONTEXT - LFTVD.pptxSOCIAL AND HISTORICAL CONTEXT - LFTVD.pptx
SOCIAL AND HISTORICAL CONTEXT - LFTVD.pptx
 
Introduction to ArtificiaI Intelligence in Higher Education
Introduction to ArtificiaI Intelligence in Higher EducationIntroduction to ArtificiaI Intelligence in Higher Education
Introduction to ArtificiaI Intelligence in Higher Education
 
mini mental status format.docx
mini    mental       status     format.docxmini    mental       status     format.docx
mini mental status format.docx
 
How to Make a Pirate ship Primary Education.pptx
How to Make a Pirate ship Primary Education.pptxHow to Make a Pirate ship Primary Education.pptx
How to Make a Pirate ship Primary Education.pptx
 
Solving Puzzles Benefits Everyone (English).pptx
Solving Puzzles Benefits Everyone (English).pptxSolving Puzzles Benefits Everyone (English).pptx
Solving Puzzles Benefits Everyone (English).pptx
 
CARE OF CHILD IN INCUBATOR..........pptx
CARE OF CHILD IN INCUBATOR..........pptxCARE OF CHILD IN INCUBATOR..........pptx
CARE OF CHILD IN INCUBATOR..........pptx
 
MENTAL STATUS EXAMINATION format.docx
MENTAL     STATUS EXAMINATION format.docxMENTAL     STATUS EXAMINATION format.docx
MENTAL STATUS EXAMINATION format.docx
 
How to Configure Email Server in Odoo 17
How to Configure Email Server in Odoo 17How to Configure Email Server in Odoo 17
How to Configure Email Server in Odoo 17
 
Kisan Call Centre - To harness potential of ICT in Agriculture by answer farm...
Kisan Call Centre - To harness potential of ICT in Agriculture by answer farm...Kisan Call Centre - To harness potential of ICT in Agriculture by answer farm...
Kisan Call Centre - To harness potential of ICT in Agriculture by answer farm...
 
9953330565 Low Rate Call Girls In Rohini Delhi NCR
9953330565 Low Rate Call Girls In Rohini  Delhi NCR9953330565 Low Rate Call Girls In Rohini  Delhi NCR
9953330565 Low Rate Call Girls In Rohini Delhi NCR
 
KSHARA STURA .pptx---KSHARA KARMA THERAPY (CAUSTIC THERAPY)————IMP.OF KSHARA ...
KSHARA STURA .pptx---KSHARA KARMA THERAPY (CAUSTIC THERAPY)————IMP.OF KSHARA ...KSHARA STURA .pptx---KSHARA KARMA THERAPY (CAUSTIC THERAPY)————IMP.OF KSHARA ...
KSHARA STURA .pptx---KSHARA KARMA THERAPY (CAUSTIC THERAPY)————IMP.OF KSHARA ...
 
Mastering the Unannounced Regulatory Inspection
Mastering the Unannounced Regulatory InspectionMastering the Unannounced Regulatory Inspection
Mastering the Unannounced Regulatory Inspection
 
TataKelola dan KamSiber Kecerdasan Buatan v022.pdf
TataKelola dan KamSiber Kecerdasan Buatan v022.pdfTataKelola dan KamSiber Kecerdasan Buatan v022.pdf
TataKelola dan KamSiber Kecerdasan Buatan v022.pdf
 

Unit 5_ Materials Phase diagram_Part 2.pptx

  • 1. Unit : 05 PHASE DIAGRAMS 21-02-2024 1 Department of Mechanical Engineering Unit no.: 05 Unit title: Phase Diagrams Subject Name: MSM Prof. Puneet Mathur
  • 2. Phase diagrams 21-02-2024 2 • Many of the engineering materials possess mixtures of phases, e.g. steel, paints, and composites. The mixture of two or more phases may permit interaction between different phases, and results in properties usually are different from the properties of individual phases. Different components can be combined into a single material by means of solutions or mixtures. • A solution (liquid or solid) is phase with more than one component; a mixture is a material with more than one phase. • In mixtures, there are different phases, each with its own atomic arrangement. It is possible to have a mixture of two different solutions!
  • 3. Phase diagrams 21-02-2024 3 • A pure substance, under equilibrium conditions, may exist as either of a phase namely vapor, liquid or solid, depending upon the conditions of temperature and pressure. • “A phase can be defined as a homogeneous portion of a system that has uniform physical and chemical characteristics.” i.e. it is a physically distinct from other phases, chemically homogeneous and mechanically separable portion of a system. • In other words, a phase is a structurally homogeneous portion of matter. • When two phases are present in a system, it is not necessary that there be a difference in both physical and chemical properties; a disparity in one or the other set of properties is sufficient.
  • 4. Useful terminology 21-02-2024 4 • Component – is either pure metal and/or compounds of which an alloy is composed. The components of a system may be elements, ions or compounds. They refer to the independent chemical species that comprise the system. • System – it can either refer to a specific body of material under consideration or it may relate to the series of possible alloys consisting of the same components but without regard to alloy composition. • Solid solution – it consists of atoms of at least two different types where solute atoms occupy either substitutional or interstitial positions in the solvent lattice and the crystal structure of the solvent is maintained.
  • 5. Useful terminology 21-02-2024 5 Solubility limit – for almost all alloy systems, at a specific temperature, a maximum of solute atoms can dissolve in solvent phase to form a solid solution. The limit is known as solubility limit. In general, solubility limit changes with temperature. If solute available is more than the solubility limit that may lead to formation of different phase, either a solid solution or compound. Phase equilibrium – it refers to the set of conditions where more than one phase may exist. It can be reflected by constancy with time in the phase characteristics of a system. In most metallurgical and materials systems, phase equilibrium involves just solid phases. However the state of equilibrium is never completely achieved because of very slow rate of approach of equilibrium in solid systems. This leads to non-equilibrium or meta-stable state, which may persist indefinitely and of course, has more practical significance than equilibrium phases. An equilibrium state of solid system can be reflected in terms of characteristics of the microstructure, phases present and their compositions, relative phase amounts and their spatial arrangement or distribution.
  • 6. Useful terminology & Thermal equilibrium diagrams/Phase diagrams 21-02-2024 6 • Variables of a system – these include two external variables namely temperature and pressure along with internal variable such as composition (C) and number of phases (P). Number of independent variables among these gives the degrees of freedom (F) or variance.  With the pressure assumed to be constant at atmospheric value, the phase equilibrium diagram indicate the structural(phase) changes due to variation of temperature and composition. Due to this they are also known as Thermal equilibrium diagrams/Phase diagrams/constitutional diagrams.  Def.: A diagram which shows variations of phases of a metal or alloy w.r.t. changes in temperature is called as phase equilibrium diagram.
  • 7. Advantages of Phase Rule 21-02-2024 7 Phase rule is applicable to both Chemical and Physical equilibria. • Phase rule is applicable to macroscopic systems and hence no information is required regarding molecular or micro structure. • We can conveniently classify equilibrium states in terms of phases, components and degrees of freedom. • The behaviour of system can be predicted under diff. conditions. • According to phase rule, diff. systems behave similarly if they have same degrees of freedom. • Phase rule helps in deciding under a giving set of conditions: 1) Existence of equilibrium among various substances. 2) Interconvergence of substance or 3) Disappearance of some of the substances.
  • 8. Limitations of phase diagrams 21-02-2024 8  It shows phase relationships under equilibrium conditions. They are valid under equilibrium conditions, but such conditions are rarely achieved practically as the changes that occur do take very small time. i.e. they are rapid changes which distort the structure/s that would, if given infinite time, normally result under equilibrium conditions.  This limits the use of thermal equilibrium diagrams. But, at the same time they can be used for predicting the phase changes & non-equilibrium structures obtained by real processes.
  • 9. Applications of phase equilibrium diagrams 21-02-2024 9  Different phases may be predicted at a particular temperature & composition of alloys.  Predicting the transformation of phases under equilibrium conditions.  Controlling and studying metallurgical processes such as solidification of pure metals or alloys, crystal growth, refinement of metals or alloys and structural changes taking place during welding, casting, forging or heat treatments.
  • 10. GIBBS PHASE RULE 21-02-2024 10 It was first presented by J. Willard Gibbs in 1876. • It is very useful to understand the effect of intensive variables, such as temperature, pressure, or concentration, on the equilibrium between phases as well as between chemical constituents. • It is used to deduce the number of degrees of freedom (f) for a system. Sometimes called: “the variance of the system”.
  • 11. GIBBS PHASE RULE 21-02-2024 11 It states that : When the equilibrium between any number of phases is influenced only by temperature, pressure and concentration but not influenced by gravity, or electrical or magnetic forces or by surface action then the number of Degrees of Freedom (F) of the system is related to the number of Components (C) and of Phases (P) by the phase rule equation: F + P = C + N
  • 12. GIBBS PHASE RULE 21-02-2024 12 “The Phase rule, known as Gibbs Phase Rule, establishes the relationship between the number of degrees of freedom (F), the number of components (C), and the number of phases (P).” It is expressed mathematically as follows: P + F = C +2 Where P = Number of Phases (e.g. solid, liquid etc.) F = Number of degree of freedom or the number of physical variables (pressure, temperature, concentration) that can be independently changed without altering the equilibrium, i.e., without causing disappearance of a phase or the formation of new phase in the system. C = Number of components in the system;
  • 13. GIBBS PHASE RULE 21-02-2024 13 For metals and alloys, pr. is considered to be fixed at 1 atm. So, ext. variable is only one i.e. temp. F = C – P + 1 Under equi. Condition, F > 0, C – P + 1 > 0 P < C + 1 Unary system: at solidification temp( C=1, P=2) F = 1 – 2 + 1 =0 System is called Non variant or Invariant. Temp will not vary, metals solidify at a const. temp.
  • 14. Unary phase diagram (Water) 21-02-2024 14
  • 15. Application of Gibb’s phase rule 21-02-2024 15 Considering the figure (a), it is required to determine the number of degrees of freedom using the phase rule. 1. Point A, in the region above the liquidus Number of components C=1, since it is a Unary system of Water (H2O) , Number of phases P=1 (liquid) Applying the rule, F = C + 2 – P = 1+2-1 = 2 degrees of freedom (Bivariant system)
  • 16. Application of Gibb’s phase rule 21-02-2024 16 2. Point B, between the liquidus and solidus Number of components C=1 Number of phases P=2 (liquid and solid) Applying the rule, F = C + 2 – P =1+2-2 =1 degrees of freedom (Univariant system) 3. Point C, in the region above the liquidus Number of components C=1, since it is a Unary system of Water (H2O) , Number of phases P=3 (liquid+solid+vapor) Applying the rule, F = C + 2 – P = 1+2-3 = 0 degrees of freedom (Invariant system)
  • 17. Application of Gibb’s phase rule 21-02-2024 17
  • 18. COOLING CURVES & THEIR SIGNIFICANCE 21-02-2024 18 • When a metal or alloy is allowed to cool down from its molten state, it solidifies gradually with time. If all the temperatures are recorded over a regular interval of time, curves showing such a variation are obtained. • When a metal or alloy is allowed to cool down from its molten state, it solidifies gradually with time. If all the temperatures are recorded over a regular interval of time, curves showing such a variation are obtained. • Cooling Rate, on the other hand, represent the rate of cooling; i.e. how much the temperature decreases with time or slope of the cooling curve.
  • 19. Cooling curve of pure metal 21-02-2024 19 • As shown in the figure (a) when a liquid metal cools from temperature TA to TB, the first crystal would begin to form at point B at a certain time. • Next, at point C the solidification is over. • Thus, between points B and C the system of metal contains both the liquid and solid phases during which latent heat of fusion is liberated.
  • 20. Cooling curve of pure metal 21-02-2024 20 • Now, according to Gibbs phase rule one can find out the degree of freedom for each portion of the curve & correlate the rule with the shape of the same. • As we know that for a pure metal, C = 1 and for portion AB phase P = 1 (only liquid). • So, F = 1 - 1 + 1 = 1 which means that the system is univariant for portion AB and therefore, the temperature varies (falls for cooling process) with time. • Hence the line is sloppy from A to B. Similarly, for portion BC the system becomes nonvariant / invariant as F = 1 - 2 + 1 = 0, (P = 2 due to liquid + solid) with the understanding that now temperature does not vary with time and so the line BC is horizontal. • Such line represents the temperature arrest at a particular value and is called as critical point. • Upon further cooling form C to D (up to room temperature) degree of freedom becomes F = 1 - 1 + 1 = 1 again because the whole metal mass is now a single solid phase (P = 1) & thus the system is now univariant/ monovariant. • It can be concluded that most pure metals solidify at a constant temperature under equilibrium.
  • 21. Cooling curve of binary alloy forming solid solution 21-02-2024 21 • In this case, binary alloy means number of components will be (C = 2) two with the condition that the two metals form a single phase solid solution (denoted by α) during solidification. • As can be seen from figure (b), the portion PQ of the cooling curve for any alloy forming solid solution has similar tendency as that of the pure metal/s during which only liquid phase is present. • This shape is also confirmed by the phase rule (F = 2 - 1 + 1 = 2). The system becomes bivariant in this portion of the curve.
  • 22. Cooling curve of binary alloy forming solid solution 21-02-2024 22 • With the progress of cooling at point Q the alloy now consists of both liquid & solid phases which remain up to point R; Thus portion QR represents a two phase region confirming that F = 2 -2 + 1 = 1 & meaning that either temperature or composition can be varied independently and so, the system becomes univariant. • This provides an important conclusion that an alloy does not solidify at a constant temperature like a pure metals, but does so over a range of temperature meaning that solidification may start at a particular temperature (say point Q for example) but it will be complete at some other lower temperature (say point R for example). • Such a solidification or freezing range of an alloy is due to changes in the composition of solid & liquid phases. • Again when the entire alloy has been solidified, say at point R, with a change in slop, the alloy now cools down to room temperature along the line RS, the point S being the end of the cooling process; i.e. room temperature itself. • During this portion RS, the phase rule again confirms that F = 2 - 1 + 1 = 2 and so the system becomes bivariant.
  • 23. Cooling curve of binary alloy with eutectic reaction 21-02-2024 23 WX, Eutectic temp. At W, Eutectic comp. • In this case, the two components (metals) forming the alloy are completely soluble in each other in their liquid state but are completely insoluble when solid. • Now, referring to figure (c) it can be observed that during the portion UV, the alloy is in liquid state up to point V. So, this is similar to that of earlier two cases considered (F = 1). • At point V, the metal which is in excess starts crystallization and the temperature is found to drop along the line VW indicating that there are two phases, namely, liquid solution of two metals (phase 1) & solid pure metal crystals (phase 2). • The change in slop of this line is because of change in composition of liquid phase.
  • 24. Cooling curve of binary alloy with eutectic reaction 21-02-2024 24 • Again Gibbs phase rule gives F = 2 - 2 + 1 - 1 indicating that system remains monovariant in this portion. • Next, at point w, the composition of liquid metal reaches to a value - called Eutectic composition- at which both the metals start to solidify simultaneously from the liquid solution. • Thus, now there are three phases: two pure metals (solid phase 1 & 2) and one liquid (phase 3). • So, when phase rule is applied, F = 2 - 3 + 1 = 0, meaning that system becomes nonvariant and therefore, temperature does not fall during the portion wx, forming a horizontal line, an isotherm (also called thermal arrest) on the cooling curve. This is called as Eutectic temperature. • The composition also does not change during this portion of solidification. Further cooling up to point X, solidification is complete at the constant temperature. • At point X, the entire mass of alloy gets solidified completely and so, it has now two phases as solid metal 1 and solid metal 2.
  • 25. Cooling curve of binary alloy with eutectic reaction 21-02-2024 25 • Applying the phase rule from point X downwards, F = 2 – 2 + 1 = 1 which indicates that system is now univariant and so, temperature decreases with time. • From the point X to point Y, the cooling occurs to room temperature by following a different slope as the composition does not change with time now. • Generally, a binary eutectic system may solidify in two different modes:  (i) as a combination of pure metals or  (ii) as a combination of solid solutions (eutectic with solubility)
  • 26. Construction of Phase diagram 21-02-2024 26 • For the construction of a phase diagram, thermal analysis method is normally used. • In this method (an experimental method) data from cooling curves of different alloy compositions are collected and used for construction of phase diagram. • While labeling a phase diagram Greek letters α, β, γ, δ., etc. are used to designate solid solutions. • This makes student capable of predicting the microstructure / s that may result from such cooling and hence, the resulting properties.
  • 27. Type I (Isomorphous system) 21-02-2024 27 Type I - TWO Metals Completely Soluble in the Liquid & Solid States (Isomorphous system): • As the two metals are completely soluble in the solid state, the solid phase to form is only of a substitutional solid solution type. The two metals will have the same type of crystal structure and differ in atomic radii by less than 8%. • The cooling curves obtained by running series of experiments for various combinations or alloys between metals A and B, varying in composition from 100% A & 0% B to 0% A & 100% are shown in the figure (a). • Each cooling curve is a separate experiment starting from zero time. Here they have been drawn on a single coordinate system (temperature v / s. Time) for understanding the relationships among them. • The cooling curves for the pure metals A and B show only a horizontal line as the solidification begins & ends at a constant temperature. For intermediate compositions, these cooling curves show two breaks or changes in slope because they form solid solutions.
  • 28. Type I (Isomorphous system) 21-02-2024 28 Type I - TWO Metals Completely Soluble in the Liquid & Solid States (Isomorphous system): • For an alloy having 80A and 20B, the first break occurs at temperature T1, indicating the beginning of solidification, and the second break at T2, indicating the end of solidification. • All intermediate alloys show similar type of cooling curves with two different breaks.
  • 29. Type I (Isomorphous system) 21-02-2024 29 • Now a dotted curve joining all upper points showing beginning of solidification and another dotted curve joining all lower points showing end of solidification can be drawn to get the sense or some idea of ​​the form of this phase diagram. • Next, an actual phase diagram can be constructed by plotting temperature v/s composition on a separate XY - plane. The required points are taken from the series of cooling curves and plotted on this new XY - plane.
  • 30. Type I (Isomorphous system) 21-02-2024 30 This is done as follows: • Referring to figure (b), as the left - most axis represents the pure metal A, the melting point TA, is plotted along this axis. Similarly, melting point TB, for pure metal B is plotted on the right side axis. • Next, a vertical line showing the alloy 80A – 20B is drawn, and T1 and T2 form figure (a) are plotted along this vertical line. Similarly, all other compositions are transferred to the new diagram's X - axis and corresponding temperatures plotted on the Y - axis by following the same procedure. • Thus the required phase diagram is constructed when all points are joined by a following a sequence for odd and even numbered points as shown in fig. (b).
  • 31. Type I (Isomorphous system) 21-02-2024 31 • This phase diagram (figure b) consists of two points, two lines and three areas. • The two points TA and TB represent the freezing points of two pure metals. • The upper line is called liquidus line which is obtained by joining the points showing the beginning of solidification and the lower line is called solidus line which is obtained by joining the points showing the end of solidification. • The area above liquidus line is a single phase region & any alloy in this region consists of a homogeneous liquid solution. • Similarly, the area below the solidus line is single phase region and any alloy in this region consists of a homogeneous solid solution (α - alpha in the figure).
  • 32. Type I (Isomorphous system) 21-02-2024 32 • Between liquidus and solidus lines a two - phase region exists which contains those phases which appear the extreme boundaries the diagram; i.e. liquid solution & solid solution. • From the diagram drawn here information regarding the two phase region is not provided by it. • It does not give information in terms of chemical composition and relative amounts of two phases in this two phase region.
  • 33. Rule-I: Chemical composition of Phases 21-02-2024 33 • The actual chemical composition in a two - phase region in equilibrium at a given temperature can be found out as follows:  Draw a horizontal line (called "Tie Line ') up to the boundaries of the phase region. The line intersects the boundaries at points, say L on liquidus line and S on solidus line respectively.  Drop vertical lines from these points of intersection on to the X - axis, the composition axis.  Read the value of compositions at two different points obtained like this on X axis, the value from point L represents composition of liquid and that from S point composition of solid formed, at given temperature for alloy considered.
  • 34. Rule-I: Chemical composition of Phases 21-02-2024 34 • Consider an alloy of composition 60A - 40B at the temperature T in a two phase region as shown in figure (c). • The Rule - I is applied to it by drawing tie line SL which intersects boundaries of the field, at point L on liquidus line & point S on solidus line. • By dropping verticals from these two points on X - axis, they give composition of liquid as 52A - 46B and that of solid solution as 70A - 30B.
  • 35. Rule-II: Relative amount of phases (Lever rule) 21-02-2024 35 • In a two - phase region of any phase diagram, one can determine relative amounts of the phases present in it by applying rule-II, Also called Lever rule. • To determine the relative amount of the two phases in equilibrium at any given temperature in two phase region, draw a vertical line from a point representing the overall composition of the alloy under consideration. • Also, draw a horizontal tie line up to the boundaries of the field (as in Rule-I). The vertical line will divide the horizontal line into two parts.
  • 36. Rule-II: Relative amount of phases (Lever rule) 21-02-2024 36 • The lengths of these parts are inversely proportional to the amount of the phases present. The intersection of horizontal & vertical lines may be considered fulcrum of a lever system for which the lever is tie line up to the boundaries of the field. • The relative lengths of the lever arms multiplied by the amounts of the phases must show a balance. • In figure (C) the vertical line, showing the alloy of composition 60A – 40B, divides the horizontal tie line in to two parts, LO and SO, the fulcrum being O on the diagram.
  • 37. Rule-II: Relative amount of phases (Lever rule) 21-02-2024 37 • When the lever length LS is taken to represent 100 percent, or total weight of the two phases present at temperature T, the lever rule may be given as under: • Relative amount of liquid = SO / SL x 100 % • Relative amount of solid solution (α) = LO / SL x 100 % • For given example of alloy composition 80A-20B • Liquid (percent) = 10/16 x 100 = 62.5% • Solid solution a (percent) = 6/16 x 100 = 37.5%
  • 38. Example based on Type-I material 21-02-2024 38 Ex.1 Platinum (Pt) and Gold (Au) are completely soluble in both the liquid & solid states. The melting point of platinum is 1775 °C and that of gold is 1062 °C . An alloy containing 40% gold starts to solidify at 1585 °C by separating crystals of 15% gold. An alloy containing 70% gold starts to solidify at 1385 °C by separating crystals of 37% gold, and an alloy containing 90% gold starts to solidify at 1190 °C by separating crystals of 64% gold. (a) Draw the equilibrium diagram of Gold - Platinum binary system and label all transformation points, lines and phase fields. (b) For an alloy containing 50% gold, determine the relative amounts of solid and liquid phases in equilibrium at 1385 oC. (c) Draw the cooling curve for the alloy stated in (b) above.
  • 39. Example - I (Type I material) 21-02-2024 39
  • 40. Example - I (Type I material) 21-02-2024 40
  • 42. Example - I (Type I material) 21-02-2024 42
  • 43. Example - I (Type I material) 21-02-2024 43
  • 44. Example - I (Type I material) 21-02-2024 44
  • 45. Type –II materials 21-02-2024 45 Type - II - TWO Metals Completely Soluble in the Liquid state & completely Insoluble in the Solid States: • Practically, no two metals are completely insoluble in each other. In some cases the solubility is so small that for all practical purposes those metals may be consider insoluble. • For type-II binary equilibrium diagram to understand, Raoult’s law must be referred to.
  • 46. Type –II materials 21-02-2024 46  Raoult’s Law: It states that the freezing point of a pure substance will be lowered by the addition of a second substance provided the later is soluble in the pure substance when liquid and insoluble when solidified.  This phase diagram can be constructed from a series of cooling curves as shown in fig. (a) including cooling curve of pure metals forming the series of an alloys.
  • 48. Type-II material (Example) 21-02-2024 48 Ex.2 Bismuth (Bi) and cadmium (Cd), with melting points of 270'C and 320 ° C respectively, are completely soluble in the liquid state but practically insoluble in the solid state. They form a eutectic of composition 40% Bi at 145 ° C temperature. Your Task: (a)Construct a phase diagram & label all points, lines and phase regions. (b)b) For an alloy containing 80% Bi, sketch the corresponding cooling curve taking necessary points from the phase diagram. (c)Calculate the amount of proeutectic & eutectic constituents obtained upon slow cooling to room temperature for this alloy.
  • 51. Type-II material (Example) 21-02-2024 51 • By referring to the figure above relative amounts of proeutectic & eutectic for the given alloy (80% Bi) at room temperature can be calculated as under: • In the phase diagram draw lever 'xy' (horizontally) at room temperature and a vertical line indicating 80% Bi alloy. • Intersection point of these two lines is fulcrum 'o'. So, • % of proeutectic Bi = xo / xy x 100 = 80-40 / 100-40 x 100 = 66.7% • % of eutectic (Bi + Cd) = oy / xy x 100 = 100-80 / 100-40 x 100 = = 33.3%
  • 52. Type-III materials 21-02-2024 52 Type - III - Two Metals Completely Soluble in the Liquid state but only partly soluble in the Solid State: • This type of phase diagram is most common as most of the metals show some solubility for each other in their solid state, and so, it is important from study view point. • For two metals A and B, the melting points are indicated by TA and TB respectively. The continuous line TAETB is liquidus line and another line TAFEGTB forms solidus line. • Many binary systems have components which have limited solid solubility, e.g.: Cu-Ag, Pb-Sn. The regions of limited solid solubility at each end of a phase diagram are called terminal solid solutions as they appear at ends of the diagram.
  • 53. Type-III materials 21-02-2024 53 • Here, as the two metals are partly soluble in the solid state, the solid solutions form. • Also, alloys in this system always solidify as a solid solution or mixture of solid solutions. They never solidify crystals of pure A or pure B. • The three two-phase areas may now be labeled as liquid + α, liquid + β and α + β. At temperature TE the α solid solution dissolves a maximum of 20% of B indicated by point F.
  • 54. Type-III materials 21-02-2024 54 • With decreasing temperature, the maximum amount of solute (B) that can be dissolved decreases as shown by line FH, called solvus line. This line indicates maximum solubility of B in A (α solution) as a function of temperature. • Similarly, at TE, the β solution dissolves maximum of 10% of A indicated by point G and similar decrease in solubility is shown by another solvus line GJ for β solution. • Point E, where the liquidus lines meet at a minimum, is known as eutectic point.
  • 55. Important reactions on Phase diagrams 21-02-2024 55
  • 56. Important reactions on Phase diagrams 21-02-2024 56
  • 57. Type-III materials (Example) 21-02-2024 57 Ex.3 Following is the data for a hypothetical binary system of components A and B: Melting point of A = 700 oC Melting point of B = 920 oC Eutectic temperature = 400 °C Eutectic composition = 40% A-60% B Solubility of B in A at 400 °C = 14% Solubility of A in B at 400 °C = 9% Solubility of Bin A at room temperature = 1% Solubility of A in B at room temperature = 0.1% Your Task: (a) Construct the phase equilibrium diagram consistent with above data, and label all points, lines and phase regions, (b) Draw the cooling curve for the eutectic alloy c) Calculate the amount of proeutectic & eutectic constituents that exist just below the eutectic temperature for 60% A-40% B alloy.
  • 60. Type-III material (Example) 21-02-2024 60  Cooling curve for 40% A - 60% B eutectic alloy is also shown in the figure (b).  By referring to the figure above, relative amounts of proeutectic & eutectic for the 60% A - 40% B alloy just below the eutectic temperature of 400 oC can be calculated as under:  Assuming that eutectic line FE coincides with just - below - temperature - line F1E1 :  then in the figure above, line "F1 E1 'represent the lever and' O1 'the fulcrum.  Then,  % of proeutectic (α) = E1O1/ F1 E1 x 100 = = ( 60 - 40) /(60 - 14) *100 = 43.48%  % of eutectic (α+β) = F1 01 / F1 E1 x 100 = (40 - 147 (60 - 14) *100