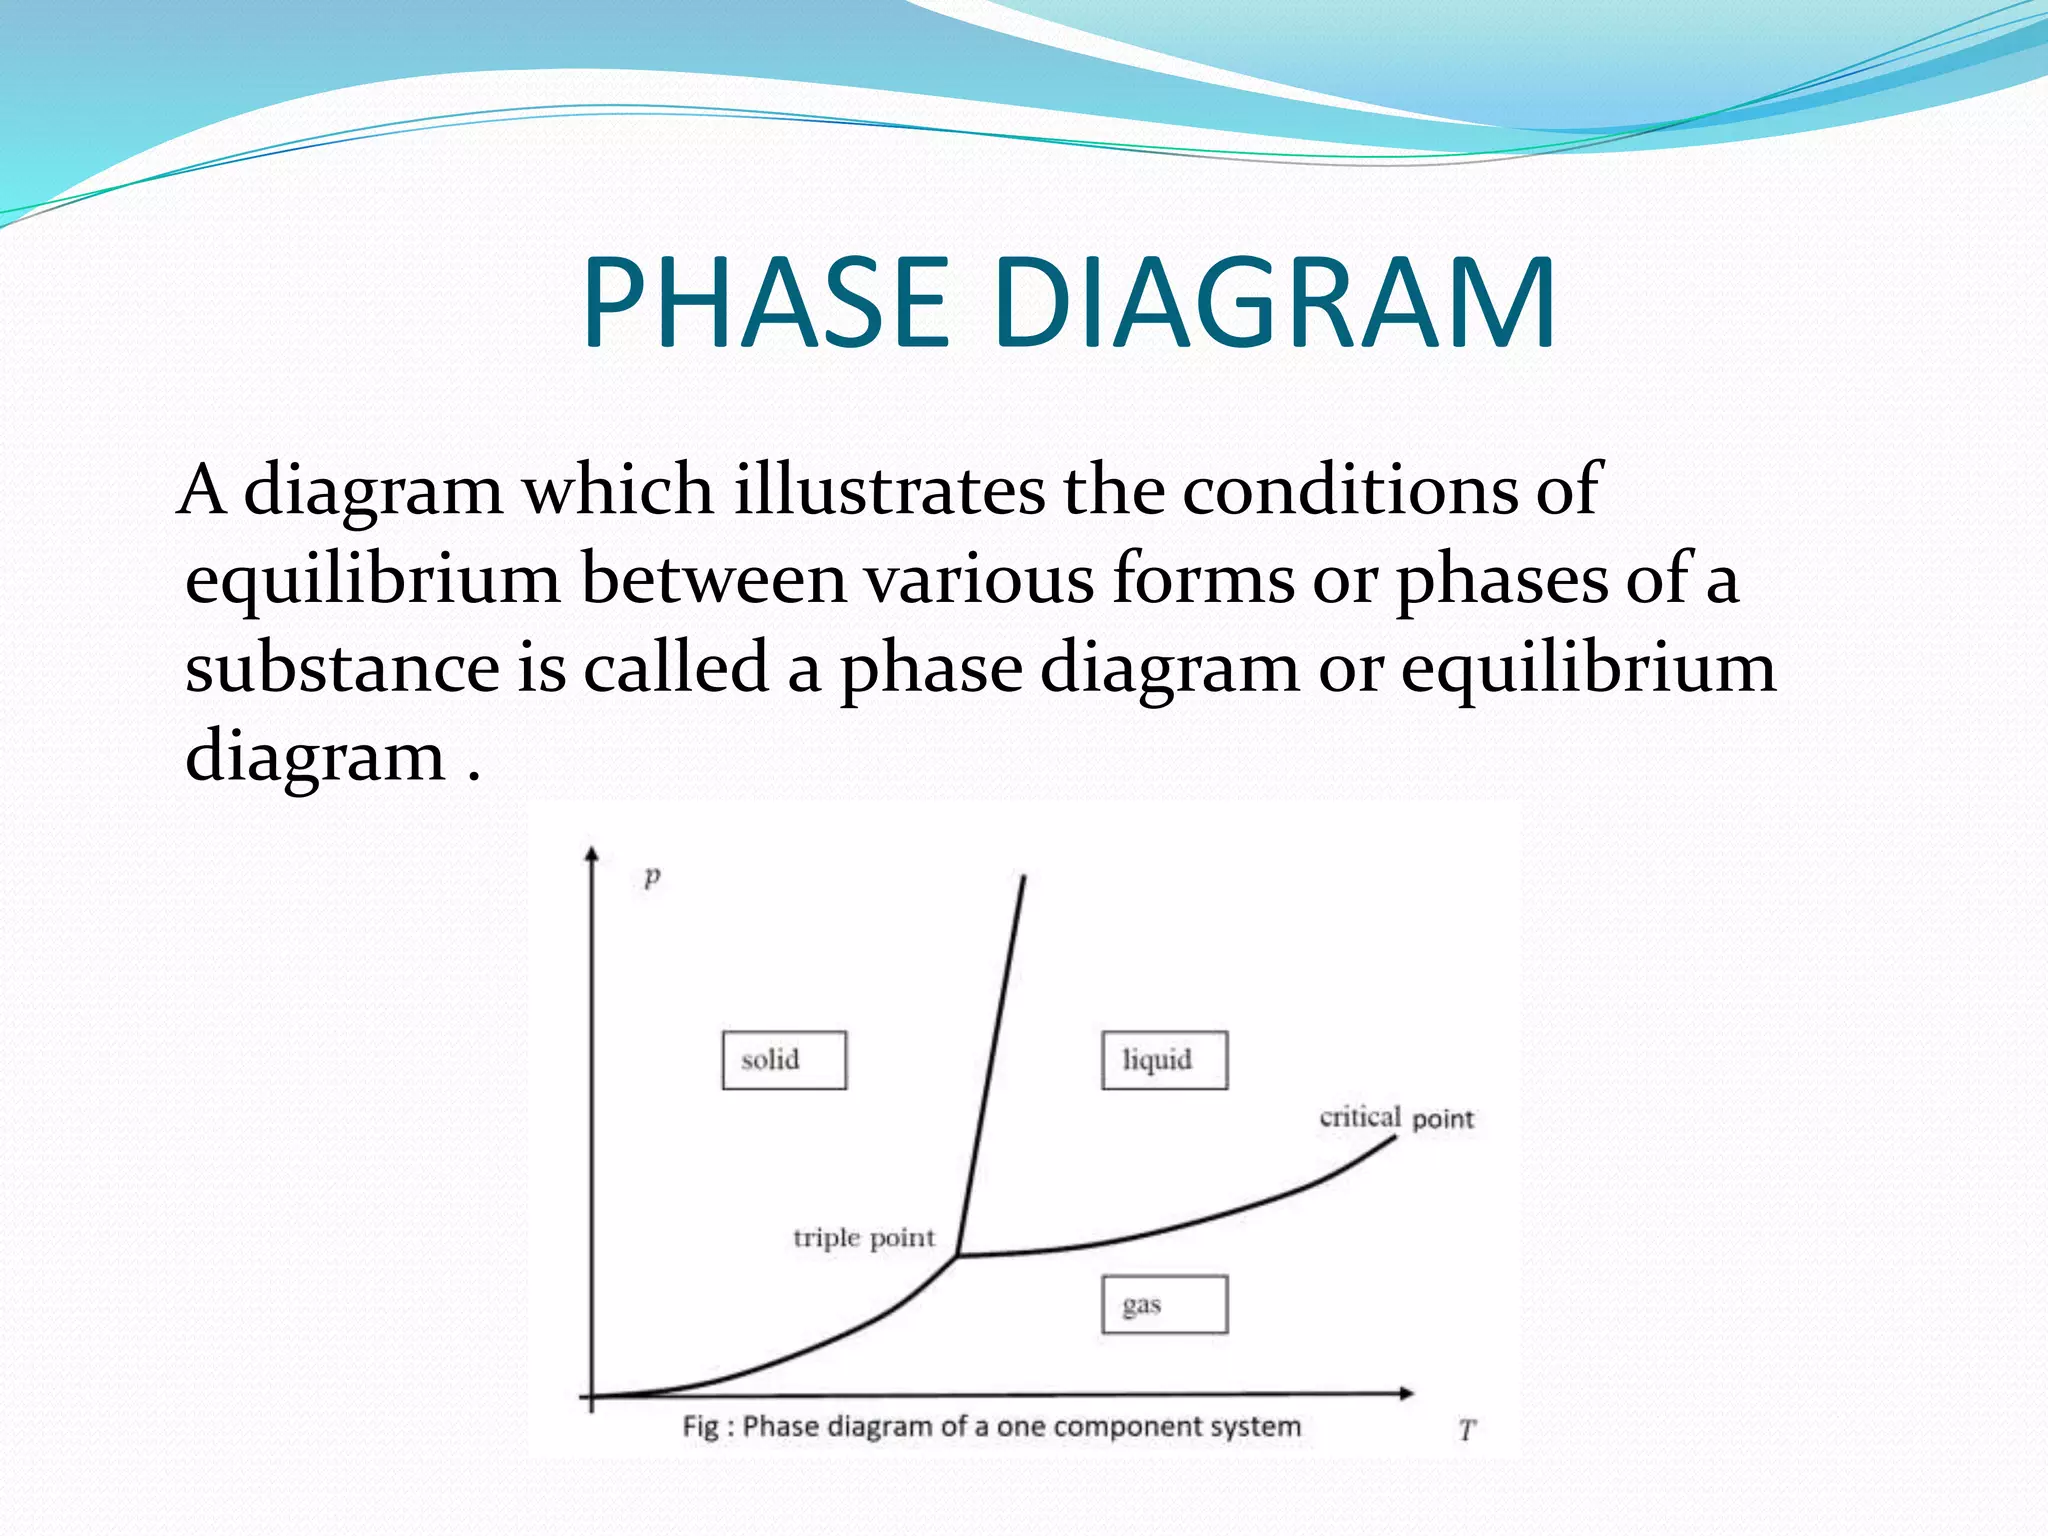
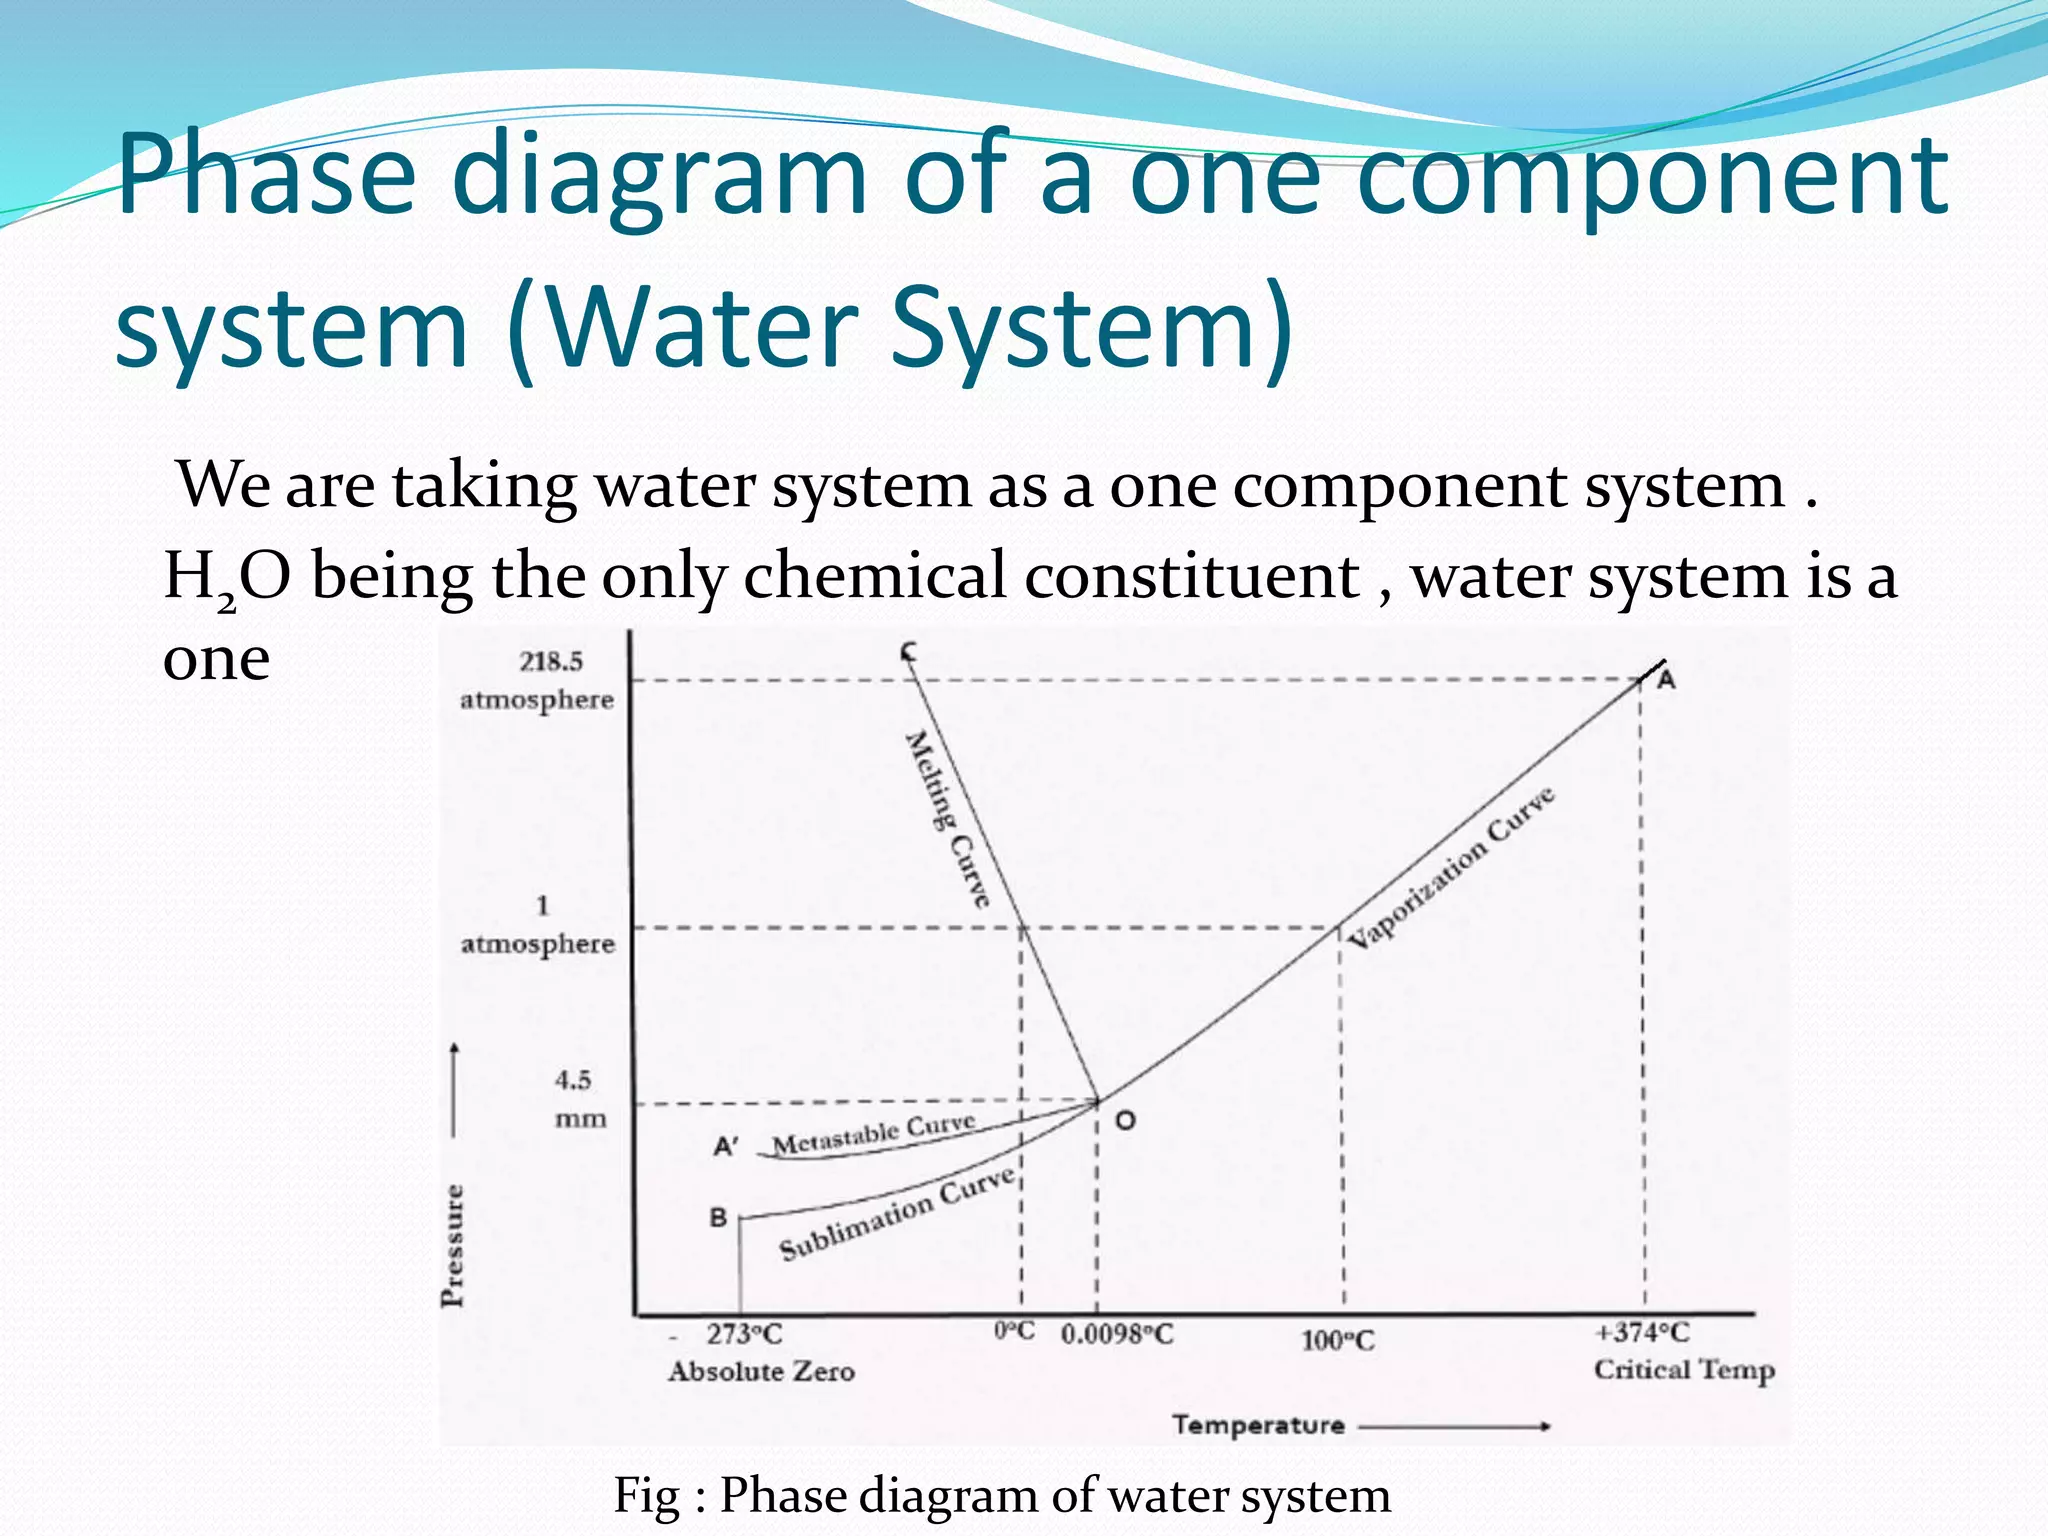
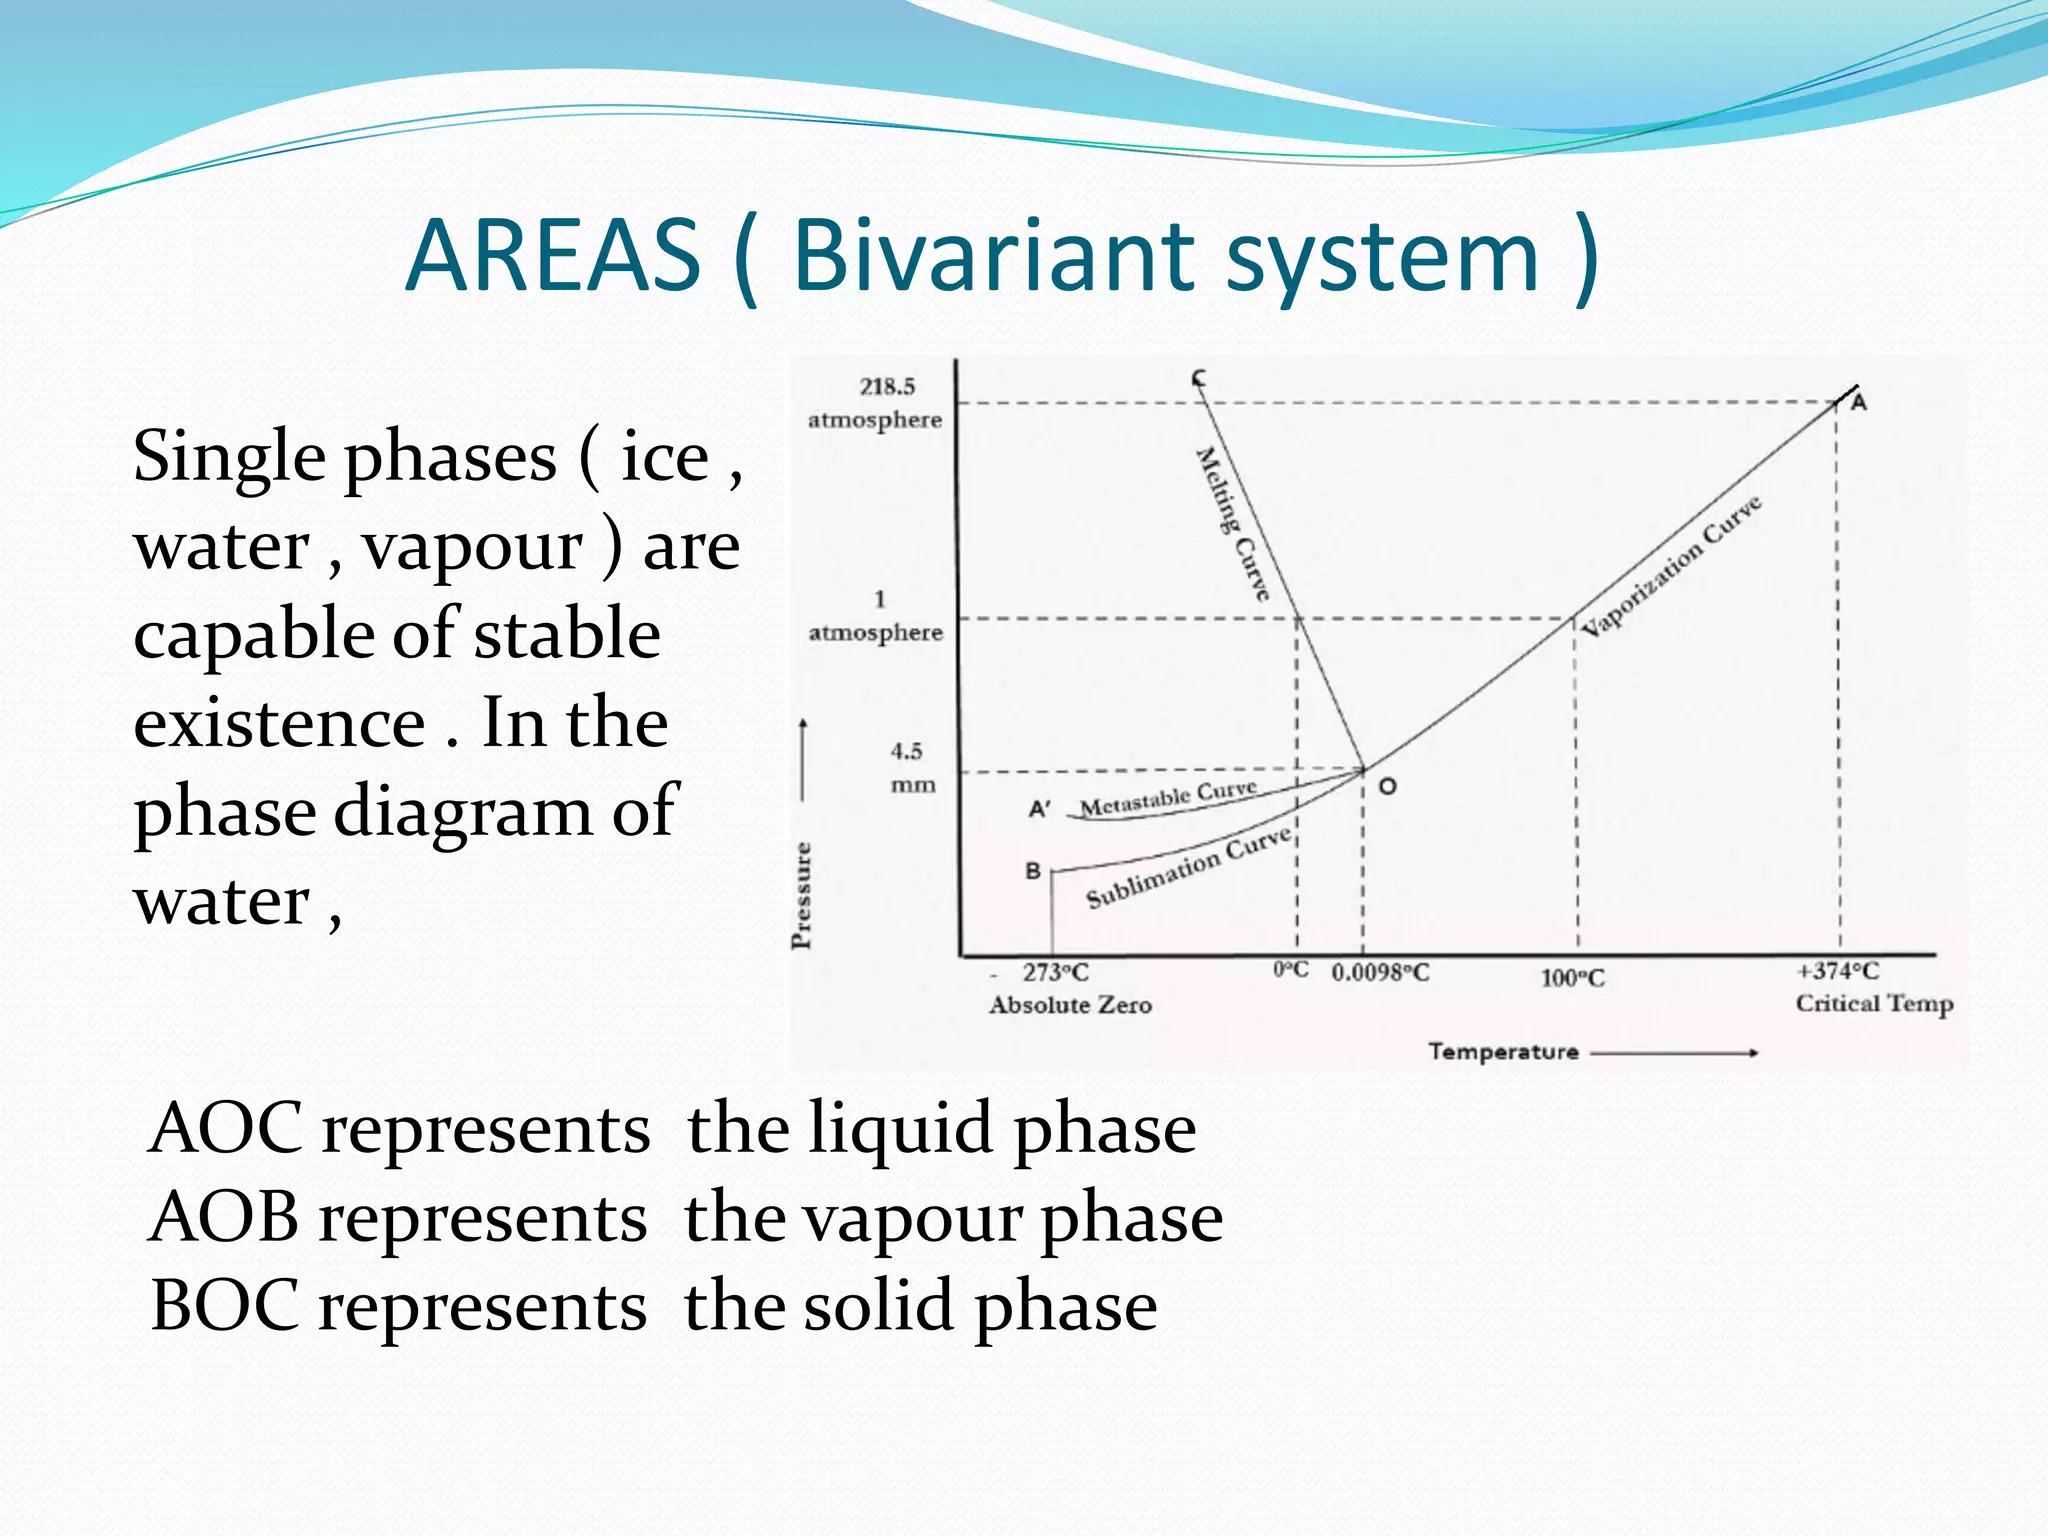
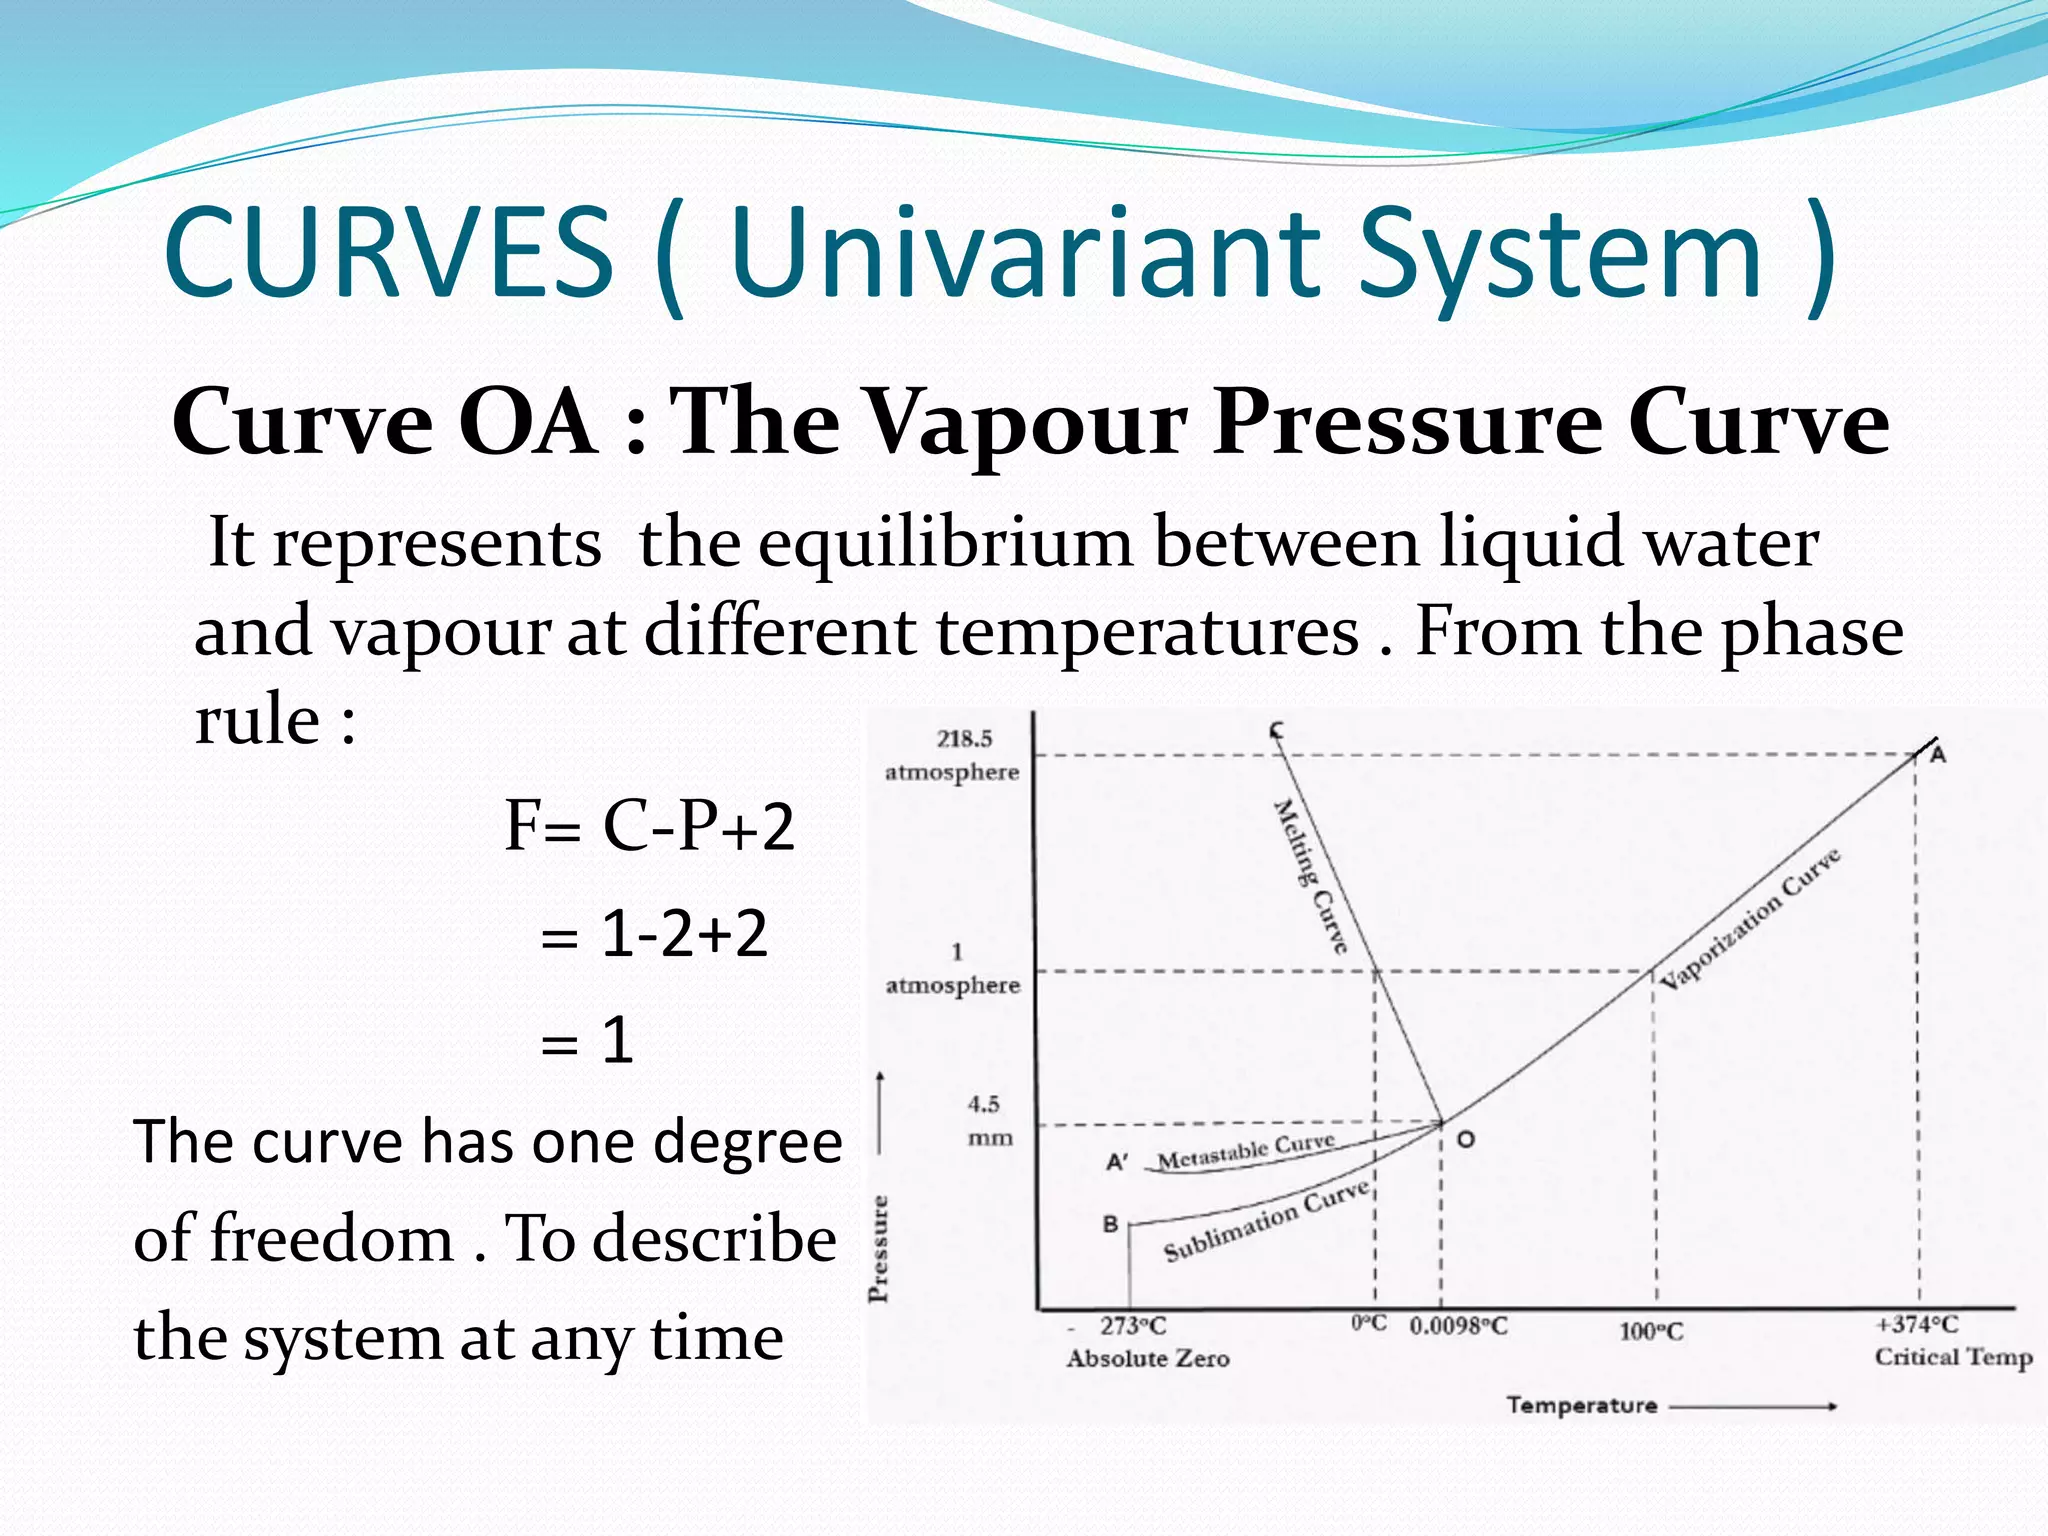
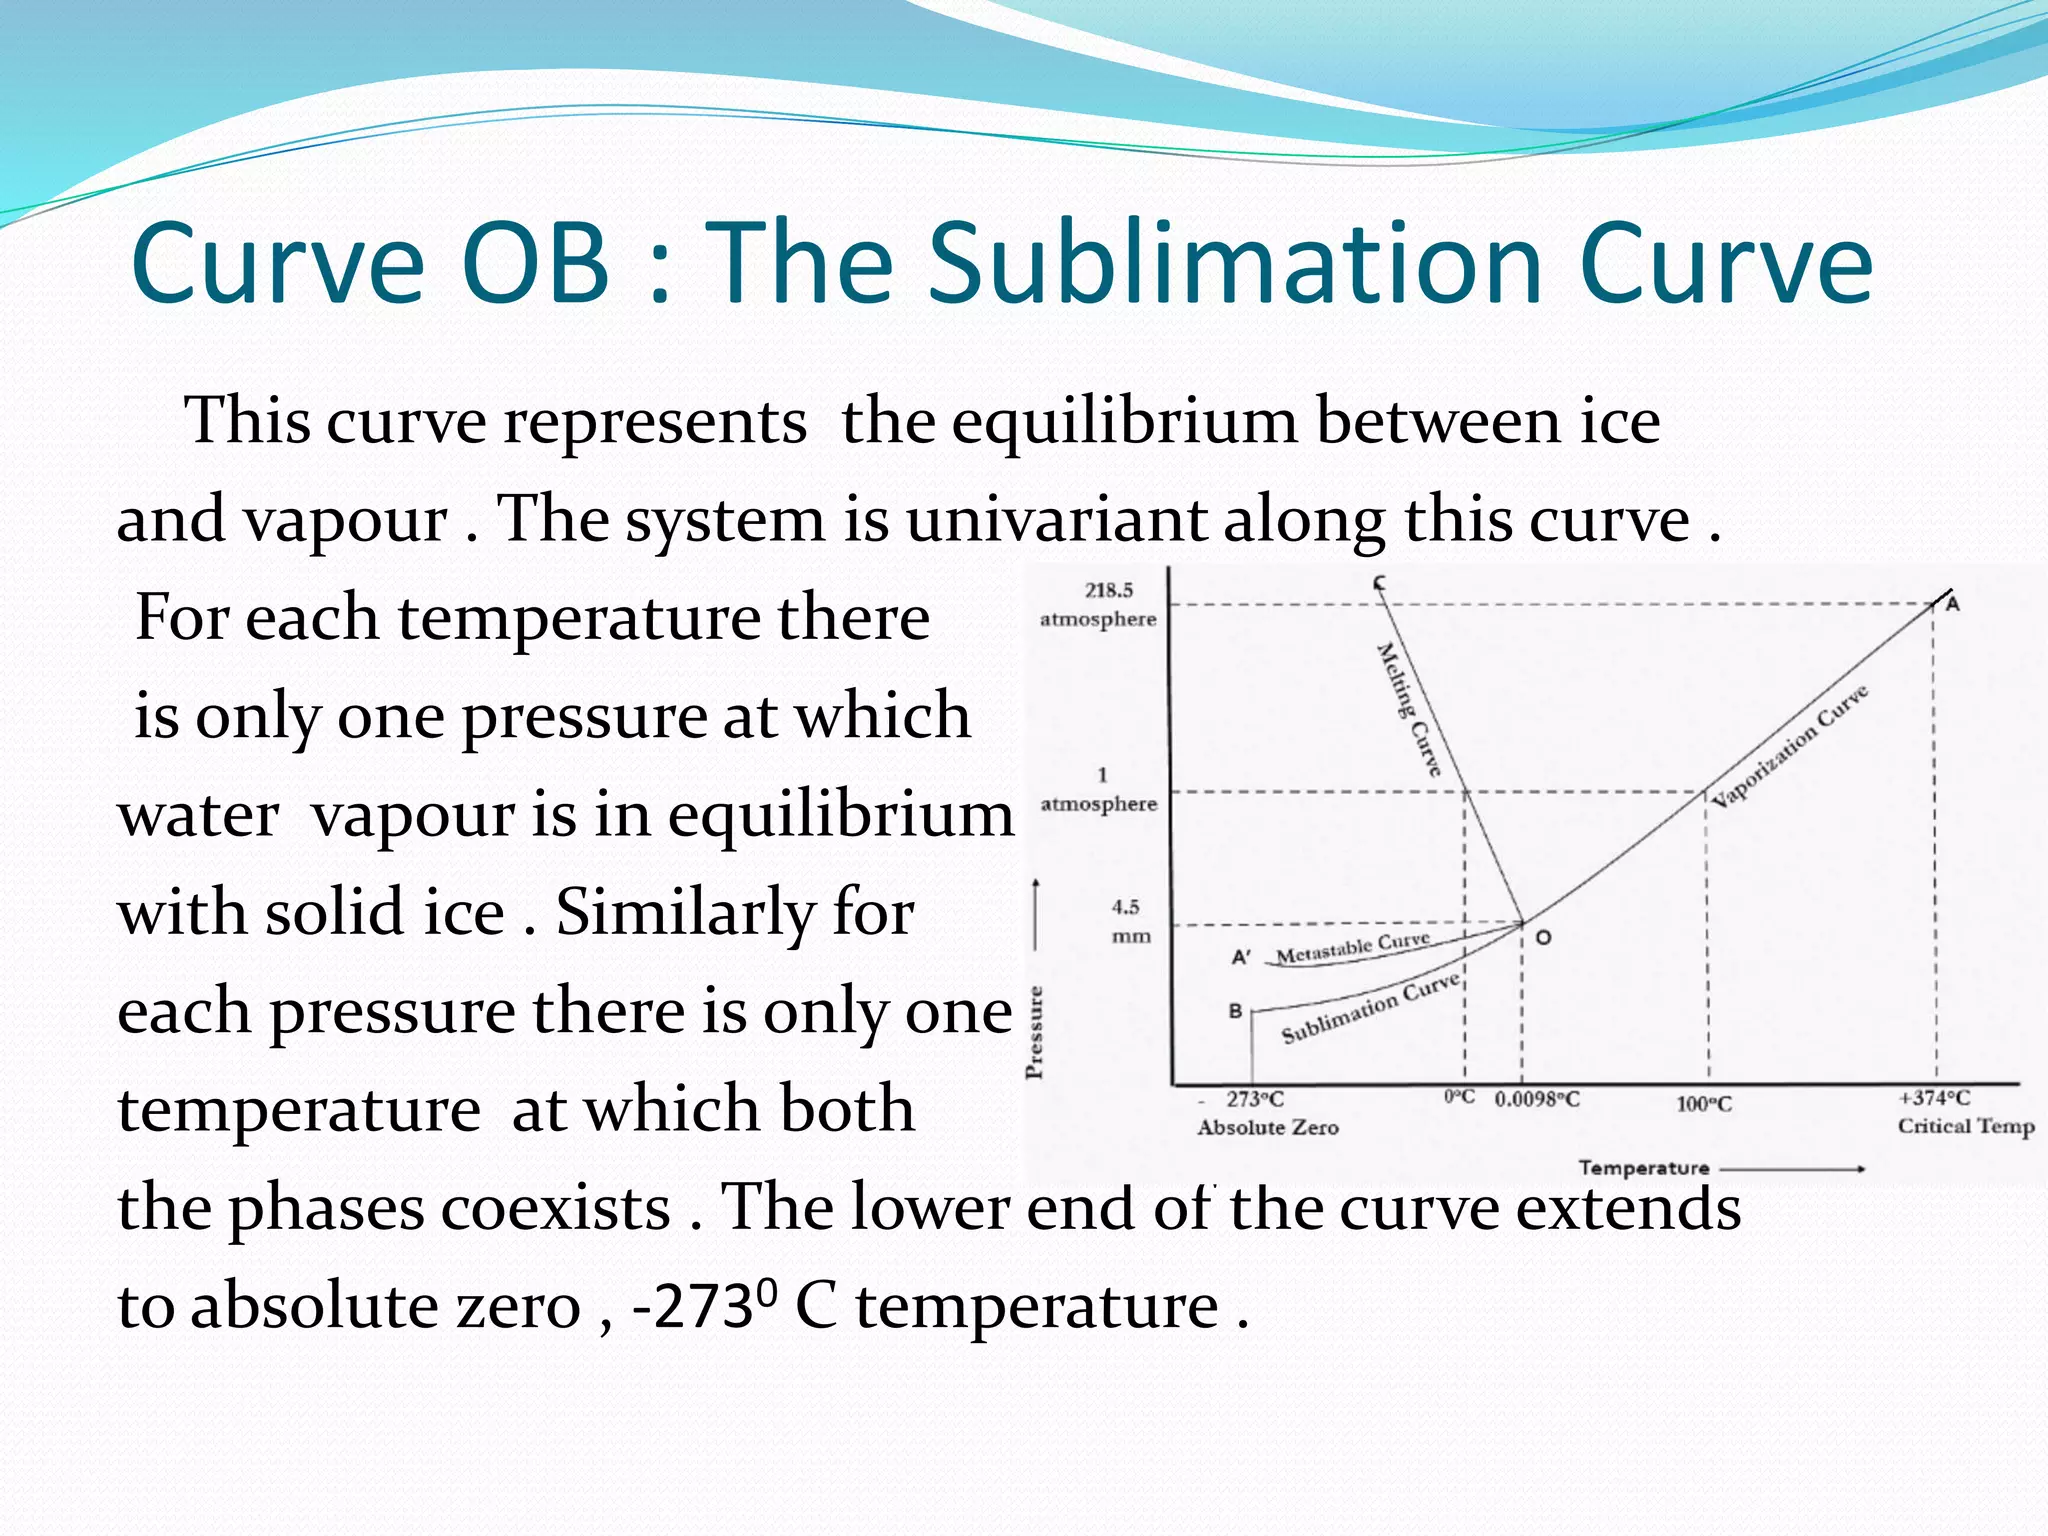
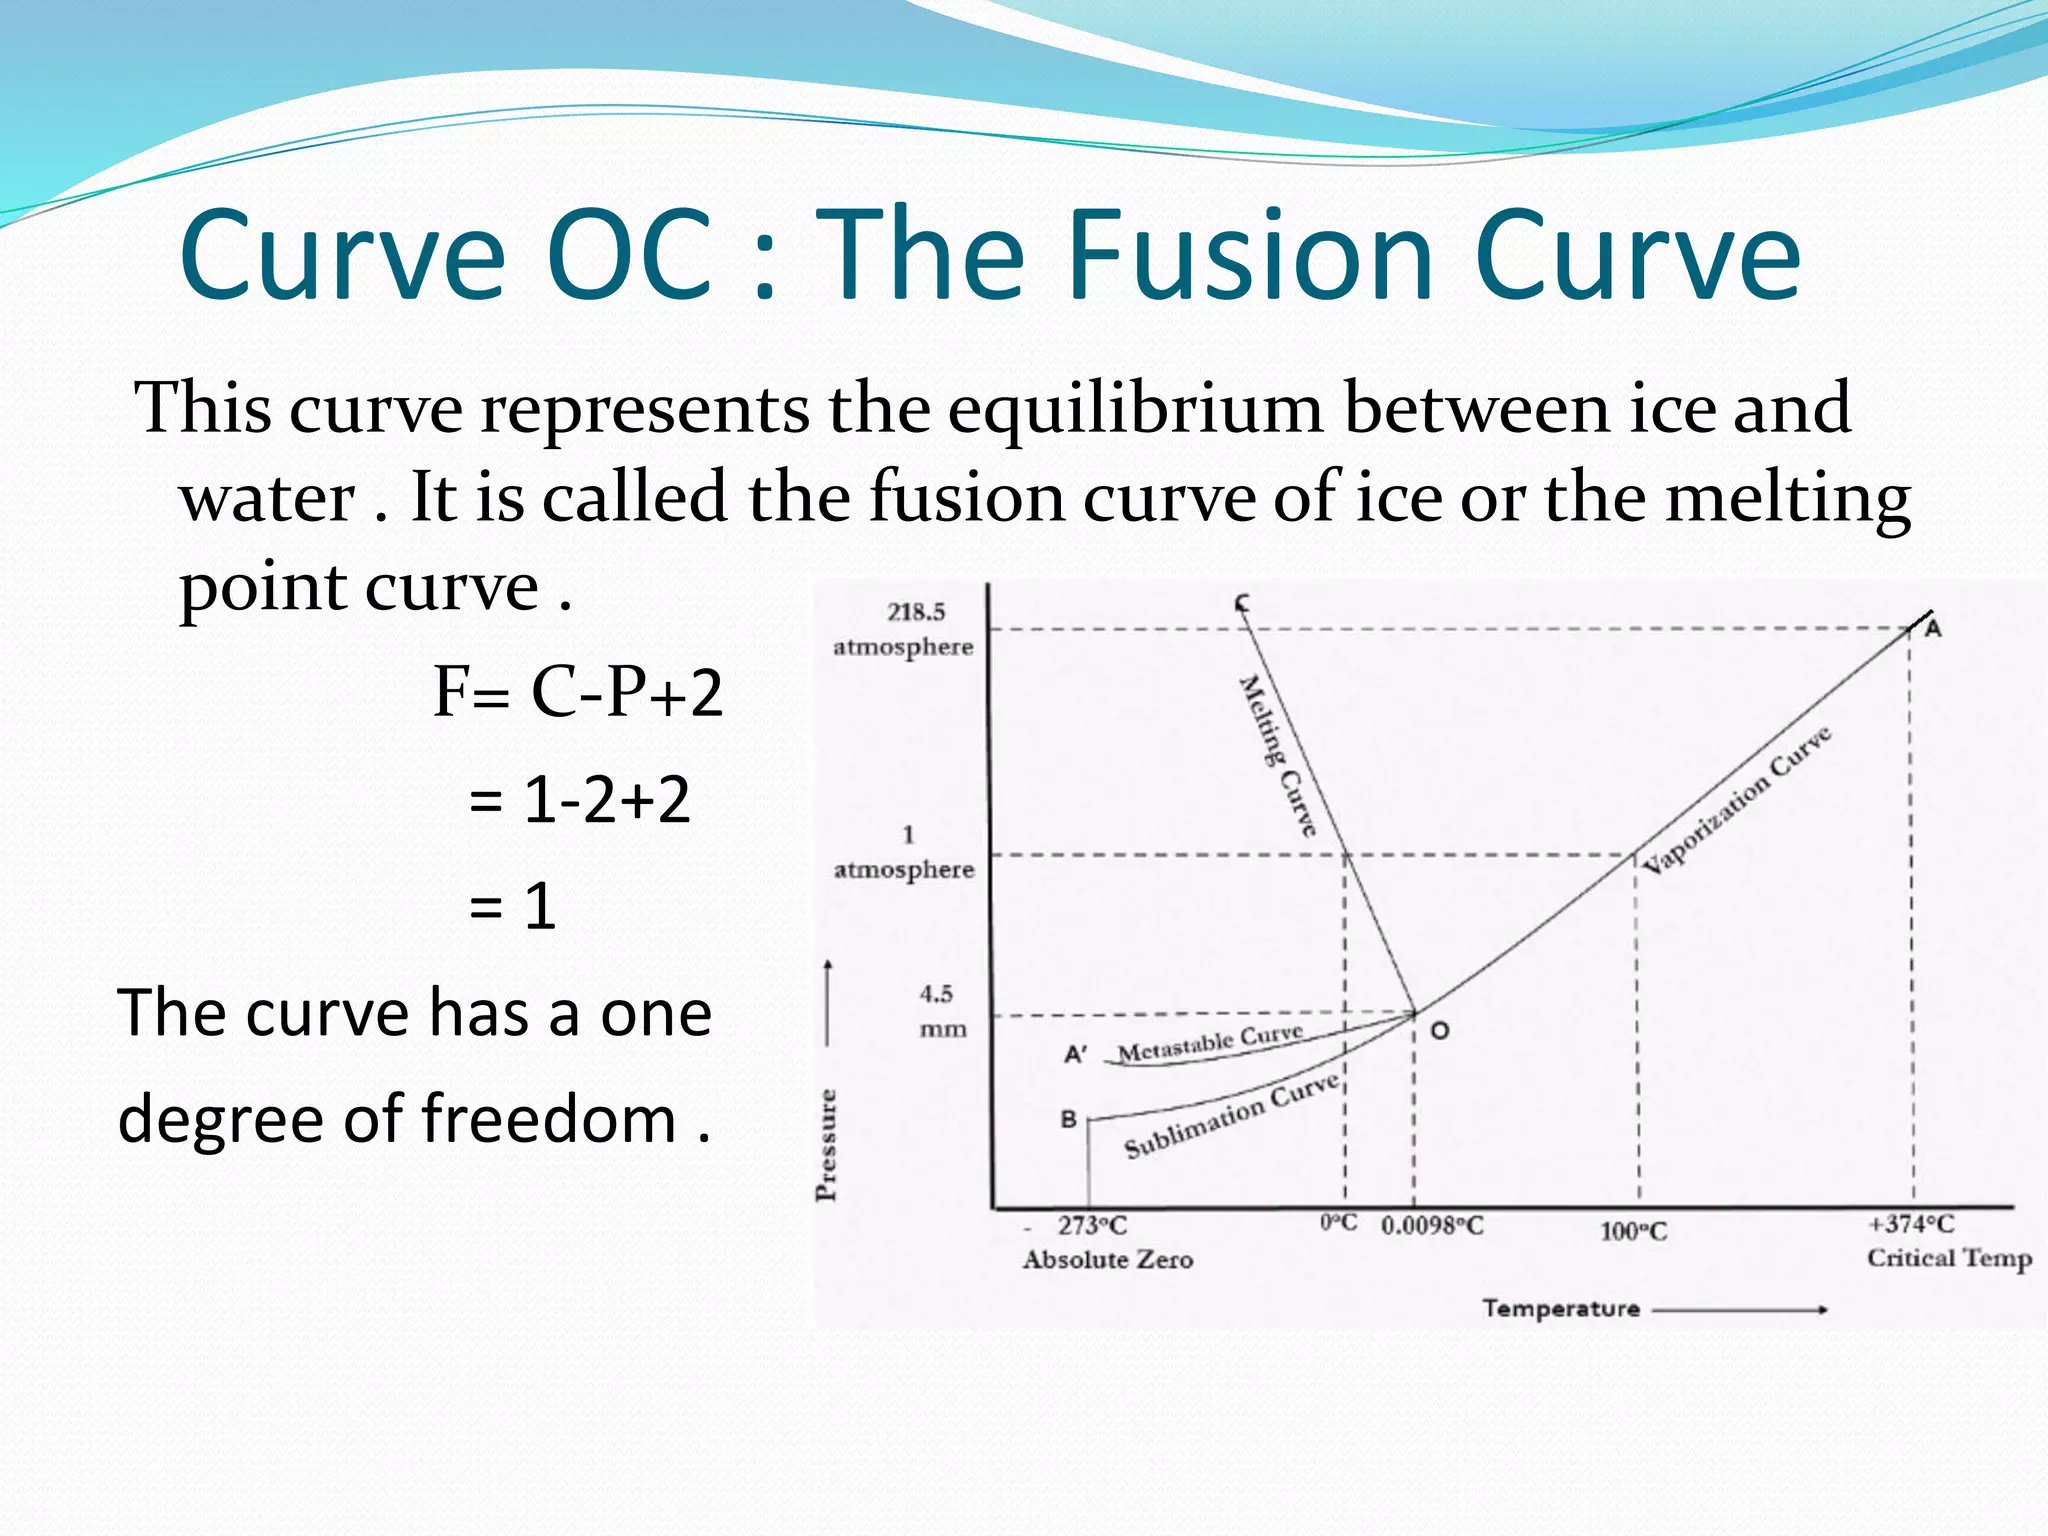
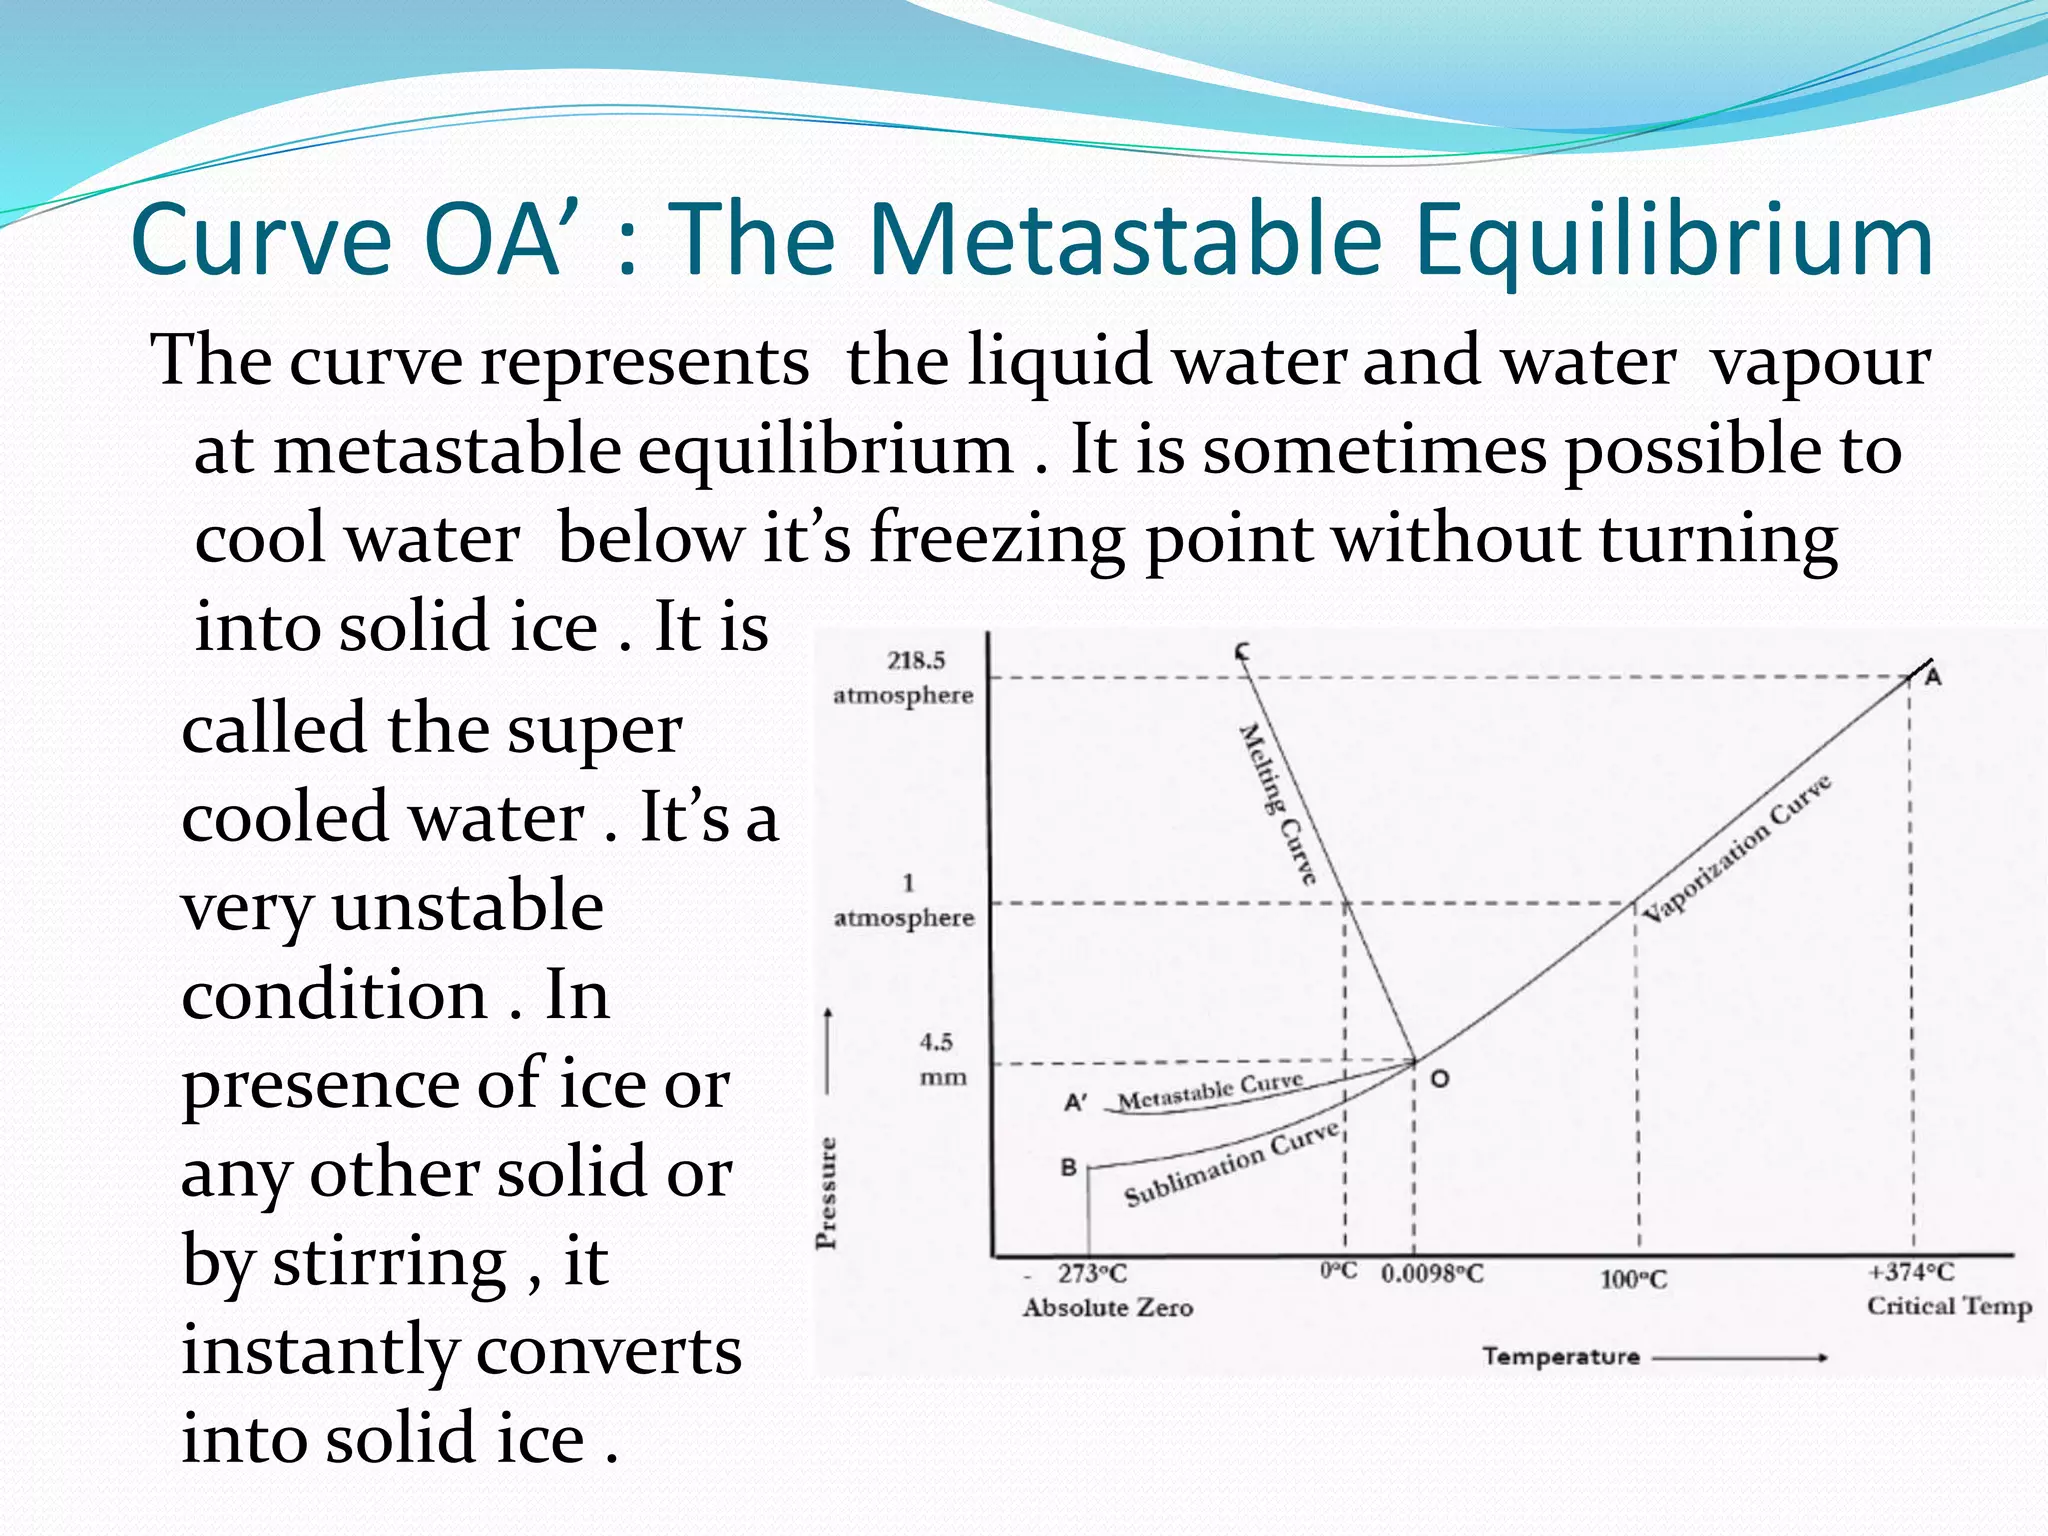
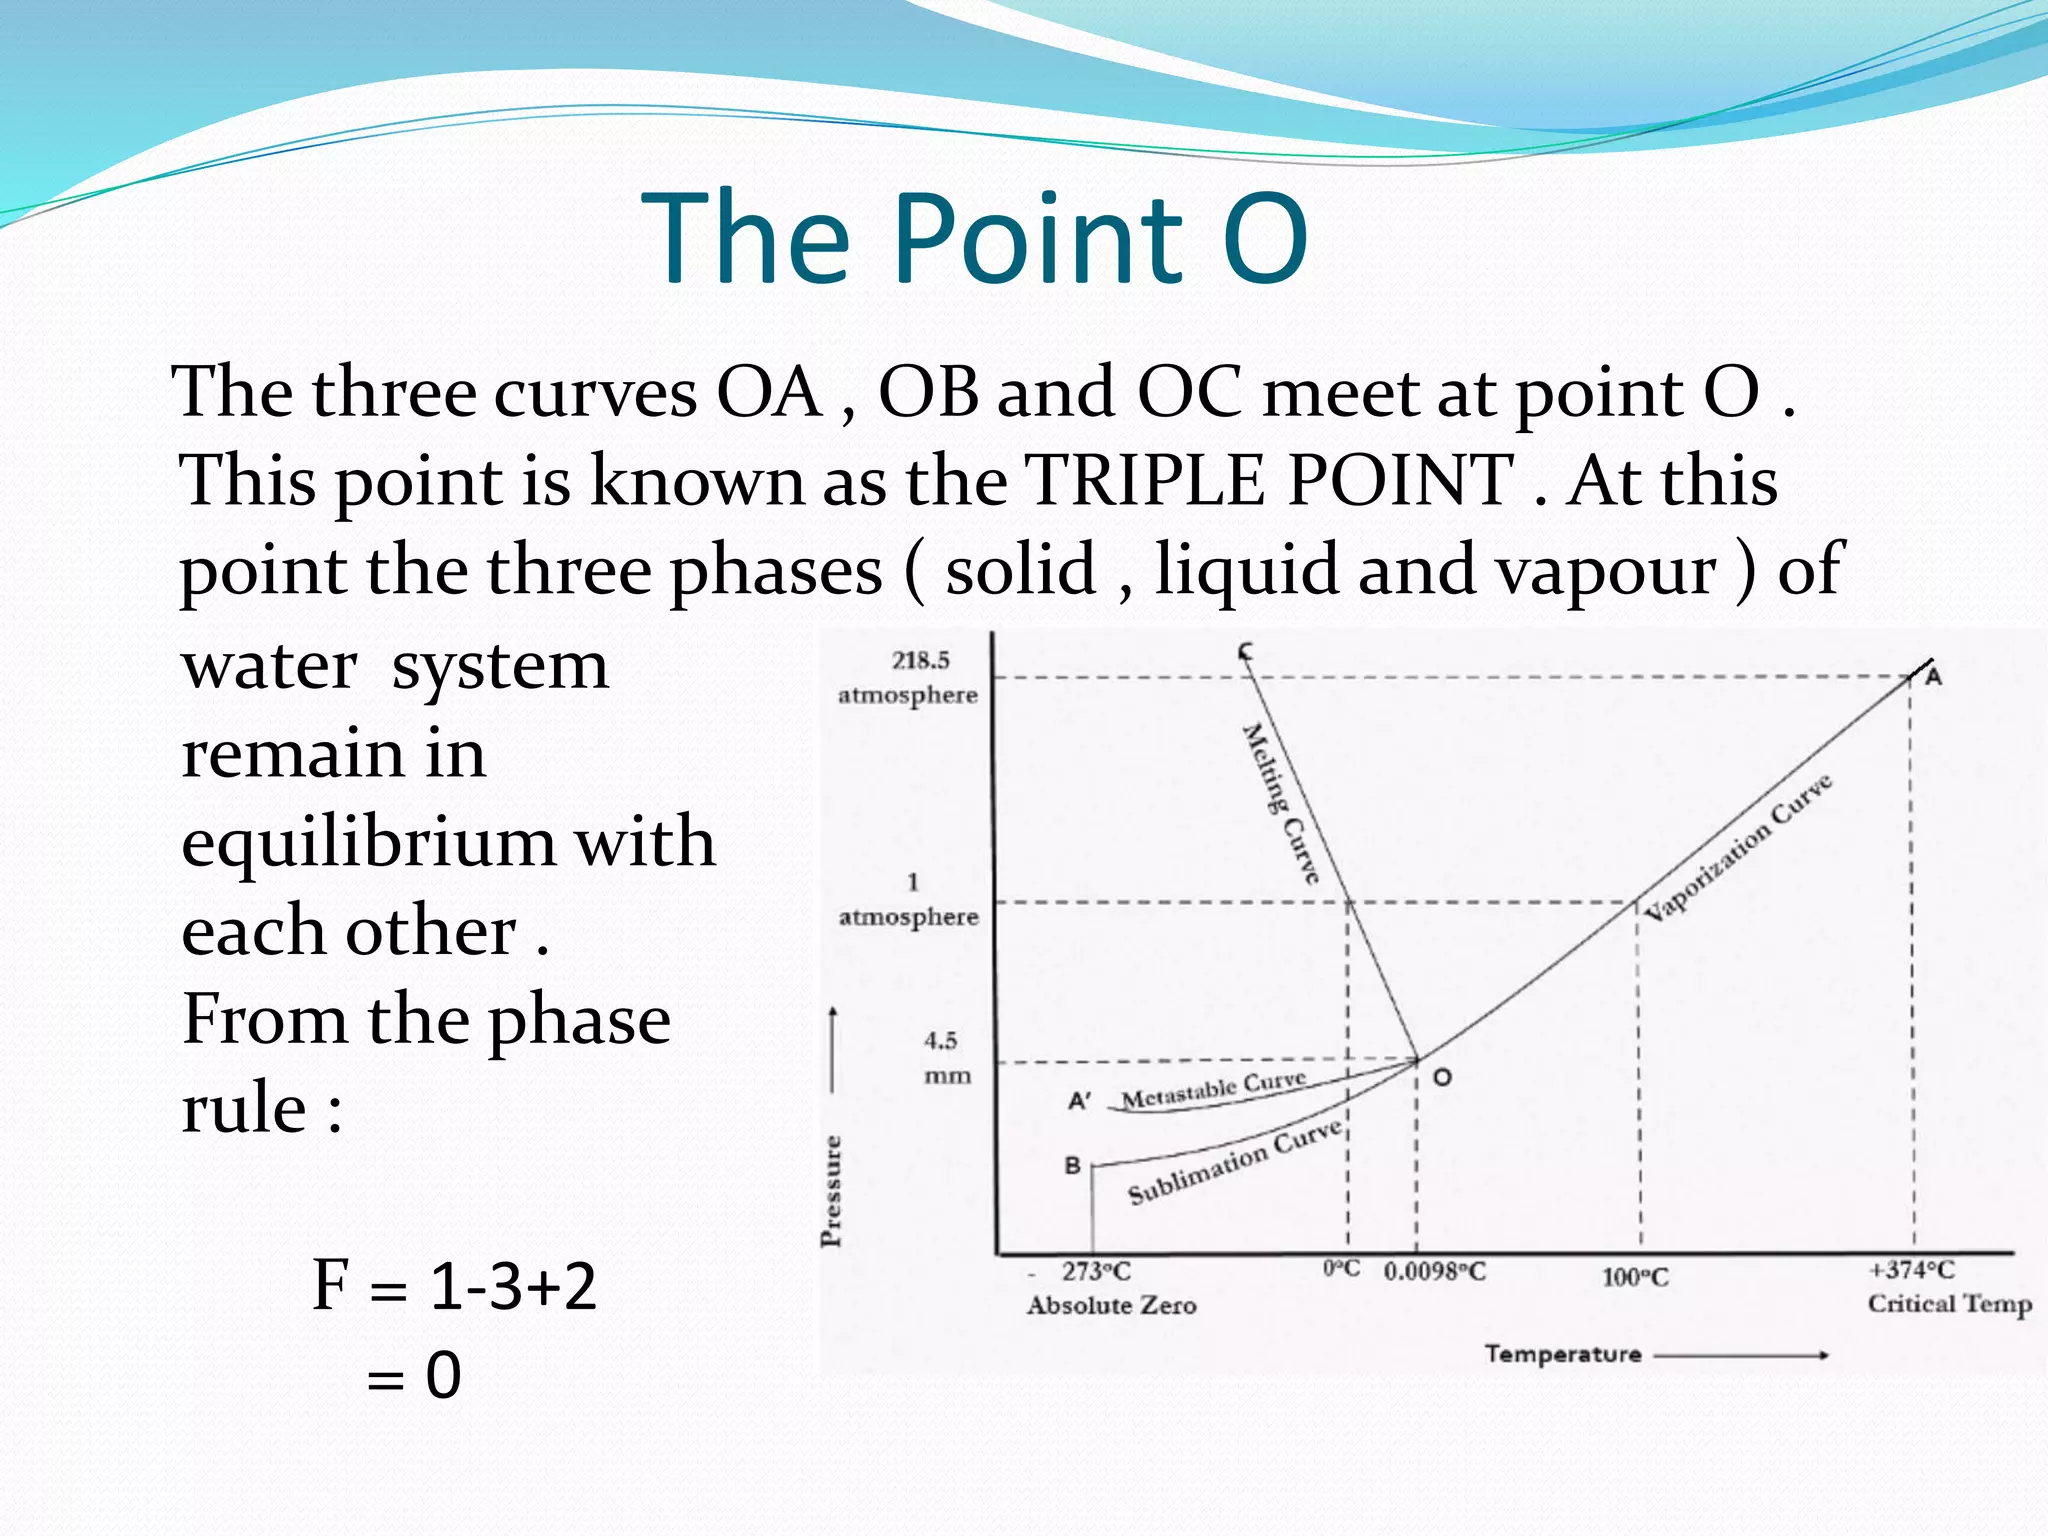
Presented by
Md.Shahriar Kabir Tipu
FH-056
Department of Chemistry
University of Dhaka
Topics will be discussed :
 Phase
 Component
 Phase diagram
 Degree of Freedom
 Phase rule
 Phase diagram of a one component system
PHASE
A phase is defined as a homogeneous , physically distinct
and mechanically separable portion of a system which is
separated from other such parts of the system by definite
boundary surface . Some examples of some phases are
solid , liquid and vapor phase of a substance.
PHASE DIAGRAM
A diagram which illustrates the conditions of
equilibrium between various forms or phases of a
substance is called a phase diagram or equilibrium
diagram .
COMPONENTS
The components are defined as the least number of
chemical constituents by means of which the
composition of each phase can be expressed in the
form of an equation .
The water system for example , consists of one
component ; the composition of each of the three
phases ( solid , liquid , vapor ) can be expressed in terms
of the component H2O .
In the decomposition of Calcium Carbonate
CaCO3(s) = CaO (s) + CO2 (g)
Here we have three phases , solid CaCO 3 , solid CaO and CO2
gas . The three constituents present in the system are CaCO3 ,
CaO and CO2 . We can use any two constituents as component
to express all the phases present in the system . If we take CaO
and CO2 as component then
Phase Components
CaCO3 (s) = CaO (s) + CO2 (g)
CaO (s) = CaO (s) + 0 CO2 (g)
CO2 (g) = 0 CaO (s) + CO2 (g)
So decomposition of calcium carbonate is a two component
system .
Degree of Freedom
It is defined as the least number of variable factors of a
system such as temperature , pressure and
concentration which must be specified so that the
remaining variables are fixed automatically and the
system is completely defined .
System possessing one , two , three etc degrees
of freedom are said to be univariant , bivariant ,
trivariant etc respectively .
PHASE RULE
The phase rule was first established by J.W. Gibbs in 1874 .
It’s a general relation between the variance , the number of
components and the number of phases present at
equilibrium . The relation is
F = C – P + 2
Here
F = Variance
C = Number of Components
P = Number of Phases at Equilibrium
Here 2 is for the intensive variable temperature & pressure.
ONE COMPONENT SYSTEM
A system which consists of different phases of the same
chemical species at equilibrium is called a one
component system . Some examples of one component
systems are H2O system , CO2 system , S system etc .
Phase diagram of a one component
system (Water System)
We are taking water system as a one component system .
H2O being the only chemical constituent , water system is a
one
Fig : Phase diagram of water system
component system . Water system is consist of three
phases as solid phase (ice) , liquid phase & vapour phase
. The number of these phases which can exist in
equilibrium at any time depends on the conditions of
temperature and pressure.
The equilibrium diagram is consist of three curves
OA , OB and OC all meeting at the point O . These
curves divide the diagram into three areas AOC , AOB
and BOC .
AREAS ( Bivariant system )
Single phases ( ice ,
water , vapour ) are
capable of stable
existence . In the
phase diagram of
water ,
AOC represents the liquid phase
AOB represents the vapour phase
BOC represents the solid phase
To define the system completely at any point in these
areas both the temperature and pressure are necessary
( as the ordinate ) . From the phase rule
F = C- P + 2
= 1 – 1 + 2
= 2
Thus the phase areas have two degrees of freedom .
CURVES ( Univariant System )
Curve OA : The Vapour Pressure Curve
It represents the equilibrium between liquid water
and vapour at different temperatures . From the phase
rule :
F= C-P+2
= 1-2+2
= 1
The curve has one degree
of freedom . To describe
the system at any time
it is necessary to state either temperature or pressure . If
we fix the temperature , the pressure will be fixed
automatically . So the system is univariant .
The upper end of the curve OA is marked by the
critical point A , where the liquid and vapour phase
merge together and result into a homogeneous phase .
The critical temperature of water is +3740 C at 218.5 atm
pressure .
Curve OB : The Sublimation Curve
This curve represents the equilibrium between ice
and vapour . The system is univariant along this curve .
For each temperature there
is only one pressure at which
water vapour is in equilibrium
with solid ice . Similarly for
each pressure there is only one
temperature at which both
the phases coexists . The lower end of the curve extends
to absolute zero , -2730 C temperature .
Curve OC : The Fusion Curve
This curve represents the equilibrium between ice and
water . It is called the fusion curve of ice or the melting
point curve .
F= C-P+2
= 1-2+2
= 1
The curve has a one
degree of freedom .
This curve shows the effect of pressure on melting point
of ice . The curve is slightly inclined towards the pressure
axis . It indicates that the melting point of ice decreases
with increase in pressure . This is because the density
increases as the volume of ice decreases on melting ,
which is exceptional from other substances . That’s why
the curve shows a negative slope .
From Clapeyron equation ,
VT
H
dT
dP
trs
trs



When ice melts into water ,
VT
H
dT
dP
fus
fus



= Enthalpy change for fusion
= Temperature
= Change of volume for fusion
Here increases with increase in temperature ,
but volume decreases .
< 0
So the slope becomes negative .
Hfus
T
Vfus
Hfus
iffus VVV 
dT
dP
Curve OA’ : The Metastable Equilibrium
The curve represents the liquid water and water vapour
at metastable equilibrium . It is sometimes possible to
cool water below it’s freezing point without turning
into solid ice . It is
called the super
cooled water . It’s a
very unstable
condition . In
presence of ice or
any other solid or
by stirring , it
instantly converts
into solid ice .
The Point O
The three curves OA , OB and OC meet at point O .
This point is known as the TRIPLE POINT . At this
point the three phases ( solid , liquid and vapour ) of
water system
remain in
equilibrium with
each other .
From the phase
rule :
F = 1-3+2
= 0
This means that the point has no degree of freedom ,
the system is INVARIANT . The point has a definite
temperature and pressure which is 0.0098o C ( 273.16 K
) at 4.58 mm pressure . Neither the temperature nor the
pressure can be varied . Any change in temperature or
pressure will destroy the equilibrium among the three
phases .
THANK YOU
EVERYONE

Phase diagram of a one component system ( water system )

  • 1.
    Presented by Md.Shahriar KabirTipu FH-056 Department of Chemistry University of Dhaka
  • 2.
    Topics will bediscussed :  Phase  Component  Phase diagram  Degree of Freedom  Phase rule  Phase diagram of a one component system
  • 3.
    PHASE A phase isdefined as a homogeneous , physically distinct and mechanically separable portion of a system which is separated from other such parts of the system by definite boundary surface . Some examples of some phases are solid , liquid and vapor phase of a substance.
  • 4.
    PHASE DIAGRAM A diagramwhich illustrates the conditions of equilibrium between various forms or phases of a substance is called a phase diagram or equilibrium diagram .
  • 5.
    COMPONENTS The components aredefined as the least number of chemical constituents by means of which the composition of each phase can be expressed in the form of an equation . The water system for example , consists of one component ; the composition of each of the three phases ( solid , liquid , vapor ) can be expressed in terms of the component H2O .
  • 6.
    In the decompositionof Calcium Carbonate CaCO3(s) = CaO (s) + CO2 (g) Here we have three phases , solid CaCO 3 , solid CaO and CO2 gas . The three constituents present in the system are CaCO3 , CaO and CO2 . We can use any two constituents as component to express all the phases present in the system . If we take CaO and CO2 as component then Phase Components CaCO3 (s) = CaO (s) + CO2 (g) CaO (s) = CaO (s) + 0 CO2 (g) CO2 (g) = 0 CaO (s) + CO2 (g) So decomposition of calcium carbonate is a two component system .
  • 7.
    Degree of Freedom Itis defined as the least number of variable factors of a system such as temperature , pressure and concentration which must be specified so that the remaining variables are fixed automatically and the system is completely defined . System possessing one , two , three etc degrees of freedom are said to be univariant , bivariant , trivariant etc respectively .
  • 8.
    PHASE RULE The phaserule was first established by J.W. Gibbs in 1874 . It’s a general relation between the variance , the number of components and the number of phases present at equilibrium . The relation is F = C – P + 2 Here F = Variance C = Number of Components P = Number of Phases at Equilibrium Here 2 is for the intensive variable temperature & pressure.
  • 9.
    ONE COMPONENT SYSTEM Asystem which consists of different phases of the same chemical species at equilibrium is called a one component system . Some examples of one component systems are H2O system , CO2 system , S system etc .
  • 10.
    Phase diagram ofa one component system (Water System) We are taking water system as a one component system . H2O being the only chemical constituent , water system is a one Fig : Phase diagram of water system
  • 11.
    component system .Water system is consist of three phases as solid phase (ice) , liquid phase & vapour phase . The number of these phases which can exist in equilibrium at any time depends on the conditions of temperature and pressure. The equilibrium diagram is consist of three curves OA , OB and OC all meeting at the point O . These curves divide the diagram into three areas AOC , AOB and BOC .
  • 12.
    AREAS ( Bivariantsystem ) Single phases ( ice , water , vapour ) are capable of stable existence . In the phase diagram of water , AOC represents the liquid phase AOB represents the vapour phase BOC represents the solid phase
  • 13.
    To define thesystem completely at any point in these areas both the temperature and pressure are necessary ( as the ordinate ) . From the phase rule F = C- P + 2 = 1 – 1 + 2 = 2 Thus the phase areas have two degrees of freedom .
  • 14.
    CURVES ( UnivariantSystem ) Curve OA : The Vapour Pressure Curve It represents the equilibrium between liquid water and vapour at different temperatures . From the phase rule : F= C-P+2 = 1-2+2 = 1 The curve has one degree of freedom . To describe the system at any time
  • 15.
    it is necessaryto state either temperature or pressure . If we fix the temperature , the pressure will be fixed automatically . So the system is univariant . The upper end of the curve OA is marked by the critical point A , where the liquid and vapour phase merge together and result into a homogeneous phase . The critical temperature of water is +3740 C at 218.5 atm pressure .
  • 16.
    Curve OB :The Sublimation Curve This curve represents the equilibrium between ice and vapour . The system is univariant along this curve . For each temperature there is only one pressure at which water vapour is in equilibrium with solid ice . Similarly for each pressure there is only one temperature at which both the phases coexists . The lower end of the curve extends to absolute zero , -2730 C temperature .
  • 17.
    Curve OC :The Fusion Curve This curve represents the equilibrium between ice and water . It is called the fusion curve of ice or the melting point curve . F= C-P+2 = 1-2+2 = 1 The curve has a one degree of freedom .
  • 18.
    This curve showsthe effect of pressure on melting point of ice . The curve is slightly inclined towards the pressure axis . It indicates that the melting point of ice decreases with increase in pressure . This is because the density increases as the volume of ice decreases on melting , which is exceptional from other substances . That’s why the curve shows a negative slope . From Clapeyron equation , VT H dT dP trs trs   
  • 19.
    When ice meltsinto water , VT H dT dP fus fus    = Enthalpy change for fusion = Temperature = Change of volume for fusion Here increases with increase in temperature , but volume decreases . < 0 So the slope becomes negative . Hfus T Vfus Hfus iffus VVV  dT dP
  • 20.
    Curve OA’ :The Metastable Equilibrium The curve represents the liquid water and water vapour at metastable equilibrium . It is sometimes possible to cool water below it’s freezing point without turning into solid ice . It is called the super cooled water . It’s a very unstable condition . In presence of ice or any other solid or by stirring , it instantly converts into solid ice .
  • 21.
    The Point O Thethree curves OA , OB and OC meet at point O . This point is known as the TRIPLE POINT . At this point the three phases ( solid , liquid and vapour ) of water system remain in equilibrium with each other . From the phase rule : F = 1-3+2 = 0
  • 22.
    This means thatthe point has no degree of freedom , the system is INVARIANT . The point has a definite temperature and pressure which is 0.0098o C ( 273.16 K ) at 4.58 mm pressure . Neither the temperature nor the pressure can be varied . Any change in temperature or pressure will destroy the equilibrium among the three phases .
  • 23.