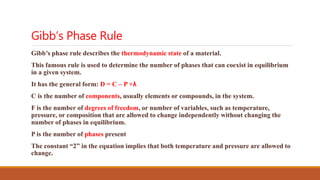
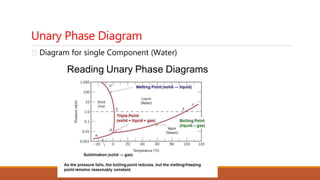
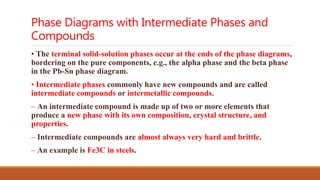
Engineering notes
SUBJECT: MATERIAL SCIENCE
“PHASE DIAGRAM AND EQUILIBRIUM DIAGRAM”
PREPARED BY: ADITYA PRAKASH
(MAIL ID: ADI000055@GMAIL.COM)
Phase Diagram
And
Equilibrium Diagram
PHASE
A phase is a state of matter with the following
characteristics:
It has the same structure or atomic arrangement throughout
It has roughly the same composition and properties
throughout.
There exists a definite interface between it and its
surroundings or adjoining phases.
A system may be made up of one, two or more phases
Phase Diagrams
A phase diagram is a graphical representation of the phases
that are present in a material at various temperatures and
pressures and compositions.
It usually describes the equilibrium conditions. Hence also
known as equilibrium diagrams
Sometimes non-equilibrium conditions are also shown when
well known.
Ex: Melting point of tungsten is 3400o C and Aluminum
657o C hence two elements can not blend together .
Phase Diagram
• It indicates the melting/solidification temperatures of the constituents
• It indicates the compositions of alloys where solidification begins and the temperature range over which it
occurs.
For a pure substance, the Pressure-Temperature phase diagram simply tells which forms (solid, liquid, gas)
of the material exist under different P-T conditions.
Phase diagram for
magnesium, showing
the melting and boiling
tempratures at one
atmosphere pressure
Phase diagram for water
General Types of Solid Solutions
A homogeneous mixture of atoms of two or more elements in solid state is called Solid
Solution
There are two general types of alloys having phase diagrams.
• Substitutional alloys
• Interstitial alloys
Subtitutional alloys have elements, which are incorporated into regular
lattice positions within the unit cell.
An example is Tin and Zinc alloying additions to Copper to form bronze and brass,
respectively
Interstitial alloys have elements, which are incorporated into the interstitial sites of the
unit cell.
An example is carbon in iron to form steel.
W. Hume – Rothery’s rules
Hume-Rothery has given criteria in regard to Substitutional solid solution
these are known as W. Hume – Rothery rules
Similar Crystal Structure: 2 or more metals should have same crystal stucture
such as FCC & FCC or BCC & BCC
Relative Atomic Size: The atoms of two metals should have their size with in
15% of each other, if solid size difference is more than 15% then only limited
solubility is otained
Valency Criteria : The valency of base metal and alloying metal should be
same
Electronegativity: The solid solubility is limited if two metal possess greater
electronegativity.
Gibb’s Phase Rule
Gibb’s phase rule describes the thermodynamic state of a material.
This famous rule is used to determine the number of phases that can coexist in equilibrium in a
given system.
It has the general form: D = C – P +λ
C is the number of components, usually elements or compounds, in the system.
D is the number of degrees of freedom, or number of variables, such as temperature, pressure,
or composition that are allowed to change independently without changing the number of phases
in equilibrium.
P is the number of phases present
The constant λ is system variable here the variable is taken as “2”implies that both temperature
and pressure are allowed to change.
Gibb’s Phase Rule
Gibb’s phase rule describes the thermodynamic state of a material.
This famous rule is used to determine the number of phases that can coexist in equilibrium
in a given system.
It has the general form: D = C – P +λ
C is the number of components, usually elements or compounds, in the system.
F is the number of degrees of freedom, or number of variables, such as temperature,
pressure, or composition that are allowed to change independently without changing the
number of phases in equilibrium.
P is the number of phases present
The constant “2” in the equation implies that both temperature and pressure are allowed to
change.
Gibb’s Phase Rule
For the triple point of water:
• One component, i.e., water.
• 3 phases present, i.e. vapor, liquid, and solid.
• F = 1 – 3 + 2 = 0, so this is an invariant point on the diagram
Classification of Phase Diagram
Plot showing relation between temperature Vs Composition in a phase diagram
can be classified as below:
•Unary Phase Diagram
•Binary Phase Diagram
•Ternary Phase Diagram
•Quaternary Phase Diagram
Unary Phase Diagram
Diagram for single Component (Water)
Binary Phase Diagram
When only two elements or two compounds are present in a material, a binary
phase diagram can be constructed.
They are found in number of Metallic & Ceramic structures like Cu-Ni alloy etc.
Liquidus/Solidus Temperatures
The liquidus temperature is the temperature above which a material is completely liquid.
The solidus temperature is the temperature which the alloy is 100% solid.
The freezing range of the alloy is the temperature difference between the liquidus and solidus where the two phases exists, ie., the
liquid and solid.
The changes in slope of the cooling curve indicate the liquidus ab=nd solidus tempratures.
Tie Line
Tie Line: is the line joining
solidus & liquidus curves.
A binary phase diagram between
two elements A and B. When an
alloy is present in a two phase
region, a tie line at the
temperature of interest fixes the
composition of the two phases.
Lever Rule
The Lever Rule is used to calculate the weight % of the phase in any two-phaseregion of the Phase
diagram (and only the two phase region!)
In general:
• Phase percent = opposite arm of lever x 100
total length of the tie line
• If we know T and C0, then we can determine:
-- the composition of each phase.
Phase Diagrams:
Determination of phase weight fractions
Lever Rule
Calculate the amount of a phase and L phase present in a Cu40% Ni alloy at 1250 C
In general:
• Percent a phase = (% Ni in alloy) – (% Ni in L) x 100
% Ni in L - % Ni in a
Solidification of a Solid-Solution Alloy
The change in structure and composition of a Cu-40%
Ni alloy during equilibrium solidification showing that
the liquidcontains 40% Ni and the first solid contains
Cu52%Ni. At 1250 C,
solidification has advanced and the phase diagram
tells us that the liquid contains 32% Ni and the solid
contains 45% Ni, which continues until just below the
solidus,
all of the solidcontains 40% Ni, which is achieved
through diffusion.
Phase Diagrams with Intermediate Phases and
Compounds
Many combinations of two elements produce more complicated phase
diagrams than the isomorphous systems and the simple eutectic systems.
• Many equilibrium diagrams often show intermediate phases and
compounds when either incomplete solubility or compound formation
occurs.
• These new phases are distinguished by the labels “terminal phases” and
“intermediate phases”.
• Their phase diagrams look complex.
Phase Diagrams with Intermediate Phases and
Compounds
• The terminal solid-solution phases occur at the ends of the phase diagrams,
bordering on the pure components, e.g., the alpha phase and the beta phase
in the Pb-Sn phase diagram.
• Intermediate phases commonly have new compounds and are called
intermediate compounds or intermetallic compounds.
– An intermediate compound is made up of two or more elements that
produce a new phase with its own composition, crystal structure, and
properties.
– Intermediate compounds are almost always very hard and brittle.
– An example is Fe3C in steels.
Thank You

Phase diagram and equilibrium diagram

  • 1.
    Engineering notes SUBJECT: MATERIALSCIENCE “PHASE DIAGRAM AND EQUILIBRIUM DIAGRAM” PREPARED BY: ADITYA PRAKASH (MAIL ID: ADI000055@GMAIL.COM)
  • 2.
  • 3.
    PHASE A phase isa state of matter with the following characteristics: It has the same structure or atomic arrangement throughout It has roughly the same composition and properties throughout. There exists a definite interface between it and its surroundings or adjoining phases. A system may be made up of one, two or more phases
  • 4.
    Phase Diagrams A phasediagram is a graphical representation of the phases that are present in a material at various temperatures and pressures and compositions. It usually describes the equilibrium conditions. Hence also known as equilibrium diagrams Sometimes non-equilibrium conditions are also shown when well known. Ex: Melting point of tungsten is 3400o C and Aluminum 657o C hence two elements can not blend together .
  • 5.
    Phase Diagram • Itindicates the melting/solidification temperatures of the constituents • It indicates the compositions of alloys where solidification begins and the temperature range over which it occurs. For a pure substance, the Pressure-Temperature phase diagram simply tells which forms (solid, liquid, gas) of the material exist under different P-T conditions. Phase diagram for magnesium, showing the melting and boiling tempratures at one atmosphere pressure Phase diagram for water
  • 6.
    General Types ofSolid Solutions A homogeneous mixture of atoms of two or more elements in solid state is called Solid Solution There are two general types of alloys having phase diagrams. • Substitutional alloys • Interstitial alloys Subtitutional alloys have elements, which are incorporated into regular lattice positions within the unit cell. An example is Tin and Zinc alloying additions to Copper to form bronze and brass, respectively Interstitial alloys have elements, which are incorporated into the interstitial sites of the unit cell. An example is carbon in iron to form steel.
  • 7.
    W. Hume –Rothery’s rules Hume-Rothery has given criteria in regard to Substitutional solid solution these are known as W. Hume – Rothery rules Similar Crystal Structure: 2 or more metals should have same crystal stucture such as FCC & FCC or BCC & BCC Relative Atomic Size: The atoms of two metals should have their size with in 15% of each other, if solid size difference is more than 15% then only limited solubility is otained Valency Criteria : The valency of base metal and alloying metal should be same Electronegativity: The solid solubility is limited if two metal possess greater electronegativity.
  • 8.
    Gibb’s Phase Rule Gibb’sphase rule describes the thermodynamic state of a material. This famous rule is used to determine the number of phases that can coexist in equilibrium in a given system. It has the general form: D = C – P +λ C is the number of components, usually elements or compounds, in the system. D is the number of degrees of freedom, or number of variables, such as temperature, pressure, or composition that are allowed to change independently without changing the number of phases in equilibrium. P is the number of phases present The constant λ is system variable here the variable is taken as “2”implies that both temperature and pressure are allowed to change.
  • 9.
    Gibb’s Phase Rule Gibb’sphase rule describes the thermodynamic state of a material. This famous rule is used to determine the number of phases that can coexist in equilibrium in a given system. It has the general form: D = C – P +λ C is the number of components, usually elements or compounds, in the system. F is the number of degrees of freedom, or number of variables, such as temperature, pressure, or composition that are allowed to change independently without changing the number of phases in equilibrium. P is the number of phases present The constant “2” in the equation implies that both temperature and pressure are allowed to change.
  • 10.
    Gibb’s Phase Rule Forthe triple point of water: • One component, i.e., water. • 3 phases present, i.e. vapor, liquid, and solid. • F = 1 – 3 + 2 = 0, so this is an invariant point on the diagram
  • 11.
    Classification of PhaseDiagram Plot showing relation between temperature Vs Composition in a phase diagram can be classified as below: •Unary Phase Diagram •Binary Phase Diagram •Ternary Phase Diagram •Quaternary Phase Diagram
  • 12.
    Unary Phase Diagram Diagramfor single Component (Water)
  • 13.
    Binary Phase Diagram Whenonly two elements or two compounds are present in a material, a binary phase diagram can be constructed. They are found in number of Metallic & Ceramic structures like Cu-Ni alloy etc.
  • 14.
    Liquidus/Solidus Temperatures The liquidustemperature is the temperature above which a material is completely liquid. The solidus temperature is the temperature which the alloy is 100% solid. The freezing range of the alloy is the temperature difference between the liquidus and solidus where the two phases exists, ie., the liquid and solid. The changes in slope of the cooling curve indicate the liquidus ab=nd solidus tempratures.
  • 15.
    Tie Line Tie Line:is the line joining solidus & liquidus curves. A binary phase diagram between two elements A and B. When an alloy is present in a two phase region, a tie line at the temperature of interest fixes the composition of the two phases.
  • 16.
    Lever Rule The LeverRule is used to calculate the weight % of the phase in any two-phaseregion of the Phase diagram (and only the two phase region!) In general: • Phase percent = opposite arm of lever x 100 total length of the tie line
  • 17.
    • If weknow T and C0, then we can determine: -- the composition of each phase.
  • 18.
    Phase Diagrams: Determination ofphase weight fractions
  • 19.
    Lever Rule Calculate theamount of a phase and L phase present in a Cu40% Ni alloy at 1250 C In general: • Percent a phase = (% Ni in alloy) – (% Ni in L) x 100 % Ni in L - % Ni in a
  • 20.
    Solidification of aSolid-Solution Alloy The change in structure and composition of a Cu-40% Ni alloy during equilibrium solidification showing that the liquidcontains 40% Ni and the first solid contains Cu52%Ni. At 1250 C, solidification has advanced and the phase diagram tells us that the liquid contains 32% Ni and the solid contains 45% Ni, which continues until just below the solidus, all of the solidcontains 40% Ni, which is achieved through diffusion.
  • 24.
    Phase Diagrams withIntermediate Phases and Compounds Many combinations of two elements produce more complicated phase diagrams than the isomorphous systems and the simple eutectic systems. • Many equilibrium diagrams often show intermediate phases and compounds when either incomplete solubility or compound formation occurs. • These new phases are distinguished by the labels “terminal phases” and “intermediate phases”. • Their phase diagrams look complex.
  • 25.
    Phase Diagrams withIntermediate Phases and Compounds • The terminal solid-solution phases occur at the ends of the phase diagrams, bordering on the pure components, e.g., the alpha phase and the beta phase in the Pb-Sn phase diagram. • Intermediate phases commonly have new compounds and are called intermediate compounds or intermetallic compounds. – An intermediate compound is made up of two or more elements that produce a new phase with its own composition, crystal structure, and properties. – Intermediate compounds are almost always very hard and brittle. – An example is Fe3C in steels.
  • 26.