Downloaded 1,064 times

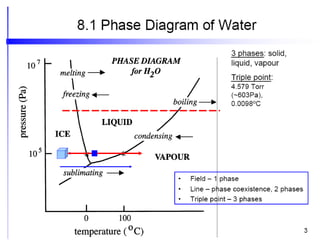
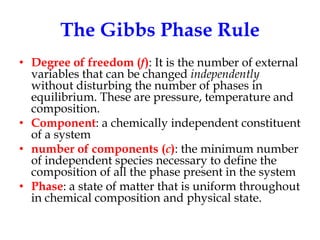
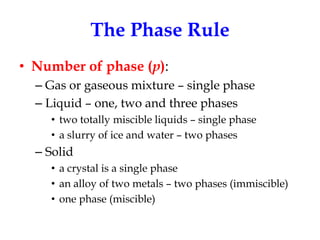


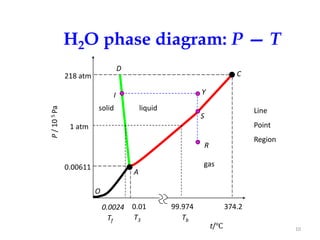
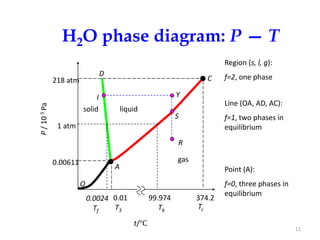

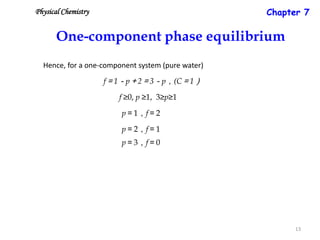


The document discusses the phase rule, which relates the degrees of freedom, number of components, and number of phases in a system at equilibrium. It defines key terms like phase diagram, phase boundary, component, and phase. The phase rule statement is f=c-p+2, where f is degrees of freedom, c is number of components, and p is number of phases. For a single-component system like water, this means the degrees of freedom is 2 when one phase is present, 1 when two phases coexist, and 0 when three phases are in equilibrium. Examples are also given for solid, liquid, and gas phases in water and metallurgical systems where pressure is constant.


